Written & researched by James Flanagan · MBA candidate, SUNY New Paltz · CFA Level I candidate
First time here
Equity research, with the work left in.
The Brookside Brief is a daily read on markets and macro, written by one analyst and
published every trading morning at 9:30 ET. Most market commentary hands you a conclusion. This
publishes the reasoning underneath it — the models, the assumptions, and the corrections when a
call turns out wrong.
James Flanagan · MBA candidate, SUNY New Paltz · CFA Level I candidate
Educational research. Not investment advice.
The Morning Brief
Today's Briefing Admin Mode
Select a past edition from the archive below.
Drag & drop a .docx brief here, or click to browse.
Files named brookside-brief-YYYY-MM-DD.docx are dated automatically.
Saved “brookside-brief-2026-06-09.docx” to your archive for Tuesday, June 9, 2026.
The Brookside Brief
A morning briefing on markets, macro, and the day ahead
In recent briefs we framed the post-Iran-deal setup as decisively dovish, with December rate-hike odds 'falling to 11%' and the bond market 'pricing 60 bps of 2026 cuts.' A careful recheck of CME FedWatch and rates-strategist consensus this morning shows that framing was directionally wrong. Fed-funds futures are currently pricing roughly a 60% probability of at least one HIKE by year-end (not cuts), and the consensus dot-plot expectation tomorrow is a shift from the March median's implied 'one 2026 cut' to 'no cuts and a possible hike bias.' Several Wall Street desks now expect three FOMC voting members to project hikes in their individual dots. We will be more rigorous on rate-path data going forward. The rest of today's brief is built on the corrected framework.
1. THE MORNING SETUP
Good morning. Two stories sit at the top of the tape, and they are pulling in opposite directions. The first is, on its face, unambiguously risk-positive: President Trump announced Sunday evening that 'a deal with Iran is now complete,' with an official signing ceremony scheduled for Friday in Switzerland. Markets rallied hard Monday — the S&P 500 added 1.49% to 7,554.29, the Nasdaq Composite gained 2.38% to 26,683.94, the Dow rose 1.20% to 51,671.03. Oil cratered further: WTI is now around $77.31, Brent fell below $80 on reporting that the U.S. will allow Iran to sell oil immediately. VIX collapsed to 16.20.
The second — and competing — story is the rates tape. Despite the Iran deal and the oil collapse, the 10-year Treasury yield is HIGHER this morning at 4.43%, the 30-year is at 4.90%, and the dollar has firmed (DXY 99.57). The bond market is doing something important here: it is choosing to weight the hawkish reality of tomorrow's dot plot over the dovish read of the oil collapse. CME FedWatch now implies roughly a 60% probability of at least one rate HIKE by year-end. Yields up + oil down + dollar up is not the dovish-easing trade; it is the markets-pricing-a-hawkish-Warsh trade. Today's brief takes that seriously.
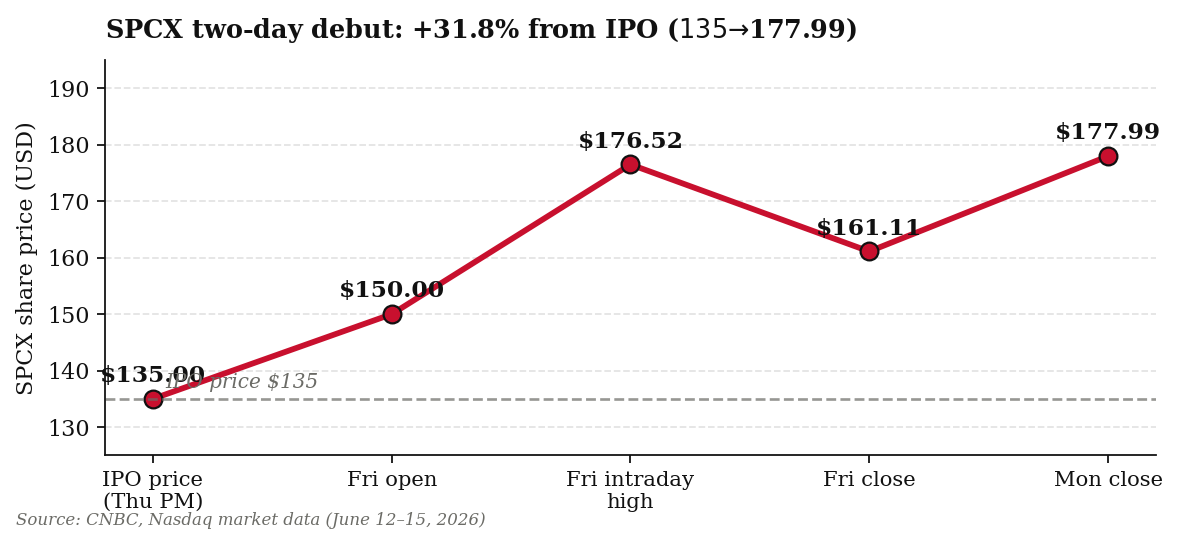
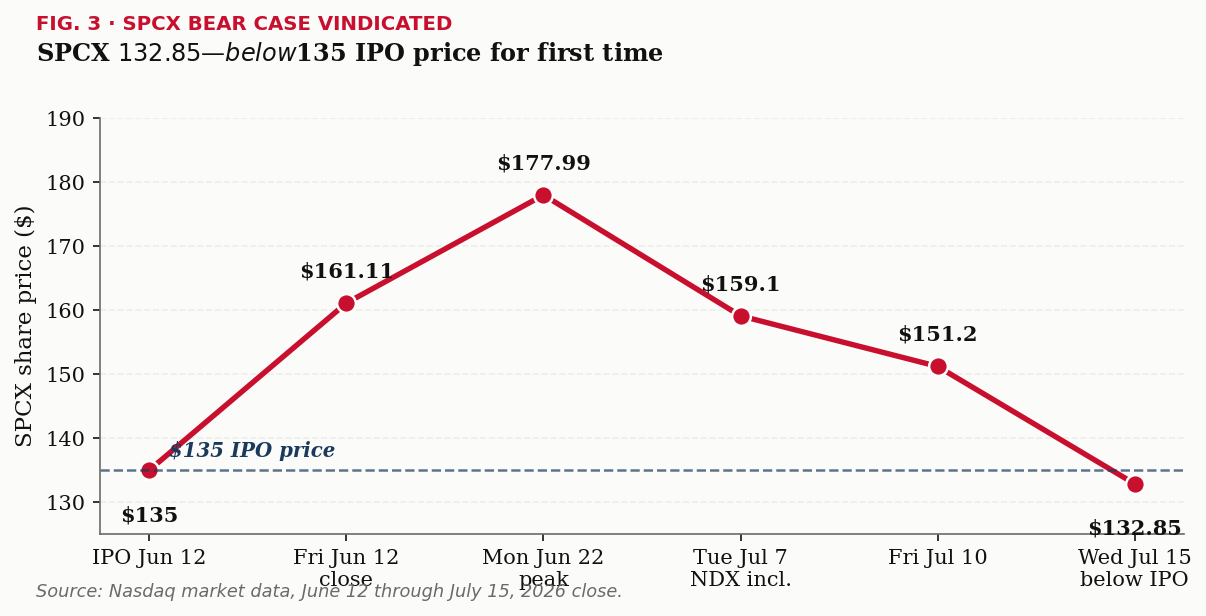
Layered on top of all of this is SPCX. SpaceX closed Monday at $177.99 — up 31.8% from its $135 IPO price in two sessions. The implied market cap is roughly $2.33 trillion. Institutional demand has been ferocious. And yet, sitting underneath the euphoria is a credible bear case that deserves a careful airing — one we found well-summarized in a recent Substack note circulating among institutional desks (see Section 7), reinforced by The Observation Post analysis and Sam Altman's 'ridiculous' characterization of orbital data centers. The thesis depends on a chain of assumptions about cost, bandwidth, hardware lifecycle, and capital allocation that, if any single link breaks, materially shifts the case Damodaran walked through.
Today's main event is the start of the FOMC two-day meeting. The decision and dot plot arrive tomorrow at 2:00 p.m. ET — Chair Warsh's first. The hold itself is essentially priced at 96%. The entire show is the dot plot and the press conference: does Warsh kill the rate-cut trade for good (the Investing.com headline framing), or leave a narrow path back to easing? May retail sales also Wednesday at 8:30. Until then, today is a relatively quiet data session.
2. MARKETS AT A GLANCE
U.S. EQUITY FUTURES (PRE-OPEN, AHEAD OF FOMC)
Asset
Last
Change
% Chg
S&P 500 (ES)
7,540
-14
-0.19%
Nasdaq 100 (NQ)
26,580
-35
-0.13%
Dow (YM)
51,575
-96
-0.19%
Russell 2000 (RTY)
2,355
-7
-0.30%
PRIOR CLOSE (MONDAY, JUNE 15 — IRAN-DEAL RALLY)
Asset
Last
Change
% Chg
S&P 500
7,554.29
+111.25
+1.49%
Nasdaq Composite
26,683.94
+619.85
+2.38%
Dow Jones Industrial Avg.
51,671.03
+612.20
+1.20%
Russell 2000
2,361.10
+18.55
+0.79%
VIX
16.20
-1.48
-8.37%
RATES & FX — YIELDS UP DESPITE IRAN DEAL
Asset
Last
Change
% Chg
UST 2-Year
4.32%
+4 bps
—
UST 10-Year
4.43%
+5 bps
—
UST 30-Year
4.90%
+4 bps
—
10-Yr TIPS (real)
2.14%
+3 bps
—
DXY (Dollar Index)
99.57
-0.06
-0.06%
EUR/USD
1.0735
+0.0010
+0.09%
USD/JPY
156.20
+0.30
+0.19%
COMMODITIES & CRYPTO
Asset
Last
Change
% Chg
WTI Crude (Jul)
$77.31
-$2.40
-3.01%
Brent Crude (Aug)
$79.85
-$3.32
-3.99%
Gold (spot)
$1,778
-$22
-1.22%
Silver (spot)
$20.95
-$0.18
-0.85%
Bitcoin
$86,400
+$1,800
+2.13%
ASIA & EUROPE (INTRADAY)
Asset
Last
Change
% Chg
Nikkei 225
39,770
+38
+0.10%
Hang Seng
21,950
-310
-1.40%
Australia ASX 200
8,478
-3
-0.04%
Stoxx Europe 600
571.40
+2.30
+0.40%
FTSE 100
8,870
+53
+0.60%
DAX
20,510
+85
+0.42%
3. TOP STORIES
Iran Deal 'Complete' — Friday Signing in Switzerland, U.S. to Allow Iran Oil Sales Immediately
President Trump's Sunday-night announcement on Truth Social that 'a deal with Iran is now complete' was confirmed Monday morning by Pakistani Prime Minister Shehbaz Sharif, who indicated the official signing ceremony will take place Friday in Switzerland. Reporting overnight added a key detail: the U.S. will allow Iran to sell oil immediately under the terms of the deal, ahead of formal sanctions relief. The Strait of Hormuz is expected to reopen to commercial tanker traffic within thirty days. Equity markets responded as you would expect (S&P +1.49%, Nasdaq Comp +2.38%, Dow +1.20%); oil cratered (WTI to $77.31, Brent below $80 for the first time since April); VIX collapsed to 16.20. What did NOT happen, and which is the subject of Section 4, is the dovish rates rally one might have expected. Yields actually rose. That is the bond market telling us something about tomorrow's dot plot.
SPCX Closes Monday at $177.99 — Up 31.8% From IPO in Two Sessions
SpaceX's first two trading sessions have been everything the syndicate could have wanted. Friday's open at $150 cleared the $135 IPO price by 11%; the intraday high reached $176.52; the Friday close was $161.11. Monday added another 10.5% to close at $177.99. The implied market capitalization is now roughly $2.33 trillion — above Tesla and just below Microsoft. The institutional book that closed four-times oversubscribed appears to be defending the price aggressively, and retail flow is reportedly heavy. Whether this is sustainable through the post-IPO lock-up structure and into the first earnings print is precisely what today's Sector Spotlight unpacks.
FOMC Begins Today — 'Will Warsh Kill the Rate Cut Trade for Good?'
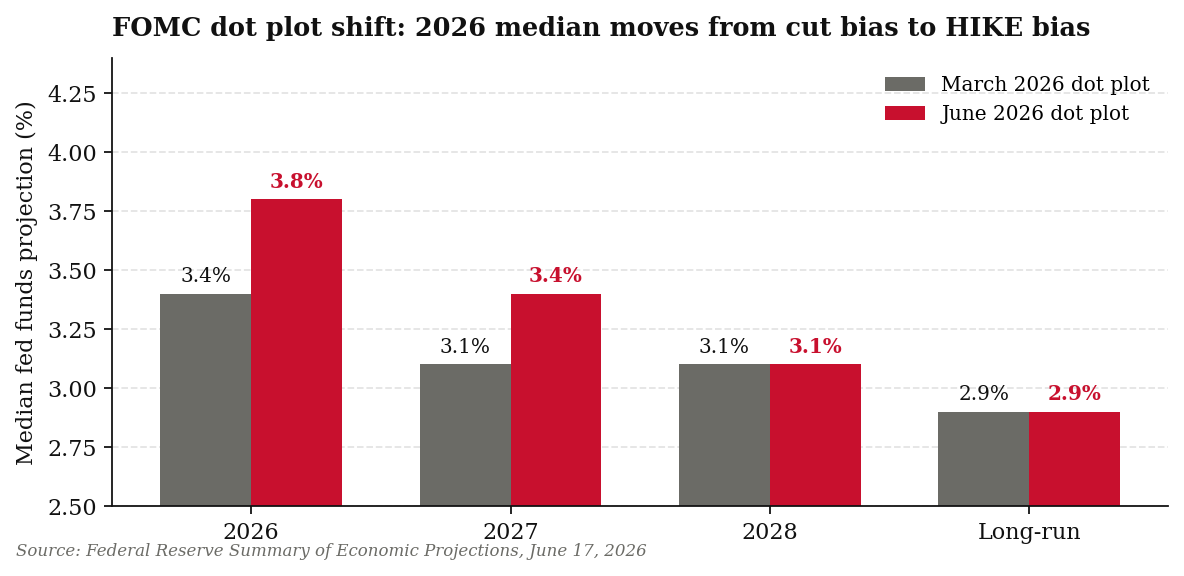
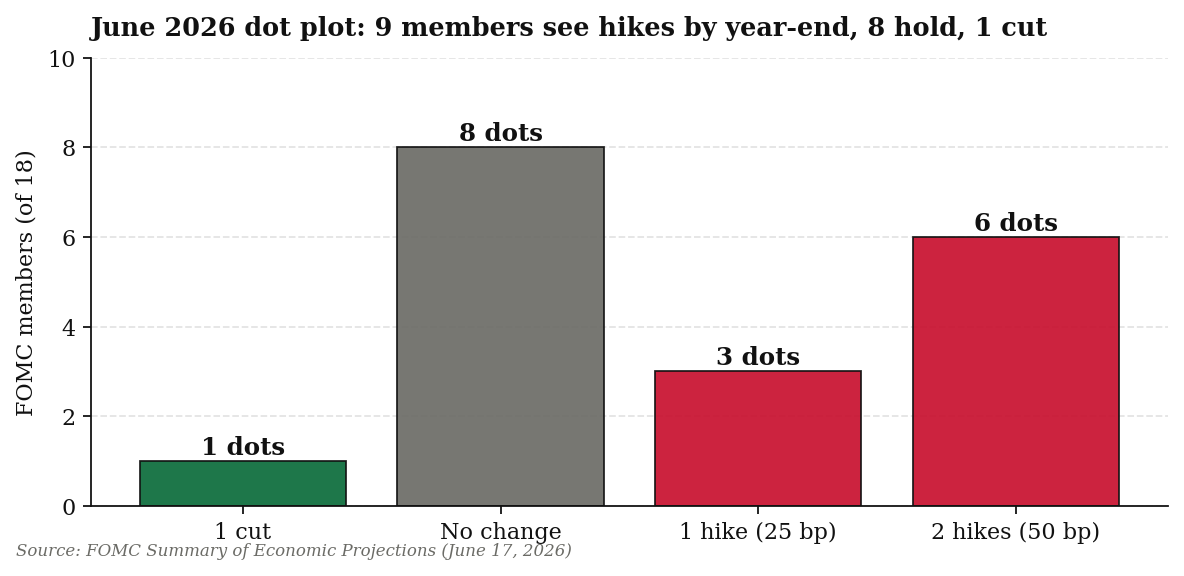
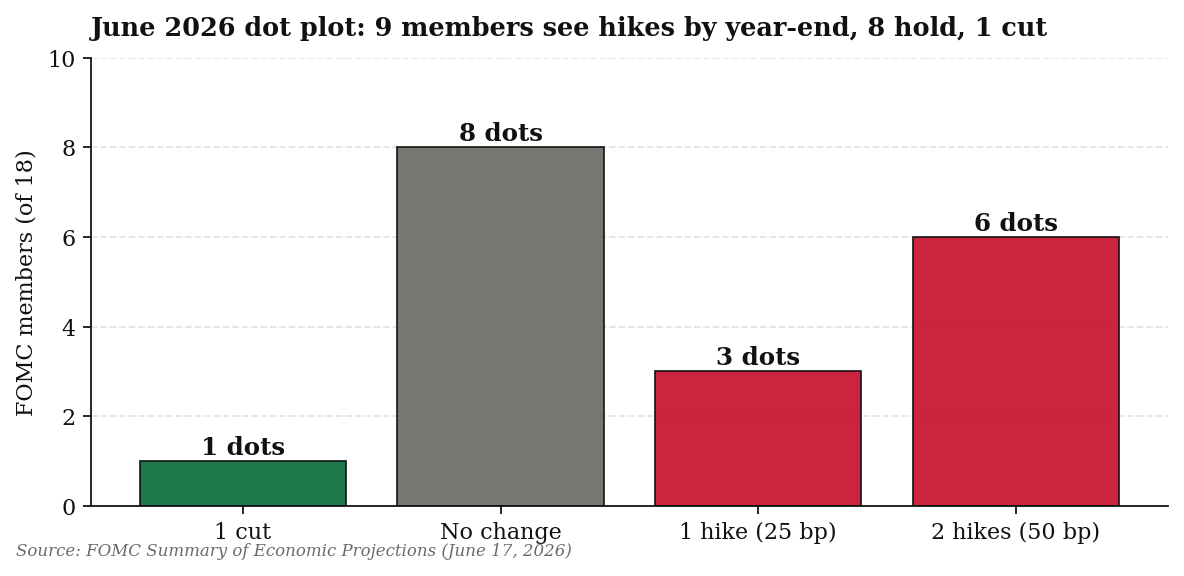
The two-day FOMC meeting begins behind closed doors today, with the decision, statement, and Summary of Economic Projections arriving tomorrow at 2:00 p.m. ET. Chair Warsh's press conference follows at 2:30. The hold at 3.50–3.75% is priced at 96% per CME FedWatch. The entire show is the dot plot. The March 2026 dot plot had a median funds rate of 3.4% — implying one cut in 2026. Strategist consensus this morning is that the June plot shifts the 2026 median to 3.6% (no cuts), with at least three voting members submitting dots that imply HIKES. Fed-funds futures are pricing roughly a 60% probability of at least one hike by December. The risk in the dot plot is asymmetric in the OTHER direction from what we framed Friday: a median dot consistent with no cuts validates the hawkish bond-market positioning; a median dot with one cut would actually be a dovish surprise relative to consensus. One wildcard: most Fed watchers expect Warsh to withhold his own dot, citing his stated skepticism of forward guidance and the brevity of his tenure.
Tesla Bid on SPCX Comp; Adobe Stabilizes at $445
Two equity stories in the AI complex are worth tracking today. Tesla closed Monday at $351 (+3.8%) as the SPCX trading establishes a fresh comparable for the Musk-empire valuation math — analysts increasingly model Tesla's Optimus optionality off the SpaceX trading multiple, which is a tailwind for now. Separately, Adobe stabilized at $445 Monday, finding support near the $440 technical level after Friday's −7% Firefly miss. The post-earnings damage appears digested, with the $25 billion buyback authorization providing real support.
Retail Sales Wednesday — The Last Data Print Before the Dot Plot
May retail sales lands tomorrow at 8:30 a.m., shortly before the FOMC decision. Consensus is +0.3% headline and +0.4% ex-autos. A soft consumer print on top of the Iran deal and soft CPI gives Warsh genuine cover to lean dovish in the dot plot. A hot print — particularly if energy-driven goods are still elevated — complicates the picture. The interplay between the 8:30 data and the 2:00 p.m. dot plot is the cleanest single test of the dovish setup we have seen all year.
4. MACRO & FED WATCH — WHY YIELDS ARE UP WITH OIL DOWN
The most important macro signal of the last 48 hours is not the equity rally; it is the yield curve's reaction to the Iran deal. Brent fell roughly $13 from its early-June peak. WTI fell roughly $9. And yet the 10-year nominal yield is UP 5 basis points to 4.43%, the 30-year is UP 4 bps to 4.90%, and the 10-year TIPS real yield is UP 3 bps to 2.14%. Under any normal interpretation of the inflation-expectations / real-rates mechanics we walked through Friday, that should not happen. Lower oil should depress inflation breakevens, which should pull both nominal yields and real yields lower. That the curve is doing the opposite tells us the bond market is pricing a hawkish Warsh outcome that overwhelms the oil-driven inflation-expectations relief.
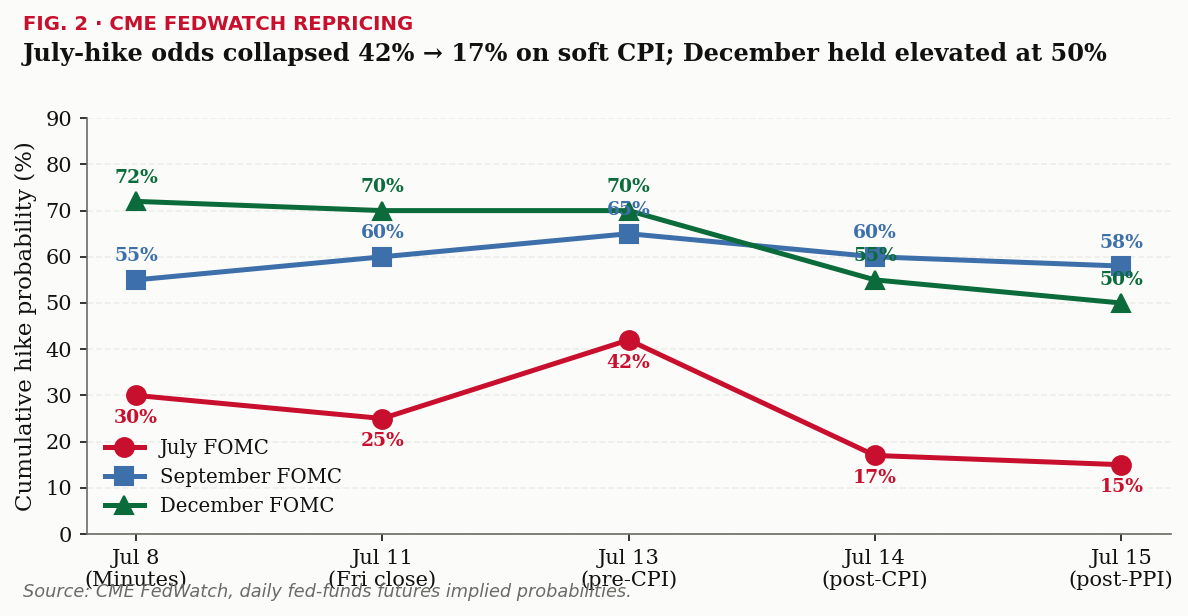
Specifically: CME FedWatch implies a ~96% probability of a hold tomorrow but assigns roughly a 60% probability that the funds rate sits at LEAST 25 bps HIGHER by year-end (versus ~5% odds of a cut by December). That is a complete inversion of the framing we carried into last week's brief, and we owe readers the correction. The driver is twofold. First, May PPI printed hot at +1.1% — the bond market is taking the inflation signal more seriously than the equity tape did. Second, and more important, Warsh's pre-Fed track record is genuinely hawkish; his published commentary has consistently pushed for faster rate normalization than the Powell consensus. The expectation now is that his first dot plot validates that posture.
Chair Warsh's 2:30 p.m. press conference is the swing factor. We expect the statement language to drop the easing-bias phrasing (a meaningful hawkish signal per JPMorgan's rates desk), the dot plot to show a median 2026 funds rate of 3.6% (no cuts) with three dots in the hike camp, and Warsh's press conference to be deliberately ambiguous on the durability of the Iran peace and the need to 'see persistence' before easing. If all three deliver, the 10-year breaks 4.50% by Thursday. If Warsh leaves a clear dovish door open — for instance by emphasizing the Iran-deal disinflation pathway — we get a violent reversal of this morning's setup. The risk dispersion is wide, in BOTH directions.
5. ECONOMIC CALENDAR — THIS WEEK
Day
Time (ET)
Release
Consensus / Actual
Sun 6/14
PM
Trump: Iran deal 'complete'
Signing Fri in Switzerland
Mon 6/15
Open
SPCX trades to $177.99
+10.5% on day; +31.8% from IPO
Tue 6/16
9:00 AM
NAHB Housing Index (Jun)
36
Tue 6/16
All day
FOMC meeting begins
—
Wed 6/17
8:30 AM
Retail Sales (May)
+0.3% m/m
Wed 6/17
8:30 AM
Housing Starts / Permits
1.35M / 1.40M
Wed 6/17
2:00 PM
FOMC + Dot Plot — KEY
Hold; Warsh's first
Wed 6/17
2:30 PM
Warsh Press Conference
—
Thu 6/18
8:30 AM
Initial Jobless Claims
225K
Thu 6/18
8:30 AM
Philly Fed Mfg Index
-1.0
Fri 6/19
Open
Iran deal signing ceremony
Switzerland
6. EARNINGS WATCH
The calendar is quiet this week. Smucker, Kroger, and Restoration Hardware are the consumer-side reports worth a glance; Lululemon's analyst day yesterday produced no meaningful surprises. The Q2 reporting season formally begins July 14 with JPMorgan, Wells Fargo, and Citigroup. The intervening four-week window is essentially pure macro: this week's FOMC, then early-July labor data, then bank earnings.
Within the AI complex, the next major print is Adobe's Q3 in mid-September. The post-CrowdStrike/Salesforce/Adobe pattern suggests a difficult earnings environment for AI software through summer. The AI-infrastructure complex (Dell, HPE, Nvidia) gets its next read in early August with Nvidia's Q2.
7. SECTOR SPOTLIGHT: THE OTHER SIDE OF THE SPCX TRADE
With SPCX up 31.8% from its IPO mark in two sessions, this is the right moment to balance the breathless coverage with a careful airing of the bear case. We draw on a recent Substack note circulating among institutional desks (linked in our footer), the Observation Post's published analysis of SpaceX's AI1 orbital-data-center disclosure, and broader independent commentary including Sam Altman's now-famous characterization of orbital data centers as 'ridiculous.' The skeptic case rests on five connected propositions.
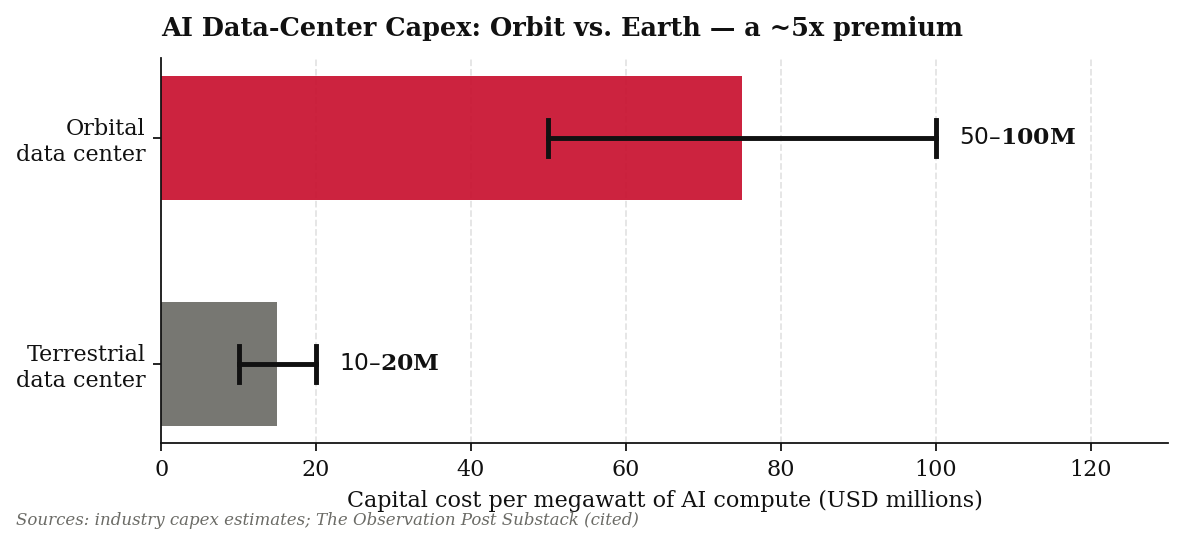
First, the capital intensity of orbital data centers is meaningfully higher than the terrestrial alternative — by roughly a 5x factor. Independent industry estimates put orbital data-center capital costs at $50–100 million per megawatt of AI compute, against $10–20 million per MW for terrestrial hyperscale infrastructure. SpaceX's AI1 satellite, as disclosed at the CES showcase earlier this year and detailed by Tom's Hardware, carries a 120 kW compute payload (peak 150 kW) on a vehicle wider than a Boeing 747. The chart below puts the cost gap in plain visual terms.
Fig. 1 — Capital cost per MW of AI compute, orbital vs terrestrial. Ranges per industry estimates.
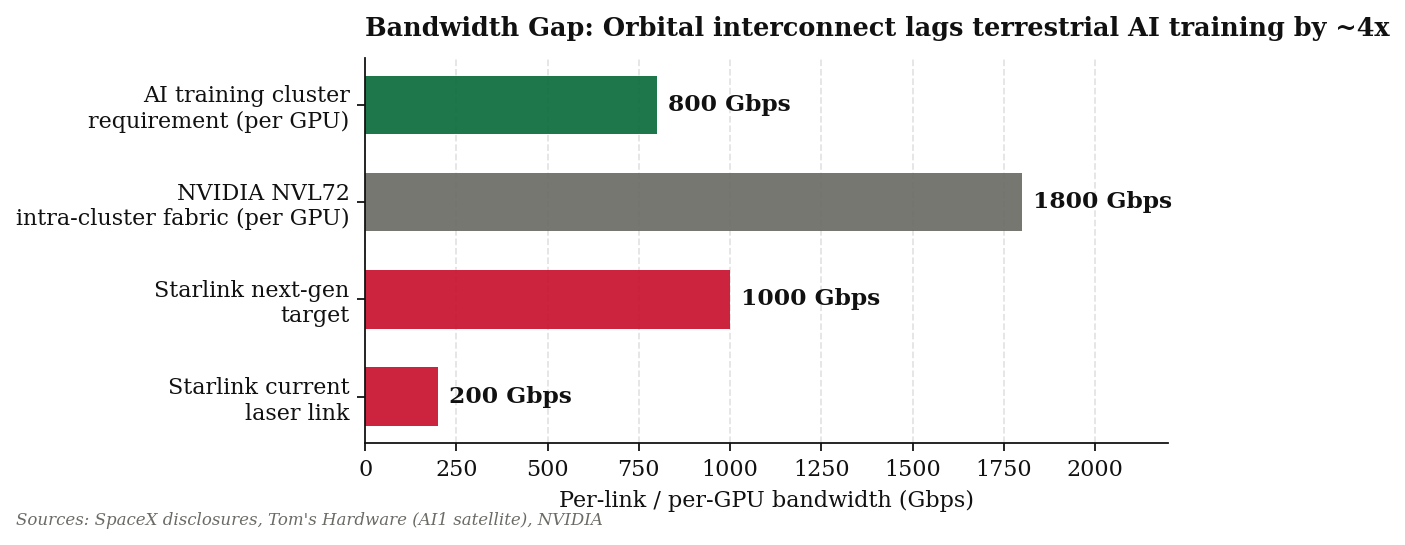
Second, bandwidth physics is unkind to orbital training workloads. Current Starlink laser inter-satellite links operate around 200 Gbps; next-generation hardware targets 1 Tbps. By contrast, NVIDIA's NVL72 reference architecture uses fabric exceeding 1.8 Tbps per GPU for intra-cluster communication, and any credible AI training cluster requires at least 400–800 Gbps per GPU with sub-microsecond latencies. Inference is less demanding but still constrained by sustained throughput. The bandwidth gap matters because it caps the workload mix that can be plausibly run on-orbit — and pushes the economics decisively toward low-utilization scenarios, which are precisely where the 5x capex premium becomes hardest to defend.
Fig. 2 — Bandwidth per link / per GPU. Orbital interconnect lags terrestrial training requirements by ~4x.
Third, the hardware lifecycle problem. Starlink satellites are designed for five-to-seven-year operational lives, after which they de-orbit and burn up. That model works fine for communications hardware but creates a structural problem for compute: when the satellite reaches end-of-life, the GPUs on board (which by then are several generations behind) cannot be retrieved or upgraded. The result is a continuous stream of stranded compute being de-orbited and replaced at fresh capex cost — a dynamic that compounds the 5x capex disadvantage over the long term.
Fourth, the AI1 deployment depends on Starship reaching its aspirational unit economics. The AI1 satellite is, by SpaceX's own disclosure, too large for the Falcon 9 fleet that has been the company's commercial workhorse. Starship is technically impressive but has not yet demonstrated the cost-per-kilogram-to-orbit that the AI1 deployment economics require. If Starship's cost curve resembles Falcon 9's eight-year arc rather than its aggressive forward case, the AI-data-center thesis slips by years.
Fifth — and most pointed — the capital allocation question. The reporting around the SpaceX/xAI structural relationship has consistently highlighted that capital generated by Starlink's commercial business is being directed toward xAI's compute build-out. The skeptic's framing here is direct: this IPO turns the broader public investor into the supplier of capital for a vertically-integrated AI venture whose ultimate winner — xAI — is the same controlling shareholder's other privately-held company. That is not a unique structure in technology M&A, but at $1.77 trillion it is unusually consequential.
None of these five points are arguments that SpaceX is a bad company — it manifestly is not. The company is a generational engineering achievement, and the launch business is the cleanest moat in commercial aerospace. The skeptic's question is narrower: at $1.77 trillion of IPO valuation and $2.33 trillion of intraday market cap, is the orbital-AI optionality embedded in the price defensible on a DCF basis? Damodaran's $1.3 trillion estimate said no. The Observation Post analysis says no. Sam Altman said the same. The buy-side, four-times-oversubscribed institutional book and the +32% two-day move say yes. We have no high-conviction call here. We do think the bear case is materially stronger than the price discovery to date has reflected, and we expect the dispersion of views to widen — not narrow — over the first six months of trading.
The investable implication. We are not short SPCX. We are not long SPCX either. We are, however, increasingly inclined to favor the picks-and-shovels of the AI buildout (the AI-power complex, the physical-AI specialty suppliers we walked through last week, Microsoft and Alphabet within the hyperscalers) over the headline OEMs whose valuations now embed orbital-AI optionality that is far from de-risked. We will revisit this thesis in detail after SPCX's first earnings print.
8. ANALYST CALLS DRIVING ACTION
Notable upgrades / target hikes: Bank of America raised Microsoft (MSFT) PT to $590 on the broader peace-dividend math. Goldman raised Constellation Energy (CEG) PT to $445. Wedbush reiterated Outperform on Tesla (TSLA) at $510 on the SPCX-comparable read-through. JPMorgan raised airlines (DAL, UAL, LUV) again on the durable jet-fuel windfall.
Notable downgrades / target cuts: Bernstein cut energy majors (XOM, CVX) further on the Iran deal. Wells Fargo trimmed defense primes (LMT, RTX, NOC). Notably, no major desk has yet initiated SPCX coverage — the standard 25-day quiet period for syndicate research is still running, with first ratings expected the week of July 7.
9. STOCKS TO WATCH
SpaceX (SPCX) — Up 31.8% from IPO in two sessions; closed Monday at $177.99. Watch the $180 level and any institutional book defense as it trades through the day.
Tesla (TSLA) — Bid on SPCX-comparable math. The cleanest indirect Musk-empire play.
Microsoft (MSFT) / Alphabet (GOOGL) — Cleaner capex-to-revenue conversion than Oracle/Meta. BofA MSFT to $590.
Airlines (DAL, UAL, LUV) — Cleanest near-term Iran-peace beneficiary; JPMorgan PT raises across the board.
Adobe (ADBE) — Stabilizing at $445 post-Firefly miss. Watch for follow-through or another leg lower.
Energy majors (XOM, CVX) — Under sustained pressure. The reverse of the past month's hedge; reducing exposure on rallies.
TLT (20+ Yr Treasury ETF) — Beneficiary of the peace dividend; watch how it trades through tomorrow's dot plot.
10. GLOBAL MACRO SNAPSHOT
Europe: Stoxx 600 up 0.40% intraday, in all-time-high territory. FTSE 100 up 0.6%, DAX up 0.4%. June ZEW survey lands today; recovery from May expected. European energy underperformed on the crude pullback; industrials and travel led the tape.
Asia: A mixed session, not the risk-on extension you would have predicted from Monday's U.S. rally. The Nikkei closed essentially flat at +0.10%. The Hang Seng FELL 1.4% on renewed China property-sector concerns and disappointing May credit data out of Beijing. ASX was unchanged. The contrast with Monday's U.S. tape highlights how much of the U.S. rally was specifically about the Iran deal rather than a global risk-on impulse.
Emerging markets: A mixed bag. India and Korea bid on lower oil. China weaker on the credit data. Brazil and Mexico flat on the commodity-export math; LATAM equity broadly in line. The dollar strength is the constraining variable for the EM complex despite the lower-oil tailwind.
11. WEEK AHEAD PREVIEW
One event dominates the rest of the week.
(1) Wednesday 2:00 p.m. — FOMC + dot plot. Warsh's first. The decisive macro event of the month.
(2) Wednesday 8:30 a.m. — May retail sales. The consumer-side data point that sets the tone for the dot plot.
(3) Friday — Iran deal signing ceremony in Switzerland. The formal close to a six-week macro overhang.
Also watch: SPCX trading through the week, Adobe's stabilization or weakness, and how the AI-software complex digests the post-Adobe/Oracle reset.
12. THE CLOSING THOUGHT
The honest read of today's tape is harder than last week's framing suggested. The Iran deal is done; oil has collapsed; equities ripped Monday. But yields are up, the dollar has firmed, and the bond market is telling us tomorrow's dot plot is going to be hawkish — possibly enough to kill the rate-cut trade entirely. That tension is the story. The equity rally Monday was largely a peace dividend; the rates tape is a Warsh-Fed positioning play; and the SPCX bear case in Section 7 is a discipline exercise on whether $2.33T of market cap is defensible at any interest-rate path. All three deserve careful attention. We owe readers a more rigorous data-discipline going forward — today's editor's note is a small down-payment on that. Our positioning tilt: favor the AI-power and physical-AI picks-and-shovels over the headline orbital-AI OEMs; respect the bond market on rates and avoid duration ahead of the dot plot; size carefully around tomorrow's 2:00 p.m. event. We will be back Wednesday morning with a full FOMC preview and the live read on the dot plot's median dot.
THE BROOKSIDE BRIEF · COMPILED 9:30 AM ET · SOURCES: WSJ, CNBC, BLOOMBERG, REUTERS, BLS, BEA, SEC, SUBSTACK (LINKED P-201542262), THE OBSERVATION POST, TOM'S HARDWARE, ASWATH DAMODARAN, CITRINI RESEARCH, U.S. TREASURY
Delivered 9:30 AM ET
Get the Brief in your inbox
One email each market morning: the setup, the numbers, and what actually matters that day —
plus new Coverage notes when they publish. No spam, no sharing your address, unsubscribe whenever.
Thanks — you're on the list. The next edition lands at 9:30 AM ET.
Your address is stored with the site host and used only to send the Brief.
It is never sold or shared. The Brief is educational research, not investment advice.
About the Analyst
James Flanagan
MBA candidate, SUNY New Paltz · CFA Level I candidate · Equity research
The Brookside Brief is researched, written, and published by one analyst, every market morning at 9:30 AM ET.
The goal is a public, timestamped track record: the daily read on markets and macro, plus formal single-name
research in the Coverage tab.
Prior modeling work includes CAPM/WACC and DCF builds on Rocket Lab vs. Applied Materials and NuScale Power —
the NuScale model is published in full under Coverage, with the framework explained side-by-side in
The Classroom's Models tab.
Editorial & methodology
Market figures are compiled from WSJ, CNBC, Bloomberg, Reuters, BLS, BEA, and the U.S. Treasury, and are as of
each edition's stated date — nothing on this site is live data. Valuation work is built from primary sources:
company filings (10-Ks, S-1s, Form 144s) and cited government or national-lab studies, with every key assumption
disclosed in the note itself.
Corrections
When the Brief gets something wrong, the correction runs at the top of the next edition as an
Editor's Note — flagged, not buried. See the June 16, 2026 edition for the policy in practice.
Macro Terminal
The Macro Read
A terminal-style snapshot of the five forces moving markets — synced to today’s brief, Wednesday, July 15, 2026.
The one-line read
The Iran deal is done and oil cratered to $77 — yet yields rose and the dollar firmed. The bond market is pricing a hawkish first Warsh dot plot, not the easing the oil move would normally imply.
S&P 500
7,554.29
▲ 1.49% (+111.25)
Iran-deal rally; close Monday, June 15.
Nasdaq
26,683.94
▲ 2.38% (+619.85)
Tech led the risk-on tape on the peace dividend.
Dow Jones
51,671.03
▲ 1.20% (+612.20)
Broad participation across cyclicals.
VIX
16.20
▼ 8.37% (-1.48)
Vol crushed as the Iran risk premium drains out.
WTI Crude
$77.31
▼ 3.01% (-$2.40)
U.S. to allow Iran oil sales immediately.
Bitcoin
$86,400
▲ 2.13% (+$1,800)
Risk-on bid as geopolitical tail fades.
The tell is rates, not the rally. Equities ripped on Trump's ‘deal with Iran is now complete’ (S&P +1.49%, Nasdaq +2.38%) and oil cratered to $77 with the U.S. set to allow Iranian sales immediately. Yet the 10-year rose to 4.43% and the dollar firmed to 99.57. Stocks up, oil down, yields up, dollar up is not the dovish-easing trade — it is the market pricing a hawkish Warsh dot plot at tomorrow’s FOMC.
Rates read
Yields are UP across the curve despite the Iran deal and the oil collapse — the clearest signal yet that the bond market is bracing for a hawkish first Warsh dot plot.
2-Year UST
4.32%
▲ +4 bps
Front-end firming on hike-bias repricing.
10-Year UST
4.43%
▲ +5 bps
Benchmark rising even as oil falls.
30-Year UST
4.90%
▲ +4 bps
Long bond flirting with 5% again.
2s10s Spread
+11 bps
▲ positive
Curve modestly upward-sloping.
10-Yr TIPS (real)
2.14%
▲ +3 bps
Real yield rising — genuinely restrictive.
Dollar Index
99.57
▼ 0.06% (-0.06)
DXY firm despite the risk-on equity tape.
What to watch
Lower oil should drag breakevens and pull both nominal and real yields lower. Instead every tenor rose and the real yield climbed to 2.14%. CME FedWatch now implies ~96% odds of a hold tomorrow but roughly a 60% probability the funds rate is at least 25 bps HIGHER by year-end — versus ~5% odds of a cut. Hot May PPI (+1.1%) and Warsh’s hawkish track record are the drivers. The dot plot and the 2:30 p.m. press conference are the entire show.
Inflation read
Oil’s collapse to $77 is a real disinflationary impulse — but hot May PPI (+1.1%) is why the bond market won’t let yields fall.
WTI Crude
$77.31
▼ 3.01% (-$2.40)
Down ~$9 from the early-June peak.
Brent Crude
$79.85
▼ 3.99% (-$3.32)
Below $80 for the first time since April.
Gold (Spot)
$1,778
▼ 1.22% (-$22)
Gives back as real rates rise — textbook.
Silver (Spot)
$20.95
▼ 0.85% (-$0.18)
Following gold lower on firmer real yields.
The mechanism
WTI down roughly $9 from the early-June peak and Brent below $80 should pull inflation breakevens lower — and they did soften at the front end. But May PPI ran hot at +1.1%, and the Strait of Hormuz only reopens to tanker traffic within thirty days, so the relief is real but gradual. Gold giving back to $1,778 as real rates rose is the textbook reaction, not a contradiction of the disinflation story.
Growth read
Monday’s Iran-peace rally was broad — but Tuesday’s futures are softening into the FOMC and Asia notably failed to follow through.
Russell 2000
2,361.10
▲ 0.79% (+18.55)
Small caps joined the rally but lagged tech.
S&P 500
7,554.29
▲ 1.49% (+111.25)
Breadth healthy on the peace dividend.
Dow Industrials
51,671.03
▲ 1.20% (+612.20)
Cyclicals broadly bid.
Nasdaq
26,683.94
▲ 2.38% (+619.85)
Tech the clear leader Monday.
USD/JPY
156.20
▲ 0.19% (+0.30)
Yen soft; carry trade intact.
EUR/USD
1.0735
▲ 0.09% (+0.0010)
Euro steady near range.
The pivot point
Monday was a clean risk-on tape led by tech, but the follow-through is shaky. U.S. futures are down ~0.2% pre-FOMC, the Hang Seng fell 1.4% on renewed China property concerns and weak May credit data, and the Nikkei closed essentially flat. Watch May retail sales tomorrow and whether the Russell can hold 2,350 — the broadening only continues if the growth data cooperates and Warsh doesn’t spook the long end.
Risk read
VIX collapsed to 16.2 as the Iran risk premium drained out — but the real tail is tomorrow’s dot plot, not geopolitics.
VIX
16.20
▼ 8.37% (-1.48)
Protection cheap into a binary FOMC.
Gold (Spot)
$1,778
▼ 1.22% (-$22)
Haven bid eases as real rates rise.
Bitcoin
$86,400
▲ 2.13% (+$1,800)
Risk-on flows return as the tail fades.
UST 10Y
4.43%
▲ +5 bps
Rising into the dot plot — hawkish pricing.
USD/JPY
156.20
▲ 0.19% (+0.30)
Yen weakness keeps carry trades alive.
The asymmetry
With the Iran risk premium draining out, equity vol crushed to 16.2 and Bitcoin pushed to $86,400. But the market is pricing calm into the single biggest event of the month: Warsh’s first dot plot at 2:00 p.m. tomorrow. If the median 2026 dot prints at 3.6% (no cuts) with three hike dots, the rate-cut trade dies and the long end backs up further. That is the asymmetry — cheap vol directly ahead of a binary hawkish catalyst.
Stock Picks
Stocks to Watch
Two different jobs, kept apart: long-term positions I actually want to own, and the short-horizon names moving today.
Your PicksBuild your own calls in the same format · saved to this browser
No personal picks yet — click Add a Pick to create one in the same card format.
From Today's Brief
Core Positions
Hold · Years, not days
Businesses I want to own through a cycle, bought with a margin of safety and sized to be
held while the thesis plays out. These do not change with the tape — they change when the reason for owning
them changes.
Momentum & Today's Trades
From today's brief
Names the tape is moving today, pulled straight from Section 9 of the latest edition.
Short-horizon and event-driven — this list turns over constantly, and is not a set of recommendations.
For informational purposes only and not investment advice. The Brookside Brief is not a registered investment adviser
or broker-dealer. Figures are drawn from the morning brief dated May 20, 2026 and reflect a point-in-time snapshot.
Do your own research and consult a licensed professional before trading.
Coverage
Coverage Universe
Formal single-name research, initiated with a full published model and updated as the thesis evolves. Ratings are scenario anchors — Bear / Base / Bull — not trade calls.
Coverage notes are educational research published by a student analyst to build a public track record. They are
not investment advice or a recommendation to buy or sell any security. Models simplify; assumptions are disclosed
so you can disagree with them.
The Classroom
Finance, Explained
Everything the Brief assumes you know — from "what's a basis point?" to building an LBO. No jargon left undefined.
How to use this
The terms that appear in the Brief nearly every week, in plain English. Search anything, or filter by level —
Basics if you're new to markets, Advanced if you're prepping for interviews or an MBA classroom.
Each card ends with why the term actually matters when you're reading the morning brief.
The mental models
Eight ideas that explain most of what happens in markets on any given morning. Master these and the Macro Terminal
stops being jargon and starts being obvious. Click any one to expand it.
Nominal vs. Real RatesWhy a 4.5% yield can be worth only 2% — and why gold and tech care
Every yield you see quoted is a nominal rate — the sticker price of money. What investors actually earn
is the real rate: the return left over after inflation eats its share. If the 10-year Treasury pays 4.52%
and the market expects inflation of about 2.3%, your purchasing power only grows about 2.2% a year.
4.52%
Nominal 10-yr yield
−
2.30%
Expected inflation (breakeven)
=
≈ 2.2%
Real yield
The real rate is the true cost of money — observable directly as the TIPS yield
The market measures expected inflation through breakevens — the gap between regular Treasury
yields and TIPS (inflation-protected) yields. Rising real rates mean genuinely tighter financial conditions, and
they punish two things hardest: long-duration growth stocks (whose value sits in distant future cash flows) and
gold (which pays no yield at all, so its competition just got better-paying).
See it in the BriefThe rates table carries a line called "10-Yr TIPS (real)."
When the note says "elevated," it means conditions are restrictive — that single line explains many tech-selloff mornings.
How a Fed Cut (or Hike) Moves MarketsThe transmission chain from one overnight rate to your entire portfolio
The Fed directly sets exactly one thing: the overnight fed funds rate that banks charge each other.
Everything else — mortgages, stock valuations, the dollar — moves because markets reprice their expectations
of where that rate is going.
Fed funds rate
FOMC sets the overnight rate eight times a year
→
Treasury yields
2-yr and 10-yr move on the expected path of policy
→
Borrowing costs
Mortgages and corporate debt price off Treasuries
→
Valuations & FX
Higher discount rates compress P/Es; the dollar strengthens
→
The economy
Spending, hiring, and inflation respond — with a lag
One overnight rate, five dominoes
Because markets trade the expected path, the announcement often matters less than the language around it.
Fed funds futures convert trader bets into live probabilities ("32% odds of a December hike"), and the quarterly
dot plot shows where officials themselves expect rates to go. This is why a "hawkish hold" — no
change, tough talk — can hit stocks as hard as an actual hike.
See it in the Brief"December-hike odds sit at 32%" is fed funds futures math —
the market's live vote on the Fed, updating tick by tick, days before any meeting.
Reading the Yield CurveOne chart that summarizes growth, inflation, and recession odds
Plot Treasury yields from 3 months out to 30 years and you get the yield curve — the bond
market's complete opinion about the future, in one line. Normally it slopes upward: lenders demand extra yield to
lock money up longer. The interesting part is when it doesn't.
The slope is the signal: short rates reflect the Fed today, long rates reflect the economy tomorrow
An inverted curve — short yields above long yields — means the market believes today's rates are
too high to last and cuts are coming, historically a recession warning. The most-watched summary is the
2s10s spread (10-year minus 2-year). A steepening curve usually signals improving growth
expectations; the Brief reads it exactly that way ("curve normalization continues — recession signal fading").
The long end can also rise for an uglier reason — deficits and bond supply — which is the term premium story.
See it in the BriefThe Macro Terminal's Rates tab quotes 2s10s directly
("+86 bps, steepening") and the auction calendar ("watch the 1:00 PM 20-year auction") tracks the supply side.
CPI vs. PPI vs. PCEThree inflation gauges, one pipeline — and which one the Fed actually targets
Inflation isn't one number; it's measured at three points along the pipeline from factory to Fed.
PPI — upstream
Prices producers receive. Input-cost shocks show up here first; often leads CPI
→
CPI — the household
The basket consumers actually pay for. The headline print markets trade at 8:30 AM
→
PCE — the Fed's gauge
Broader, weights update as people substitute. The 2% target is a core PCE target
Upstream prices flow downstream — energy reaches CPI with roughly a 4–6 week lag
Each gauge comes in headline (everything) and core (excluding food and energy)
versions. Core isn't a claim that groceries don't matter — it strips out the volatile components that often reverse,
to expose the underlying trend the Fed can actually influence. That's why a hot headline with a cool core can be a
good print.
See it in the Brief"Consensus looks for core CPI at +0.3% m/m" — the month-over-month
core number is the line traders trade. And "oil flows through to CPI with a 4–6 week lag" is the pipeline above in action.
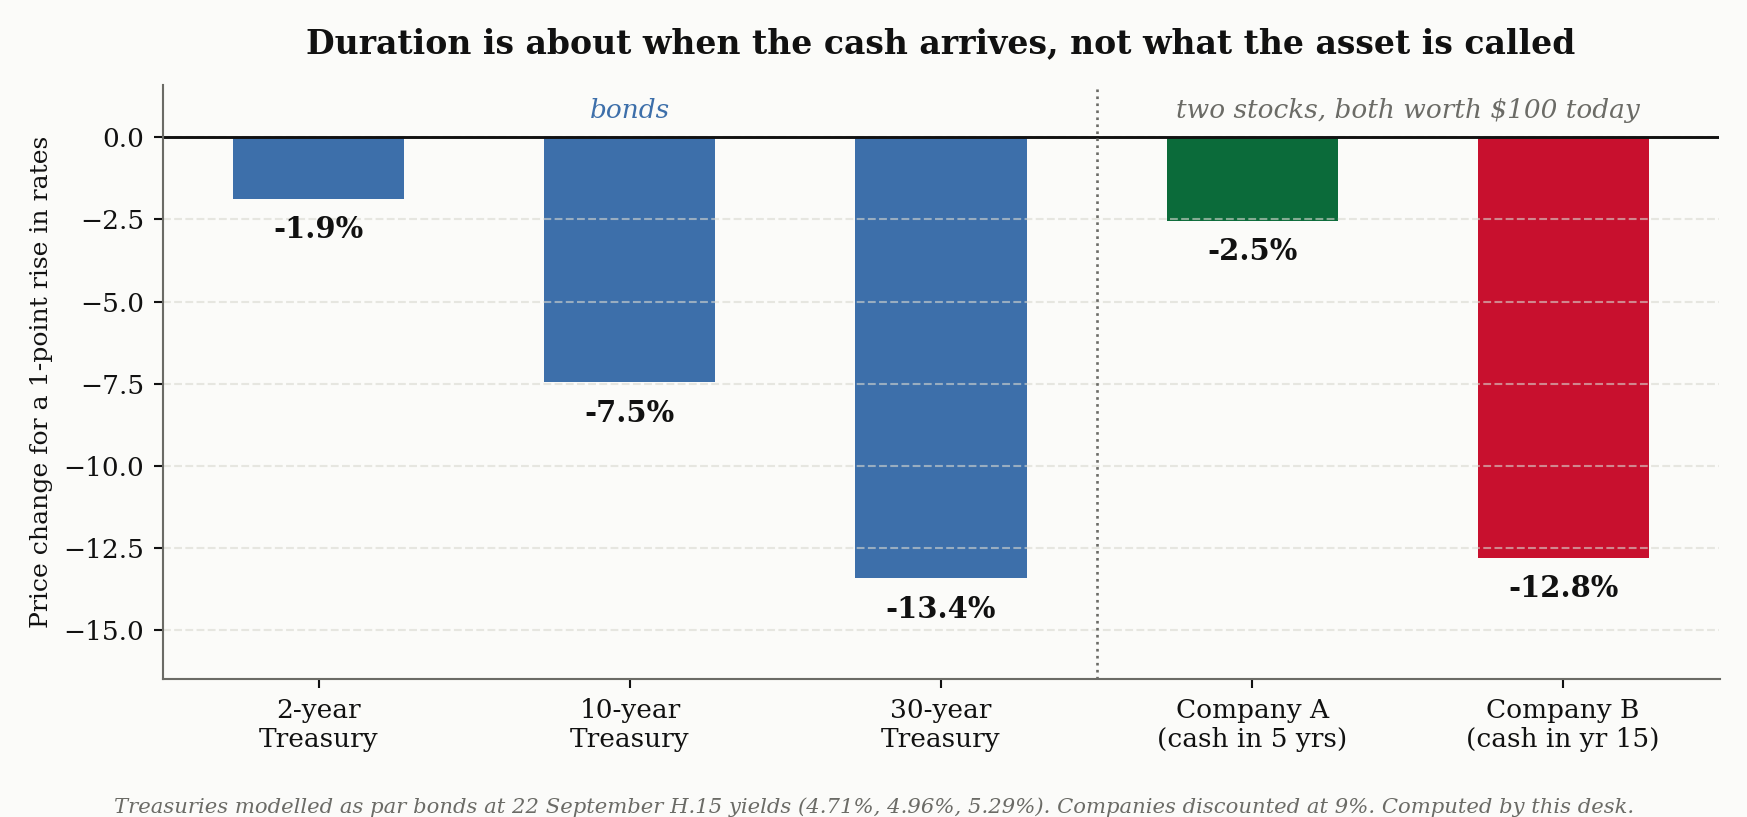
DurationWhy long bonds and tech stocks fall together when yields rise
Duration measures how sensitive an asset's price is to interest-rate moves — and it's driven by
how far away the asset's cash flows are. A bond paying you back in 2 years barely flinches when rates move; a
30-year bond swings hard. Rule of thumb: price change ≈ −duration × yield change. TLT (the 20+ year Treasury ETF)
carries a duration near 17, so a 0.5% rise in long yields knocks roughly 8.5% off its price.
Illustrative. The further away the cash flows, the harder a rate move lands
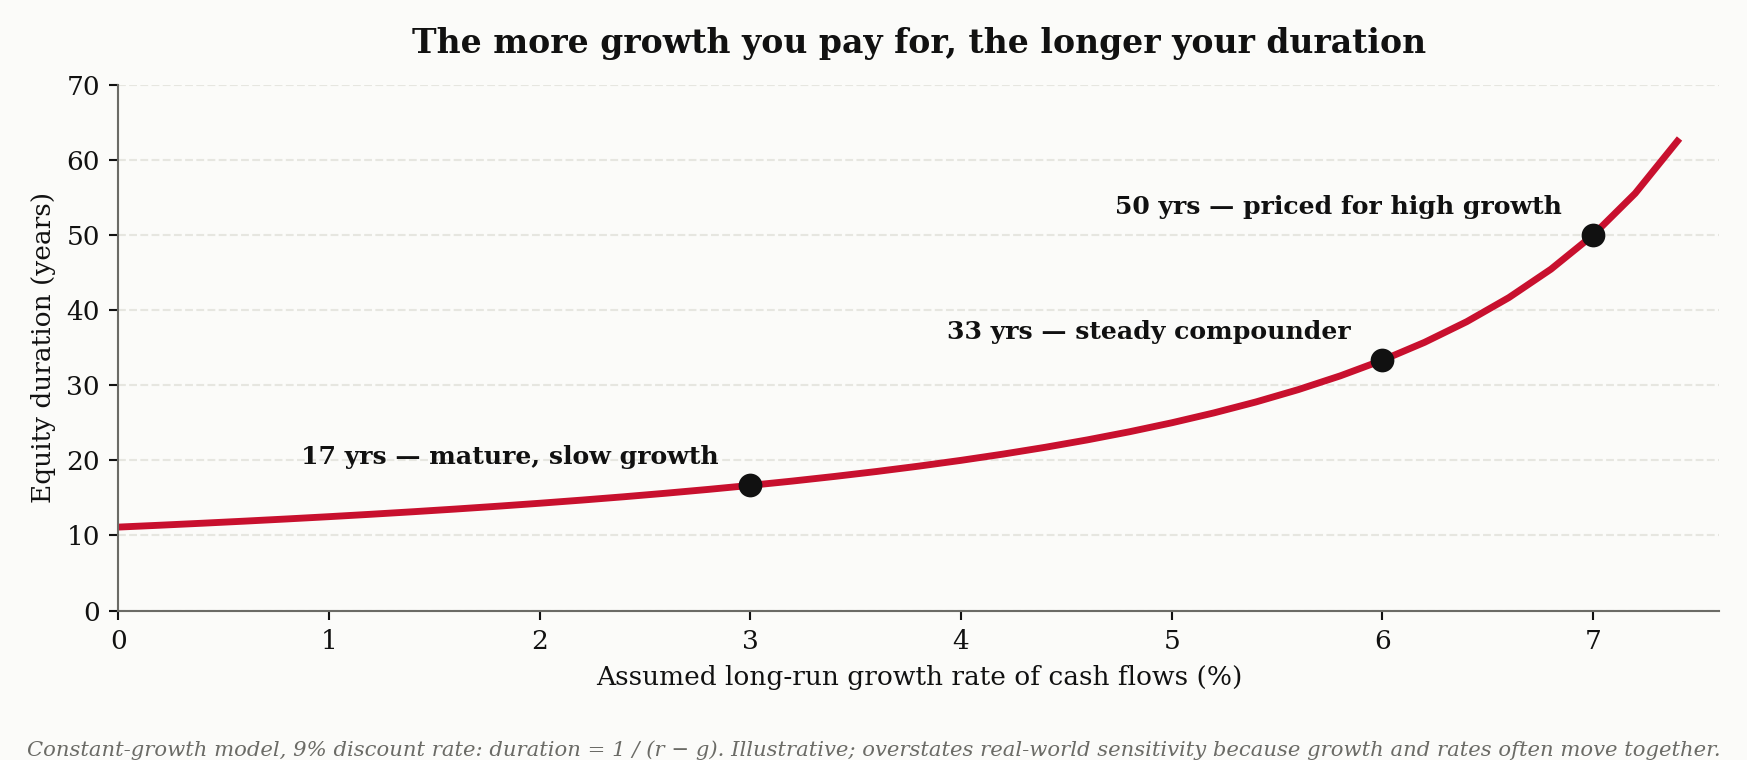
Here's the leap: stocks have duration too. A growth company expected to earn most of its money five to
ten years from now is economically a long-duration asset — most of its value sits in distant cash flows that get
discounted harder when rates rise. A utility paying steady dividends today is short-duration. This is the entire
mechanism behind "yields up, Nasdaq down" mornings, and why the same 10 bps move barely touches the Dow.
See it in the Brief"That distinction could be worth 20–30 basis points on the
10-year and 5–8% on the multi-year-duration growth complex" — that sentence is duration math applied to tech stocks.
The "duration-insensitive AI-power thesis" is its mirror image: contracted cash flows that don't care about rates.
Risk-On, Risk-Off & RotationHow to tell a real rally from money just changing seats
Markets have two broad moods. Risk-on: money flows toward equities, small caps, crypto, and
credit — assets that pay off when things go well. Risk-off: money runs to Treasuries, gold, the
yen, and the dollar — assets that hold value when things don't. Watching which group is bid tells you the market's
mood faster than any headline.
Risk-on
Small caps, cyclicals, credit, crypto bid · gold and Treasuries sold
↔
Risk-off
Treasuries, gold, dollar, staples bid · high-beta sold
A genuine rally lifts both sides of the ledger; a rotation just moves money between them
Rotation is the third state: money moving within equities without leaving — growth to
value, tech to cyclicals, megacaps to small caps. The tell is divergence: when the Dow surges 1.7% while the Nasdaq
falls, no new money entered the market; existing money found a new home. Index-level numbers can hide this
completely, which is why breadth (how many stocks participate) matters more than the headline level.
See it in the Brief"This is a rotation, not a rally" — the Macro Terminal's
one-line read on a +875 Dow / flat Nasdaq day. The Russell 2000's relative performance is the Brief's favorite
rotation tell.
What a P/E Actually PricesMultiples are compressed expectations — and rates are their gravity
A P/E of 25x doesn't mean a stock is "expensive" any more than 12x means "cheap." A multiple is the market's
expectations compressed into one number: how fast earnings will grow, how durable they are, and how risky. A
grocery chain at 25x is wildly expensive; a software company growing 40% a year at 25x might be a bargain. Multiples
only mean something compared to the company's own history, its peers, and the level of interest rates.
$100
Share price
÷
$4.00
Earnings per share
=
25x
P/E — 25 years of today's profit
A multiple is a compressed forecast: growth, risk and the level of rates, in one number
Two forces drive every stock return: earnings growth and multiple change. When a stock falls
faster than its earnings estimates, the market is paying less per dollar of the same earnings — a
de-rating. The reverse — a re-rating — is how stocks can double while earnings
rise 30%. And because the 10-year yield is the alternative to owning any stock, rising rates compress all multiples
at once: that's the "gravity."
See it in the Brief"The CrowdStrike, Salesforce, and Broadcom de-ratings" —
those stocks didn't lose earnings; they lost multiple. Watching whether Adobe's print can "re-rate AI software" is
a bet on the multiple, not the quarter.
Why Guidance Beats the QuarterThe market is a forecasting machine — the last 90 days are already in the price
By the time a company reports earnings, the quarter being reported is three months old and largely priced in —
analysts have modeled it, buy-side desks have surveyed it, options have priced the reaction (the
implied move). What is not in the price is the future: management's
guidance for next quarter and the year. That's why a company can beat estimates and fall 10% —
a beat with cut guidance is bad news wearing a good-news costume.
Last quarter
Already known and priced
→
The print
Confirms or corrects it
→
Guidance
Changes every future year
→
The re-rate
Where the move comes from
Ninety days of history against an updated view of every year ahead
The pattern to internalize: stocks move on surprise versus expectations, never on absolute results.
"Priced for perfection" means expectations are so high that even great results disappoint. Washed-out sentiment and
heavy short interest mean the opposite — a merely fine print can spark a squeeze. Position and expectation are as
important as fundamentals on any earnings night.
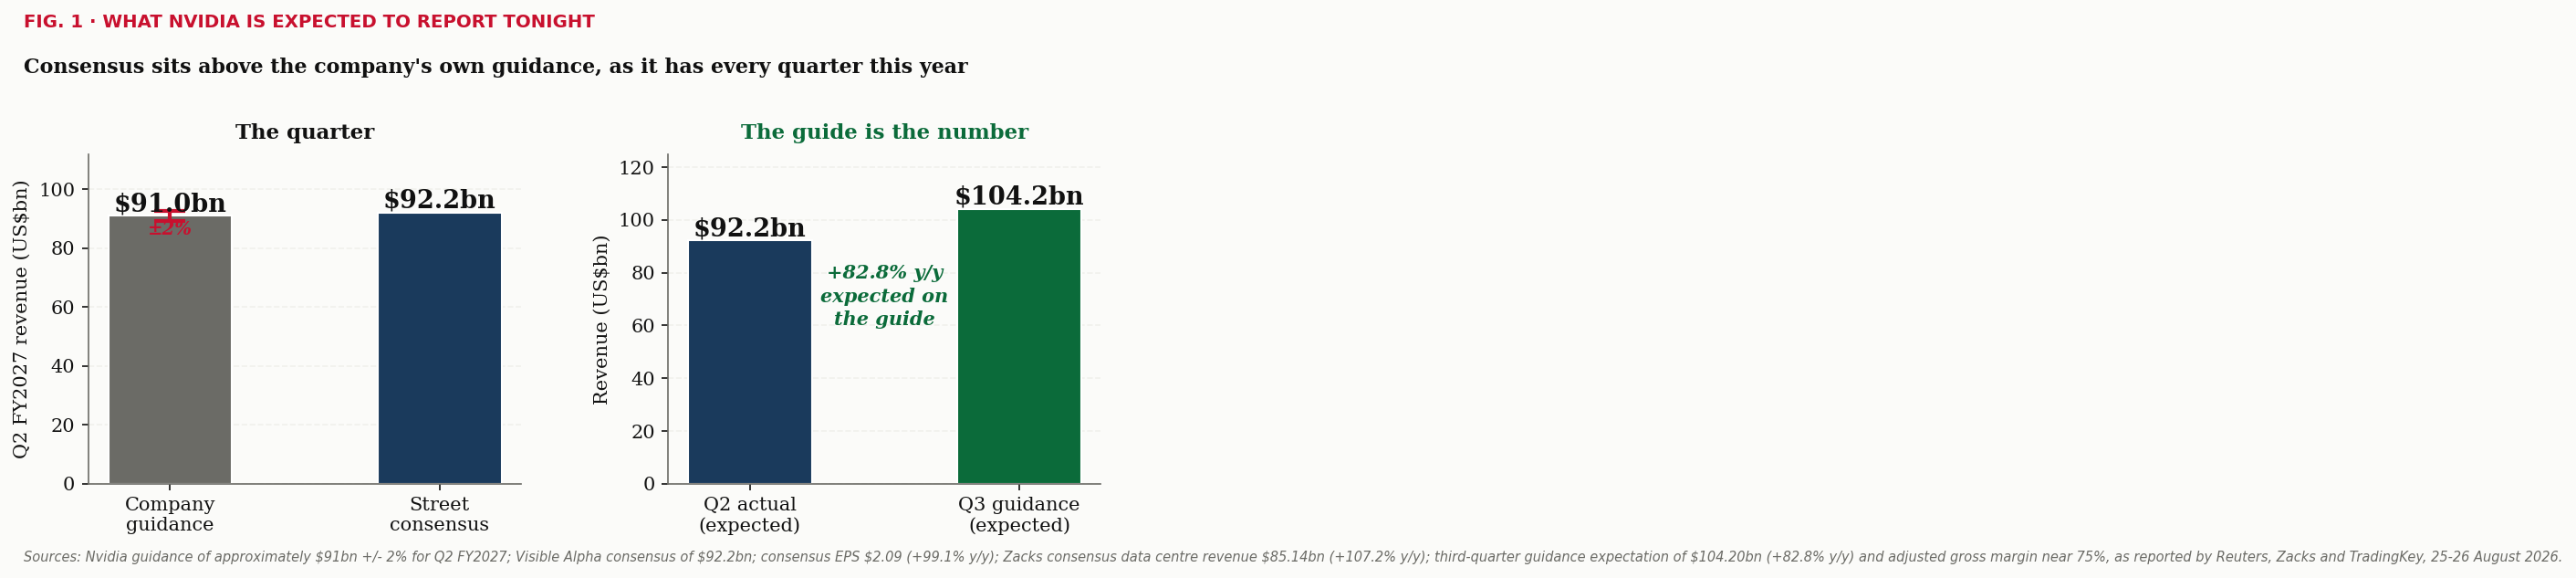
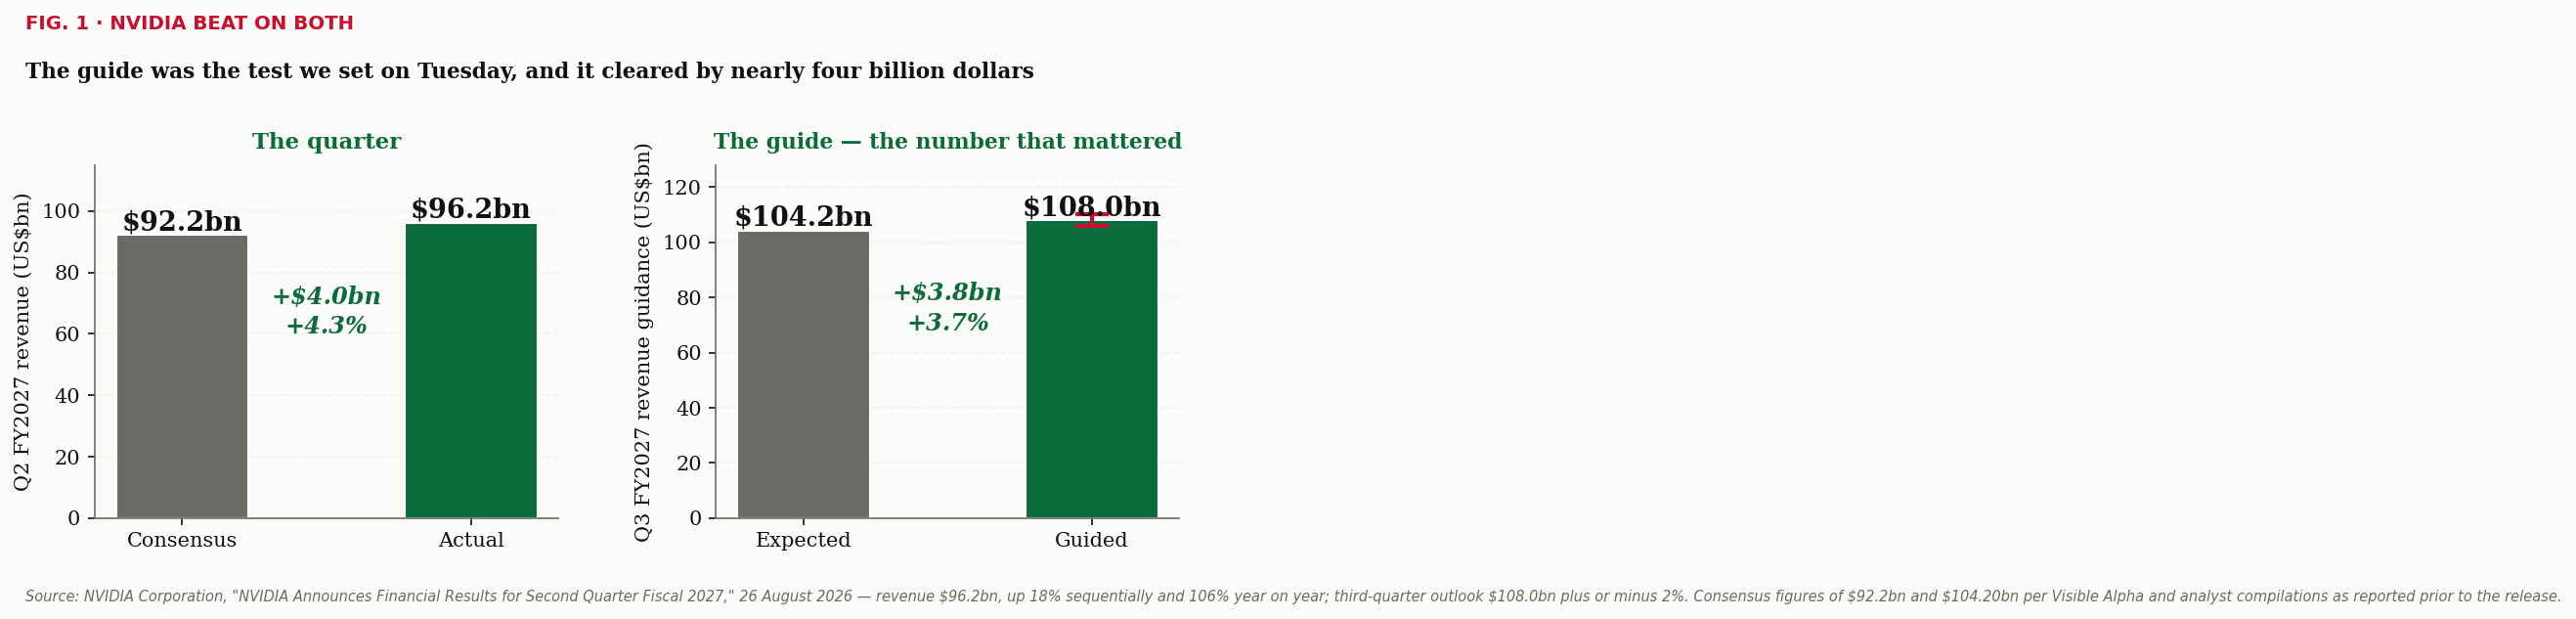
See it in the Brief"The bull line is Q2 revenue guidance above $90B" — note
that the line is drawn on guidance, not the reported quarter. And "a low bar (down 22% YTD)" is the
expectations setup doing the work.
Earnings vs. Cash FlowProfit is an opinion. Cash is a fact.
Net income is an accounting construct. It is calculated after non-cash charges like depreciation, after
revenue that has been booked but not yet collected, and after dozens of judgement calls about timing. Free
cash flow asks a blunter question: how much money actually ended up in the bank after paying to keep the
business running and growing?
Net income
What the income statement says
+
D&A
Charges that cost no cash
−
Capex + ΔNWC
Cash the business absorbs
=
Free cash flow
What you could actually take out
The bridge from reported profit to spendable cash
The single most useful diagnostic in equity research is the ratio of operating cash flow to net income.
Sustained above 1.0x, reported earnings are conservative and backed by cash. Drifting below 1.0x for several
quarters, profits are being recognised faster than customers pay — which is how accounting problems announce
themselves long before a restatement does.
This is also why a company can be profitable and still fail. Growth consumes working capital and capex
before it produces cash, and a business that runs out of money while posting positive net income is a
perfectly ordinary bankruptcy.
See it in the BriefWhen a note flags that "capex is growing faster than
revenue," this is the concern underneath it — reported earnings hold up while free cash flow quietly shrinks.
It is the central tension in the whole AI-infrastructure trade.
The Capital StructureWho gets paid first, and why equity is the last in line
A company's assets are claimed in a strict order. Secured lenders are paid first, then unsecured and
subordinated debt, then preferred shares, and whatever remains belongs to common equity. In good times this
ordering is invisible. In bad times it is the only thing that matters.
Each layer is only worth something once every layer above it has been made whole
Two consequences follow. First, leverage magnifies equity returns in both directions: a company worth
$900M with $500M of debt has $400M of equity, and a 20% fall in enterprise value wipes out 45% of the equity.
Second, when a business is distressed, the interesting question stops being "what is the stock worth" and
becomes "where does value break" — which layer of the structure is the last one still fully covered.
See it in the BriefEvery time a note says a company is "funding capex
with debt" or flags a maturity wall, it is pointing at this diagram. The LBO template in The Models is this
waterfall turned into a spreadsheet.
Capex Cycles & ReflexivityHow a boom finances itself — and why the unwind is never gentle
Capital spending booms are self-reinforcing. A rising share price lowers a company's cost of capital,
which makes it rational to spend more; the spending shows up as revenue at its suppliers, whose shares rise,
which lowers their cost of capital. George Soros called this reflexivity: perception and fundamentals
feeding each other rather than one simply reflecting the other.
Share price rises
Cost of capital falls
→
Capex is raised
Spending looks cheap to fund
→
Supplier revenue
Orders and backlog build
→
Supplier re-rates
The theme gains believers
→
Loop repeats
Until something breaks it
The same chain runs backwards just as efficiently
What breaks it is rarely demand disappearing. It is usually the second derivative —
spending still growing, but growing more slowly. Because the loop was priced for acceleration, deceleration is
enough to reverse it. This is why a supplier can beat estimates, grow 30%, and still fall 15% in a session.
The practical lesson is about concentration. In a reflexive cycle the suppliers' revenue quality depends
entirely on a handful of buyers, so customer concentration and backlog quality matter more than the headline
growth rate. A backlog is only as good as the customer's ability to pay for it.
See it in the BriefThe recurring AI-capex coverage is this concept in
real time — hyperscaler budgets setting the demand curve for semis and power, and the Brief repeatedly asking
who actually owes the money behind a "record backlog."
Credit SpreadsThe market's early-warning system — and why equity investors watch it
A credit spread is the extra yield a company must pay over a Treasury of the same maturity. It is the
price of default risk, and it is set by a market that is structurally more pessimistic than the equity market:
bondholders have no upside beyond being repaid, so they spend their time thinking about what could go wrong.
7.8%
High-yield corporate bond
−
4.4%
Treasury, same maturity
=
340 bps
Credit spread
Roughly 300 bps is calm; past 600 bps the market is pricing real defaults
Spreads matter to equity holders for two reasons. They are a leading indicator — credit markets have
historically widened before equity markets fall, because the same balance-sheet stress hits lenders first.
And they are a direct input to valuation: wider spreads raise the cost of debt, which raises WACC, which
lowers the present value of every future cash flow.
The tell to watch for is divergence. Equities rallying while high-yield spreads widen means the two markets
disagree about the same companies, and the credit market is usually the one that turns out to be right.
See it in the BriefWhen a note says "watch credit" alongside an equity
rally, this divergence is what it means — and it is why refinancing risk gets flagged on levered names long
before the equity reacts.
Market BreadthWhen the index is up and almost nothing else is
The S&P 500 is weighted by market capitalisation, so the largest companies dominate it. When a handful
of megacaps carry the index, the headline number stops describing the market and starts describing those few
companies. Breadth is the set of measures that reveal the difference.
Illustrative. The gap between these two lines is breadth
The simplest check is the equal-weight index against the cap-weighted one: if the equal-weight version is
flat while the headline rises, a few names are doing all the work. Other measures do the same job —
advance-decline lines, the share of members above their 200-day average, and how many stocks made new highs
on a day the index did.
Narrow rallies are fragile because the index inherits the risk of a few companies, and diversification
becomes an illusion. Broad rallies, where small caps and cyclicals participate, tend to reflect an actual
improvement in the economy rather than a crowded trade.
See it in the BriefPhrases like "breadth healthy" or "the Russell
lagged" in the Growth tab of the Macro Terminal are breadth commentary — the question of whether a rally is
the market or just its five largest members.
What "Priced In" Actually MeansWhy good news sells off, and bad news sometimes rallies
A share price is not a verdict on how good a company is. It is the market's aggregate forecast, already
adjusted for everything currently known. That means prices do not move on news — they move on the
difference between news and what was expected.
Expectation
What the price already assumes
→
Outcome
What is actually reported
→
Surprise
The gap between the two
→
Price move
Proportional to the surprise, not the news
The number matters far less than the number relative to what was assumed
This explains the behaviour that most confuses new readers. A company reports record profits and the stock
falls, because consensus expected slightly more. A company posts a loss and rallies, because the loss was
smaller than feared. A rate cut everyone forecast produces no move at all, because the cut was in the price
weeks earlier.
It also sets the bar for research. Finding a good company is not an edge — everyone can see it, and the
price reflects it. An edge requires a view that differs from consensus and a reason the market will
eventually agree with you. That is the whole purpose of the variant-perception discipline.
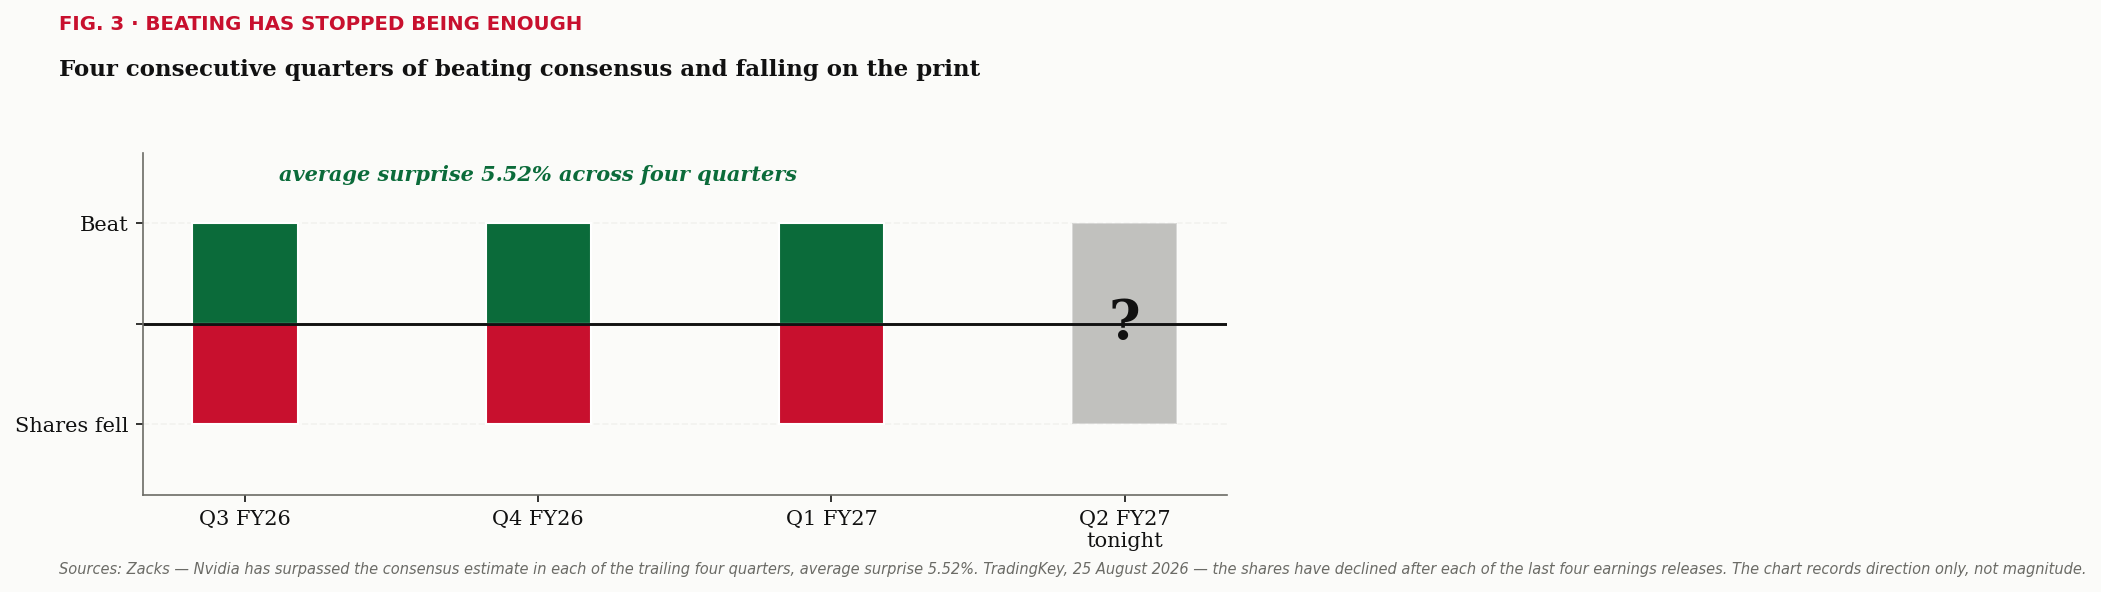
See it in the BriefEvery "beat but fell" line in the earnings coverage
is this concept. It is also why the Brief quotes the options-implied move before a print: that is the market
telling you how much surprise it has already budgeted for.
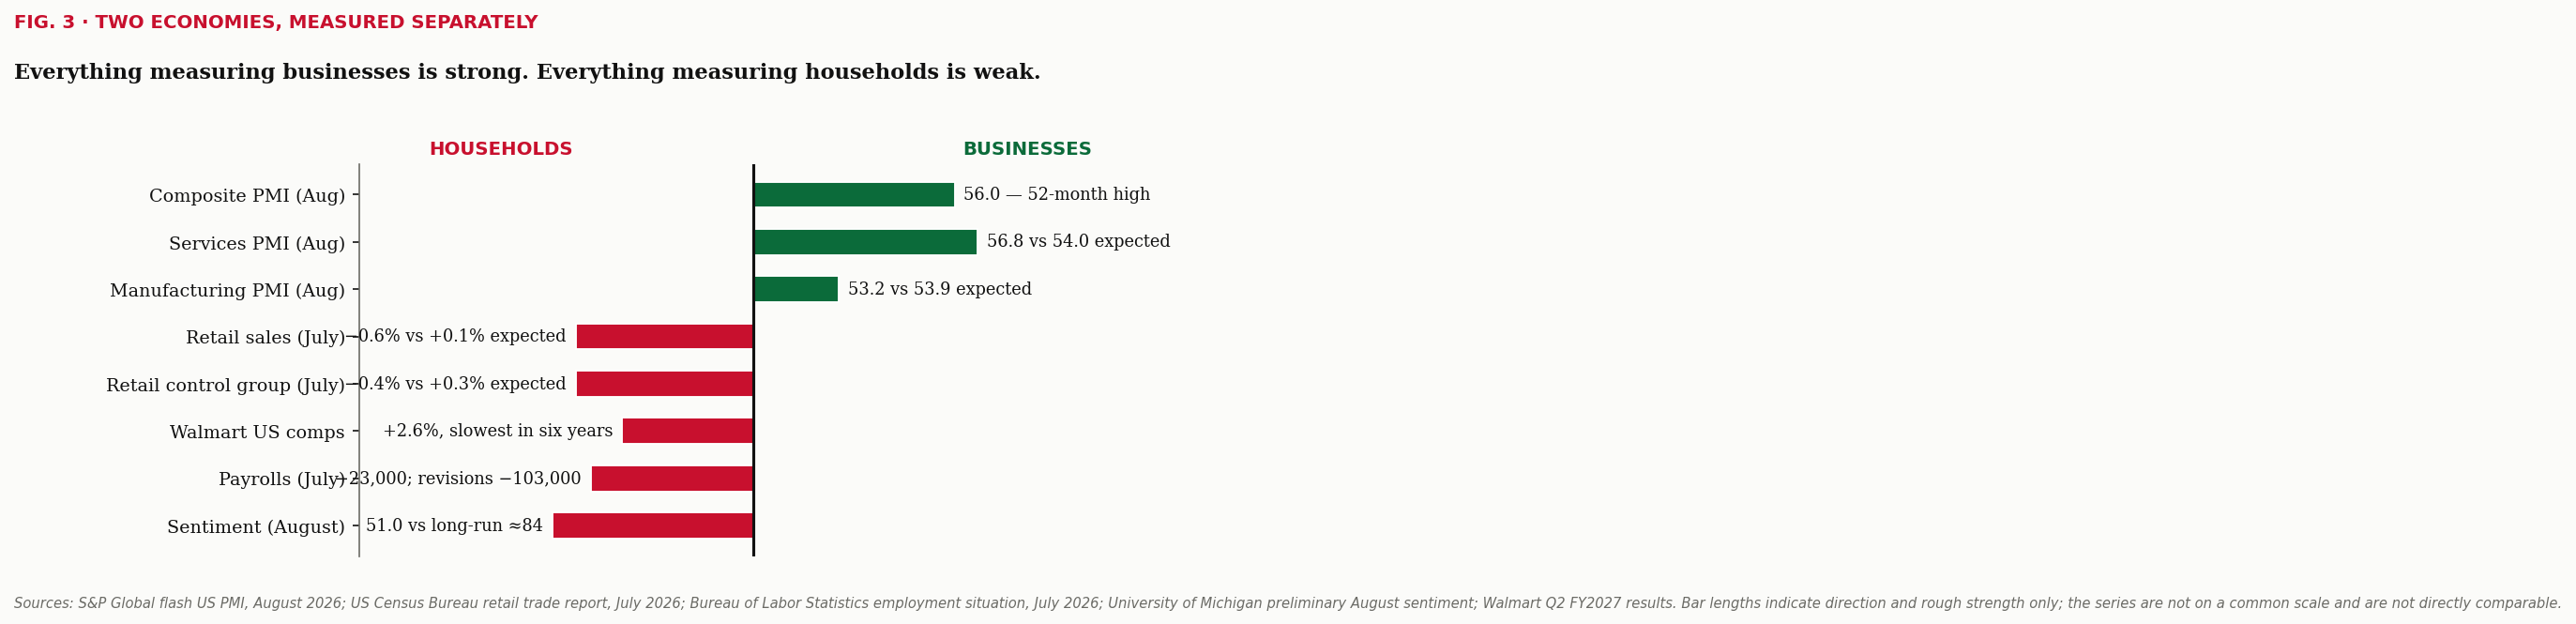
The DivergenceHow the economy can be booming and cracking at the same time
"The economy" is not one thing. Split the data by who is being surveyed and it frequently separates into
two economies moving in opposite directions: the business-facing side — purchasing managers, capital spending,
industrial orders — and the household-facing side — payrolls, retail sales, delinquencies, consumer confidence.
Illustrative. When these two separate, the headline number describes whichever side you happened to measure
The two can diverge for a long time because they are driven by different things. A capital-spending boom
is funded by corporate balance sheets and capital markets; household demand runs on wages, employment and
credit availability. An investment cycle can therefore accelerate while consumers are tightening — the
spending lands as revenue at suppliers, not as income at households, at least at first.
Practically, this means an economic argument is often just two people quoting different halves of the same
data set. The useful question is not "is the economy strong" but "which side of it is strong, who is funding
it, and what happens if that funding stops." A boom carried entirely by one side is more fragile than a
headline growth rate suggests.
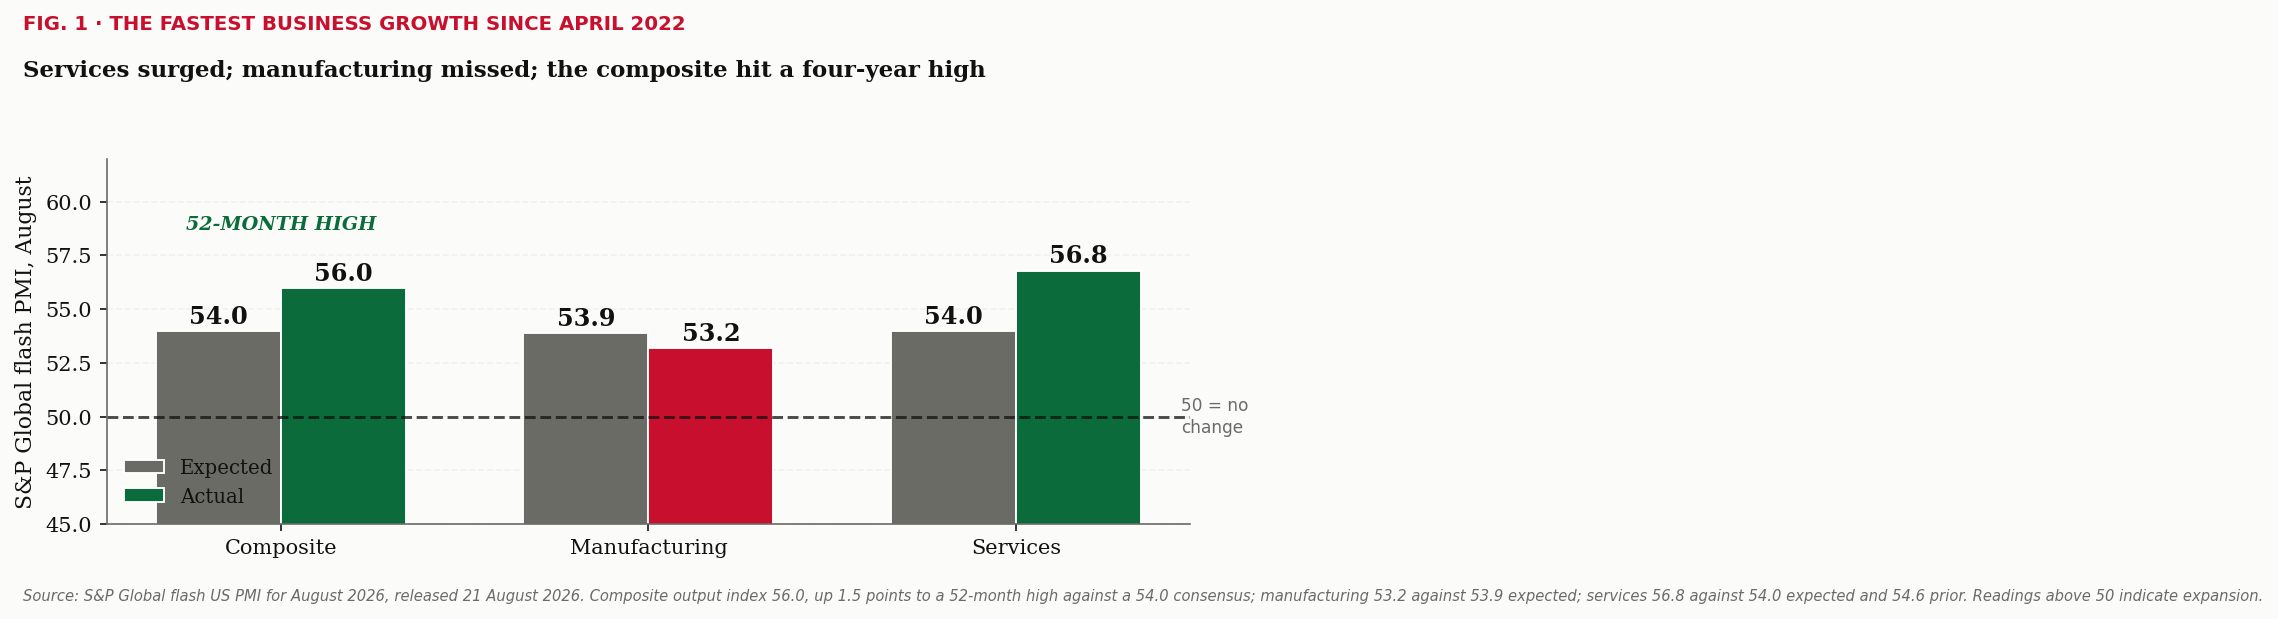
See it in the BriefA flash composite PMI at a 52-month high sitting
alongside soft payrolls and weak retail is exactly this split — and it is why the Sector Spotlight tracks the
business and household sides as separate stories rather than averaging them into one.
GAAP vs. Non-GAAP EarningsTwo profit numbers for one quarter, and which to believe
Every earnings release contains at least two profit figures. GAAP earnings follow the accounting standard
all filers must use. Non-GAAP — "adjusted" — is management's own presentation, with costs they consider
unrepresentative removed. Both are disclosed; the headline usually quotes the adjusted one.
GAAP EPS
The standardised number
+
Add-backs
Restructuring · deal costs · often stock comp
=
Non-GAAP EPS
The number in the press release
The interesting information is in the middle box, not the ends
Some adjustments are entirely fair — a genuine one-time legal settlement tells you nothing about next
year. Others deserve scepticism. Stock-based compensation is the classic case: it is a real cost of employing
people, paid in shares rather than cash, and adding it back treats dilution as though it were free.
"Restructuring" charges that appear every year for five straight years are not one-off either.
Two habits are worth forming. Read the reconciliation table rather than the headline, since that is where
the add-backs are itemised. And watch the direction of the gap over time: a spread that widens each year
means the adjusted number is drifting further from what the accounting rules produce. Occasionally the gap
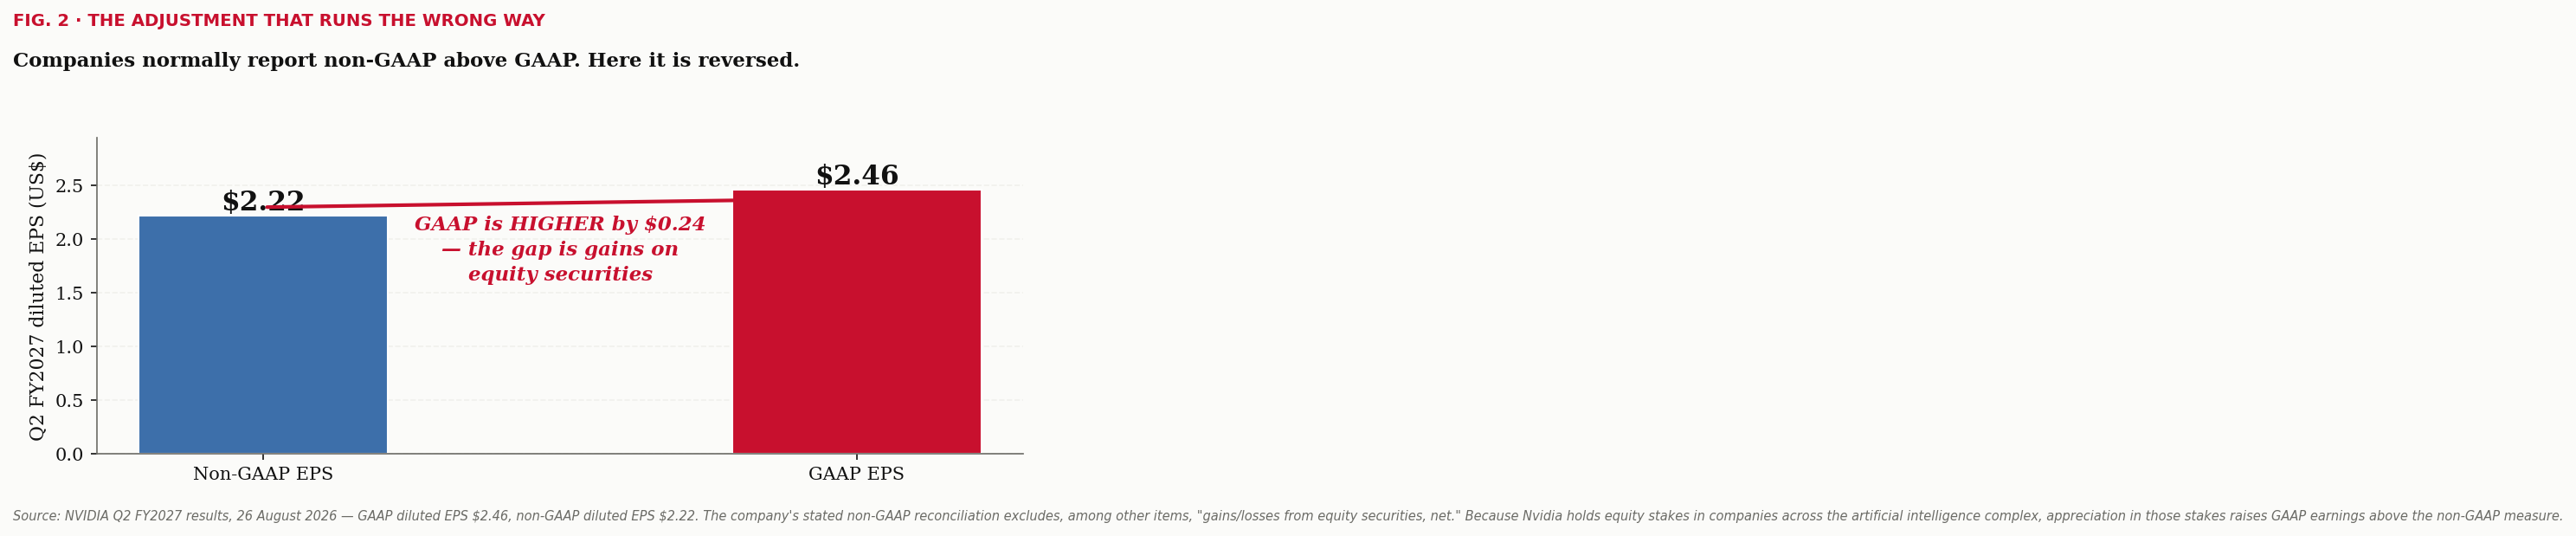
inverts and GAAP lands above non-GAAP, which usually means management excluded a gain — the reverse
of the usual incentive, and always worth understanding.
See it in the BriefWhen an earnings note quotes both figures rather than
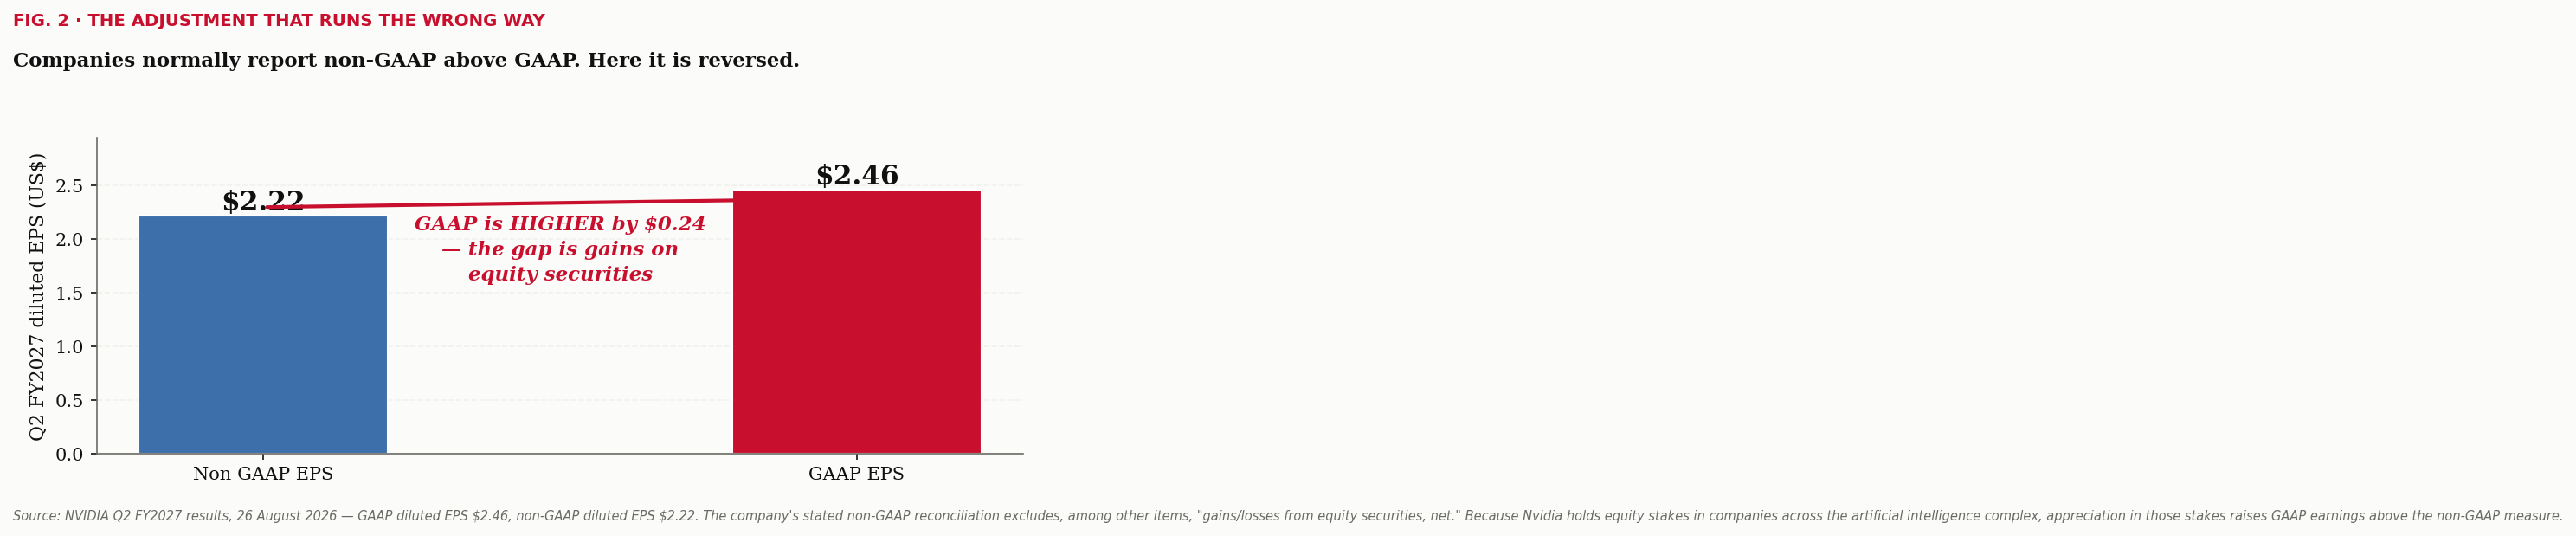
just the headline, this is why. A company reporting GAAP of $2.46 against non-GAAP of $2.22 is doing something
unusual, and the reconciliation explains what.
What "Underlying Inflation" MeansFour ways to strip the noise out of a price index — and what each one hides
Central bankers rarely target the headline inflation rate. They target some notion of underlying
inflation — the part of price change that reflects a persistent trend rather than a one-off shock. The
trouble is that there is no single agreed measure, and each candidate answers a slightly different question.
Headline
Everything, including food and energy
→
Core
Drops food and energy by rule
→
Trimmed mean
Drops the biggest movers, whatever they are
→
Diffusion
Counts how many categories are rising
Each step answers a different question — none of them is simply "the real number"
Core is the crude version: it removes food and energy every month by rule, whether or not those were the
volatile items that month. Trimmed-mean measures are more honest about the intent — they discard the largest
movers in both directions, so a shelter spike gets trimmed just as readily as an oil crash.
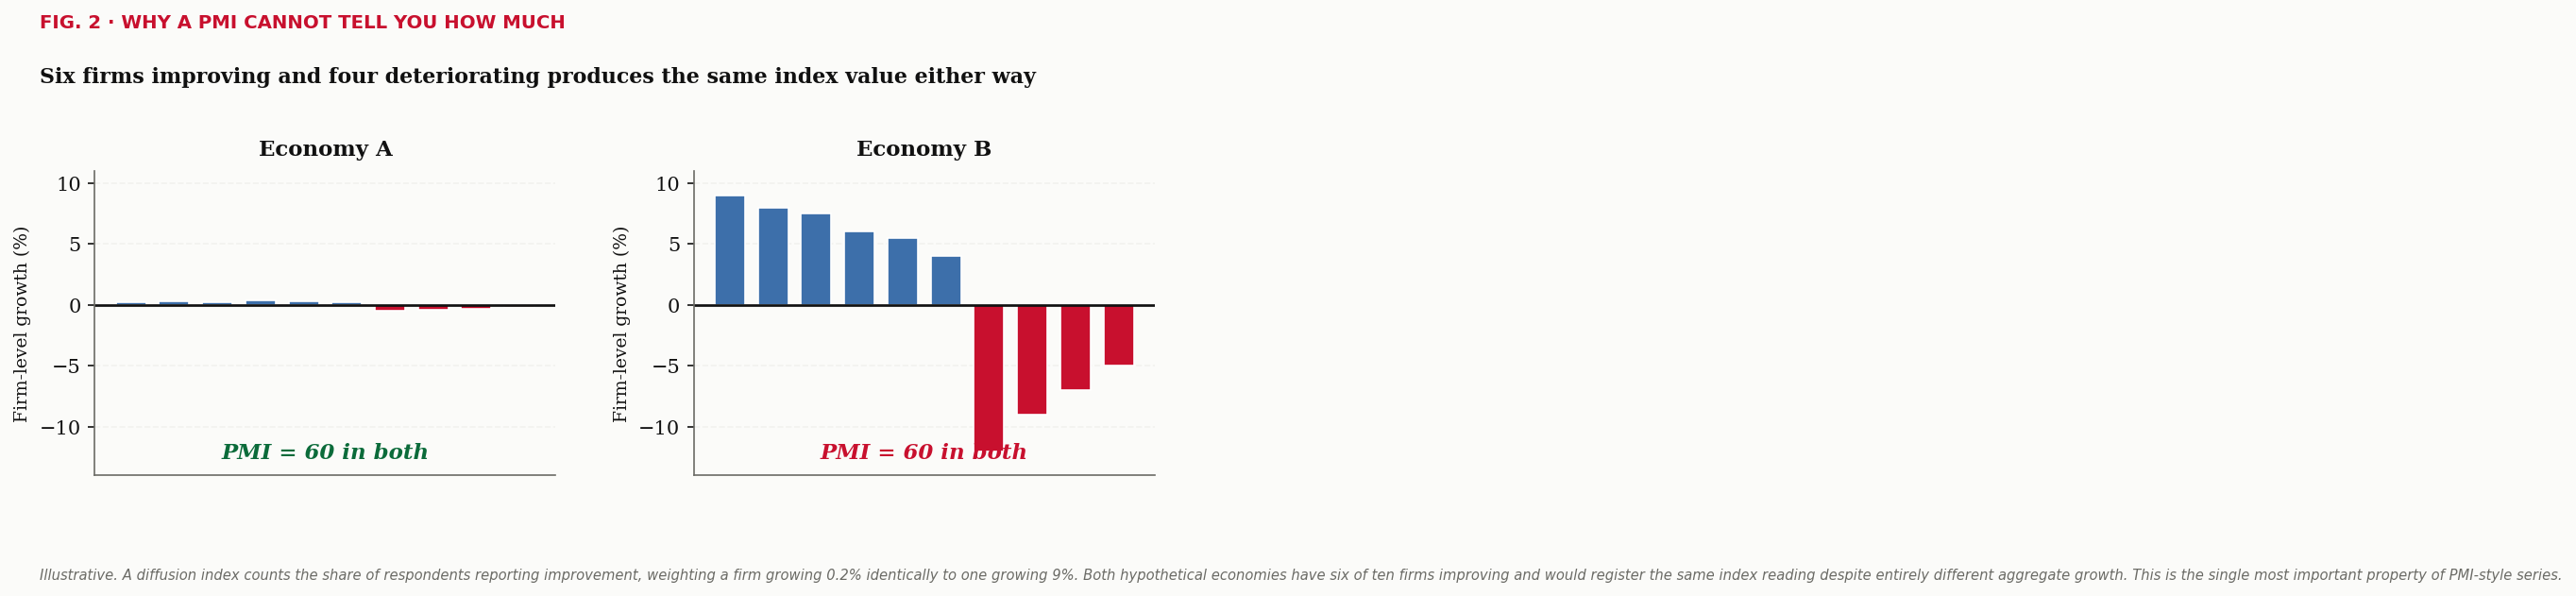
Diffusion is the one most often misread. It counts the share of categories rising, weighting a
component worth 0.1% of the basket exactly the same as one worth 15%. That makes it a genuine measure of
breadth and a poor measure of magnitude: hundreds of small services categories running hot can make diffusion
look alarming while the index households actually experience barely moves — and it can look benign while one
enormous category carries the whole overshoot.
The practical discipline is to ask which measure someone is quoting before accepting the conclusion. When
a policymaker states a standard — that underlying inflation must be moving to target "clearly and at
sufficient speed" — the definition they have in mind determines whether the data already meets it.
See it in the BriefThe primer on what "underlying inflation" actually
means was written for exactly this reason: a chair naming a specific standard makes the choice of measure the
whole argument, and the Brief tracks which one is being used.
The analyst's toolkit
Three frameworks do most of the valuation work on Wall Street: the DCF asks what a business is
intrinsically worth, comps ask what the market is currently paying for similar businesses, and the
LBO asks what a private-equity buyer could pay and still hit their return. Every investment-banking and MBA valuation
course is some arrangement of these three.
Model 01 · Intrinsic Value
Discounted Cash Flow (DCF)
"A company is worth all the cash it will ever generate — counted in today's dollars."
The intuition: $100 arriving next year is worth less than $100 today, because today's $100 could be earning the
going rate of interest. A DCF projects the cash a business will throw off, then shrinks ("discounts") each year's
cash back to present value. Add it all up and you have what the business is worth today — independent of whatever
mood the market is in.
Five years of projected cash plus a terminal value, all pulled back to the present
The five steps
Project free cash flow. Model revenue growth, margins, and capex for 5–10 years. This is where the real thinking lives — the spreadsheet is just arithmetic.
Pick a discount rate. Usually WACC — the blended return the company's investors require. Riskier business, higher rate, lower value.
Estimate terminal value. The value of everything beyond the forecast, via a modest perpetual growth rate or an exit multiple. It is often 60–80% of the total — handle with care.
Discount and sum. Pull every cash flow back to today and add them up: that's enterprise value.
Bridge to the share price. Subtract net debt, divide by shares — then sensitivity-test everything, because the output is a range, never a number.
The classic pitfallGarbage in, gospel out. A DCF's precision is seductive, but
nudging WACC from 8% to 9% or terminal growth by half a point can swing the value 20%+. That's how Damodaran and the
SpaceX S-1 can both run a DCF on the same company and land $475 billion apart — the disagreement is in the
assumptions, and the assumptions are the analysis.
Take the template
A blank, scenario-driven DCF built to the structure above — ten forecast years, a CAPM discount-rate build,
and a Bear / Base / Bull switch that flips the whole model from one cell.
Sheets: Read Me · Assumptions · DCF Model (with sensitivity grid)
"What is the market paying right now for businesses like this one?"
Comps skip the crystal ball entirely: instead of projecting the future, you price a company off its peers using
multiples — P/E, EV/EBITDA, EV/Revenue. It's how a realtor prices a house: find three similar ones
nearby, see what they sold for per square foot, apply that rate. The close cousin, precedent
transactions, uses prices paid in actual acquisitions instead — those run higher because buyers pay a
control premium.
Worked example — pricing off the peer set
Company
EV/EBITDA
P/E
Peer A
14.2x
22.1x
Peer B
16.8x
25.4x
Peer C
15.1x
23.8x
Peer median
15.1x
23.8x
Your company — EPS $4.00
—
23.8x × $4.00 ≈ $95/share
Median peer multiple × your company's metric = implied value
The five steps
Pick the peer set. Same sector, similar size, growth, and margins. This is the hardest and most manipulated step — the answer moves with the roster.
Spread the multiples. Compute EV/EBITDA, P/E, and EV/Sales for every peer from current prices and estimates.
Take the median and range. The median resists outliers; the range becomes your valuation band.
Apply to your company. Median multiple × your company's EBITDA (or EPS) = implied value.
Argue the premium or discount. Faster growth, better margins, stronger moat → above the median. This argument is the actual analysis.
The classic pitfallComps tell you the price of the neighborhood, not whether the
neighborhood is fairly priced. In a bubble, everything comps beautifully against everything else — relative value can
make five overvalued companies all look "cheap" versus each other.
Take the template
Eight peer slots, automatic EV bridges and multiples, full percentile statistics, and a second sheet that
turns the peer median into an implied value per share for your target.
"Buy with mostly borrowed money, let the company's own cash repay the debt, sell, keep the upside."
The house-flip analogy is exact: put 20% down on a rental property, let the tenant's rent pay the mortgage for five
years, sell at a modest gain — and your equity has multiplied even though the house barely appreciated. A
private-equity firm does the same with companies: fund the purchase with 50–70% debt, use the company's cash flows to
pay it down, and exit. Debt paydown converts directly into equity value.
Same company, five years later: the debt slice shrank, so the equity slice grew
The five steps
Sources & uses. Price the deal and decide the mix: typically 50–70% debt, the rest sponsor equity.
Project the cash flows. EBITDA growth, capex, working capital — with excess cash "swept" to repay debt every year.
Build the debt schedule. Each tranche's interest and paydown, year by year. Leverage falls as EBITDA grows.
Assume an exit. Sell in ~5 years at an EBITDA multiple, usually near the entry multiple to keep the math honest.
Compute the returns. IRR and MOIC on the equity check. PE funds typically target ~20%+ IRR / 2x+ multiple of money.
The classic pitfallLeverage cuts both ways. The same debt that triples the
equity on plan can wipe it out entirely if EBITDA misses by 20% — which is why classic LBO targets are boring,
stable-cash-flow businesses, not story stocks.
Take the template
A five-year LBO with sources & uses, a two-tranche capital structure, a cash-sweep debt schedule, and an
IRR grid across exit multiple and exit year.
Sheets: Read Me · Assumptions · LBO Model · Returns
"A framework is only as honest as the numbers you feed it."
Everything in Model 01, pointed at a real ticker: NuScale Power (SMR), the small-modular-reactor designer.
The revenue build starts from physics — 77 MWe per module × 8,760 hours × 95% capacity factor × a
$110/MWh power price ≈ $70.5M of plant revenue per running module per year — of which NuScale, as the
supplier rather than the plant owner, captures ~20%, plus a 15% license-and-services attach. Ramp the
ENTRA1 fleet to 72 modules by 2040, subtract a corporate cost base growing from $180M to $305M, and discount at
an 18.7% CAPM cost of equity (risk-free 4.45% + beta 2.25 × 5% ERP + 3% execution premium; no debt, so
WACC = cost of equity).
Bear
$1.80
Base
$2.58
Bull
$7.17
Market price · Jul 10
$9.00
Sensitivity — value per share ($), WACC × terminal growth
WACC ↓ · g →
2.0%
2.5%
3.0%
3.3%
12%
4.94
5.13
5.35
5.49
14%
3.75
3.86
3.97
4.05
16%
3.04
3.11
3.17
3.22
18.7%
2.51
2.54
2.58
2.60
20%
2.36
2.38
2.41
2.43
22%
2.21
2.22
2.24
2.25
How the model is built
Revenue from physics, not hope. Module capacity × hours × capacity factor × $/MWh
gives plant revenue per module; NuScale's 20% capture and 15% services attach convert that to company revenue.
Ramp the fleet. Zero modules until 2030, then the ENTRA1 schedule to 72 by 2040 — the bear
case stops at 60, the bull reaches 78.
Cost it honestly. ~73% gross margin at $110/MWh ($30/MWh fuel + O&M), against a corporate
opex line that never stops growing, plus $40M of NuScale capex per module built.
Build the discount rate from CAPM. 4.45% risk-free + 2.25 beta × 5% equity risk premium
+ 3% size/execution premium = 18.7%. High beta is the price of being pre-revenue with FOAK risk.
Terminal value, then the bridge. Gordon growth on normalized 2040 FCF, add $1,287M of net
cash, divide by 365.5M diluted shares → $2.58 base.
The pitfall this example teaches
Terminal value does all the work. The explicit 2027–2040 cash flows sum to negative $694M of present value —
every dollar of the valuation lives in the terminal year and the cash pile. When TV is more than 100% of enterprise
value, a "DCF price target" is really a leveraged bet on the discount rate — which is exactly why the sensitivity
table above, not the single $2.58 number, is the honest output.
See it in the wild
The full note — thesis, WACC build, scenario table, and what would change the call — is published in the
Coverage tab → NuScale (SMR).
The curriculum
The Classroom covers what you need to read the Brief; these are the places to go further — the reference
desk first, then the newsletters actually cited as sources in these pages, then the books worth the shelf space.
Everything in Reference & Data is free; newsletters are marked where they are paid.
Reference & Data
Where terms get defined and claims get checked. Free, and roughly ordered beginner to advanced.
Free official data for everything the Brief discusses — CPI, the 2s10s spread, real yields, payrolls — charted back decades. Where macro claims get checked.
The firm that trains incoming IB analysts publishes its knowledge base free: deep, practical walkthroughs of DCFs, comps, LBOs, and accounting edge cases.
NYU's "dean of valuation" posts his full MBA courses, spreadsheets, and datasets free — the same frameworks behind his SpaceX analysis in the Brief. Also on YouTube.
Free video series that constructs a 3-statement model, DCF, and LBO from a blank spreadsheet, one cell at a time. The fastest way to make the Models tab concrete.
A free daily Bloomberg newsletter explaining the mechanics behind the headlines — funny, deep, and the best bridge from textbook finance to the real thing.
The Level I curriculum — ethics, financial statement analysis, equity, fixed income, portfolio theory — is
the closest thing to an official map of what a professional analyst is expected to know, and the framework
behind this site's Coverage models. The topic outline and study-session structure are free on the site.
Intermediate → Advanced
Newsletters & Substacks
The independent research actually cited as sources in the Brief, plus the ones worth reading
alongside it. Most publish free; paid tiers are flagged.
The most-cited outside source in this Brief. Cross-asset thematic research that always ends with the actual
expression of the idea — which basket, which instrument, which leg. The reference point for how a theme becomes
a position rather than an opinion.
The Stern professor already in Reference & Data, in newsletter form: full valuations of whatever is in the
headlines, spreadsheets attached, assumptions exposed. The closest thing to watching a valuation get built in real time.
Semiconductor analysis written by someone who understands the physics, not just the P/E — process nodes,
packaging, HBM supply, conference recaps. The antidote to reading the AI trade purely through stock charts.
A former systematic-macro PM arguing, with charts, about why traditional macro trading stopped working —
deficits, growth, and flows rather than narrative. Deliberately contrarian about the frameworks everyone else quotes.
Ex-BofA equity research on the unglamorous end of the market: water rights, hard assets, micro-caps, and
balance sheets holding things worth more than the market realizes. Source for the Brief's July 2 water-assets work.
Top-down thematic work from a former multi-billion-dollar fund manager — early on photonics, now on edge and
physical AI. Overlaps directly with the physical-AI thesis this Brief keeps returning to.
Not a newsletter but a free long-form essay series — the most-cited articulation of what trillion-dollar AI
compute buildouts imply for power, capital, and geopolitics. Read it as the bull case's intellectual foundation,
then argue with it.
Burry writing without compliance constraints for the first time — accounting skepticism, depreciation
schedules, and bubble history aimed squarely at AI capex. Worth reading precisely because it argues the
opposite of Situational Awareness above. Free posts are limited; the archive is subscription-only.
Advanced
Books
The shelf behind the Brief — one professional manual, several histories, and the books that
teach judgment rather than mechanics.
Best Practices for Equity Research Analysts
James J. Valentine, CFA
The job, described
The closest thing the profession has to a training manual: how to build models that survive contact with
reality, find information edge, run channel checks, and communicate a call. The structural template behind this
site's Coverage notes.
Intermediate → Advanced
Reminiscences of a Stock Operator
Edwin Lefèvre (1923)
The oldest lessons still true
A thinly fictionalized life of Jesse Livermore, and the book working traders quote most. A century of market
plumbing has changed; the psychology in it has not aged a day.
Beginner → Intermediate
A Random Walk Down Wall Street
Burton G. Malkiel
The case against people like us
The strongest popular argument that active analysis cannot beat an index fund. Read it early and take it
seriously — a research process that can't answer Malkiel isn't a process.
Beginner
The Black Swan
Nassim Nicholas Taleb
Why the model breaks
On the outsized role of rare, unpredictable events and the false comfort of normal distributions. The reason
serious work publishes a scenario range instead of a single price target.
Intermediate
Liar's Poker
Michael Lewis
How the sell side really works
Lewis's 1980s Salomon Brothers memoir — the origin story of mortgage trading and the definitive account of
the culture that produces the research everyone quotes.
Beginner
Flash Boys
Michael Lewis
Market structure, made visible
High-frequency trading, dark pools, and what actually happens between clicking buy and owning the stock.
The plumbing beneath every price the Brief quotes.
Beginner → Intermediate
Barbarians at the Gate
Bryan Burrough & John Helyar
The LBO, as narrative
The RJR Nabisco buyout in full — the best possible companion to the LBO modelcard in The Models. Every
abstraction in that framework appears here with names, egos, and consequences attached.
Intermediate
Principles: Life and Work
Ray Dalio
Decision-making as a system
Bridgewater's founder on radical transparency, writing down your rules, and treating mistakes as data. The
argument for keeping a timestamped, public track record — the reason this site exists in its current form.
Intermediate
How Will You Measure Your Life?
Clayton M. Christensen
The part finance forgets
The Harvard strategy professor turning his frameworks on the question of what a career is actually for.
A useful counterweight when the pursuit of the next credential starts to feel like the point.
All levels
Margin of Safety
Seth A. Klarman (1991)
Risk first, return second
The Baupost founder's case that avoiding permanent loss — not maximising upside — is what compounds.
Long out of print and absurdly priced secondhand, but PDFs circulate widely and the ideas are the point:
buy assets for less than they are worth, and size the position so being wrong is survivable.
Intermediate → Advanced
Distressed Debt Analysis
Stephen G. Moyer
Valuation when the equity may be worth zero
The standard text on analysing companies in or near bankruptcy: where value breaks in the capital
structure, how covenants and priority actually behave, and how a restructuring converts debt into equity.
The discipline that makes the LBO model's debt schedule feel less like arithmetic and more like a claim
on a real business.
Advanced
The Classroom is educational material, not investment advice, and simplifies deliberately — real-world practice has
more edge cases than any explainer. External links and recommended readings are provided for convenience and
reflect one analyst's reading list; The Brookside Brief is not affiliated with, compensated by, or endorsing any
linked publication, author, or seller. Paid newsletters are flagged as such.
Click anywhere or press Esc to close
Admin Access
The Brookside Brief · Publisher Login
THE BROOKSIDE BRIEF
A morning briefing on markets, macro, and the day ahead
Tuesday, May 19, 2026 • 9:30 AM ET
1. THE MORNING SETUP
Good morning. The market opens Tuesday with a fascinating split-screen: oil and bonds have blinked, but equities haven't fully figured out what to do with it. President Trump's overnight decision to call off a 'scheduled attack of Iran tomorrow' — following private appeals from Saudi Arabia, Qatar, and the UAE — has knocked WTI back through $103 and pulled Brent toward $107. The Strait of Hormuz remains restricted but a handful of tankers have resumed transit. It is the first material de-escalation signal in six weeks.
And yet — the 30-year Treasury yield closed Friday at 5.12%, above the psychologically important 5% line for the first time since October 2023. Yesterday's session was telling: the Dow eked out a 160-point gain on energy and defensives, but the Nasdaq sagged another 0.51% as chip stocks continued to bleed ahead of tomorrow's Nvidia print. The S&P 500 closed essentially flat at 7,403.05 — a stalemate between the oil-relief bid and the rates-pain trade.
This morning's tape is mixed. Home Depot reported pre-open and beat: $3.43 EPS vs. $3.41 estimated, $41.77B revenue vs. $41.52B, comparable sales up 0.6% (versus flat consensus), and crucially management reaffirmed full-year guidance. The print removes one tail risk for the housing-sensitive complex but doesn't change the bigger picture: rates are still elevated, Nvidia tomorrow night is still the binary, and the FOMC minutes Thursday will tell us how much patience this Fed has left.
2. MARKETS AT A GLANCE
U.S. Equity Futures (pre-open)
Asset
Last
Change
% Chg
S&P 500 (ES)
7,381
-22
-0.30%
Nasdaq 100 (NQ)
25,665
-155
-0.60%
Dow (YM)
49,610
-77
-0.20%
Russell 2000 (RTY)
2,234
-4
-0.18%
Prior Close (Monday, May 18)
Asset
Last
Change
% Chg
S&P 500
7,403.05
-5.45
-0.07%
Nasdaq Composite
26,090.73
-134.41
-0.51%
Dow Jones Industrial Avg.
49,686.12
+159.95
+0.32%
Russell 2000
2,238.05
-3.25
-0.15%
VIX
20.4
+0.6
+3.0%
Rates & FX
Asset
Last
Change
% Chg
UST 2-Year
4.36%
+2 bps
—
UST 10-Year
4.60%
-3 bps
—
UST 30-Year
5.12%
+16 bps
—
DXY (Dollar Index)
99.18
-0.21
-0.21%
EUR/USD
1.0742
+0.0030
+0.28%
USD/JPY
158.20
-1.20
-0.75%
Commodities & Crypto
Asset
Last
Change
% Chg
WTI Crude (Jun)
$103.10
-$3.55
-3.33%
Brent Crude (Jul)
$106.85
-$3.27
-2.97%
Gold (spot)
$1,762
+$12
+0.69%
Silver (spot)
$20.32
+$0.27
+1.35%
Bitcoin
$78,420
+$1,515
+1.97%
Asia & Europe
Asset
Last
Change
% Chg
Nikkei 225
Closed (Holiday)
—
—
Hang Seng
21,080
-70
-0.33%
Australia ASX 200
8,478
-27
-0.32%
Stoxx Europe 600
557.20
+1.80
+0.32%
FTSE 100
8,695
-25
-0.29%
DAX
19,920
+80
+0.40%
3. TOP STORIES
Trump Calls Off Iran Strike After Gulf-State Appeals — Oil Cracks $103
In a Monday-evening post, President Trump confirmed he had 'shelved' a scheduled Tuesday strike on Iran following requests from the leaders of Saudi Arabia, Qatar, and the UAE, calling the diplomatic track 'very serious now.' Iran has not confirmed any breakthrough, but a handful of tankers — including a Vietnamese-bound Iraqi cargo — have resumed transit through the Strait of Hormuz overnight. Oil markets reacted swiftly: WTI for June delivery tumbled 3.3% to $103.10, its biggest single-session decline since the crisis began on February 28. Brent is back near $107. Energy equities are giving back roughly 4% pre-market, with E&P names (FANG, EOG, PXD) leading the unwind.
30-Year Yield Punches Through 5% — First Time Since October 2023
Friday's 30-year settle at 5.12% and Monday's hold at the same level mark a meaningful regime change. The last time the long bond traded above 5% on a sustained basis (October 2023), it preceded a 10% S&P 500 drawdown over six weeks. The proximate driver is now well-known — hot CPI/PPI prints, oil-driven inflation premium, Fed dissents — but the second-order effect is what's interesting: 30-year mortgage rates have climbed to 7.85%, ten-year corporate spreads have widened 18 basis points in two weeks, and the iShares 20+ Year Treasury ETF (TLT) is at a new 52-week low. Watch tomorrow's $16B 20-year auction at 1:00 p.m. ET — a tail of more than 2 basis points would be ugly.
Home Depot Beats, Reaffirms Guide — Housing Read Less Dire Than Feared
Home Depot's Q1 print this morning came in better than the bears had positioned for. EPS of $3.43 cleared the $3.41 estimate; revenue of $41.77 billion topped $41.52 billion consensus. Comparable sales rose 0.6% globally and 0.4% in the U.S. — the first positive comp number in three quarters. Customer transactions fell 1.3% but average ticket rose 2.3% to $92.76. CFO Richard McPhail told the call that pro-customer demand has 'stabilized' and spring categories are tracking 'in line with plan.' Management reaffirmed full-year guidance of 2.5–4.5% sales growth and flat-to-+2% comps. HD is indicated up 2.4% pre-market. Lowe's (LOW) reports Wednesday before open; the read-through is incrementally positive but not definitive — Lowe's pro mix is half of HD's.
Nvidia Tonight Tomorrow: Pre-Print Positioning at Extremes
Nvidia trades at $229.72 in the pre-market this morning after closing $220.35 yesterday — a 4% lift that is being attributed to fresh sell-side flow defending the position into the Wednesday-after-close print. Implied move from options chains: ±7.4%. Open interest has shifted dramatically over the past 72 hours toward the $240 strike on the call side and the $200 strike on the put side, creating what option desks are calling 'the biggest pin risk we've seen this year.' Cantor moved its PT to $260 this morning (from $220). The number that matters: Q2 FY27 revenue guidance. Below $87B is bad. Above $90B is great. In between is the most likely outcome, which makes the post-print read on operating margins and inventory the swing variable.
Japan GDP Surprises — But Yen Strengthens on Risk-Off Rotation
Japan's Q1 GDP printed +2.1% annualized overnight, comfortably above the +1.7% Reuters consensus and well clear of the prior +1.3% read. The upside surprise complicates the BoJ's messaging — Governor Ueda had spent the past six weeks talking down hike expectations on growth concerns. The yen rallied 75 basis points to 158.20 against the dollar, the strongest level in a month. The move was amplified by general dollar weakness as the Iran-strike cancellation pushed safe-haven flows out of greenbacks and back into euros and yen. Watch USD/JPY 157 as the line where Tokyo would more credibly be able to argue intervention is unwarranted.
RBA Surprises with 25bp Hike — Australia's Inflation Fight Far From Over
The Reserve Bank of Australia raised the cash rate to 4.35% from 4.10% overnight, against a market that had priced 60% probability of a hold. Governor Bullock's statement was hawkish in tone, noting 'persistent services inflation' and 'still-tight labor market conditions.' AUD/USD jumped 0.8% to 0.6618 on the print. The Australia decision is being watched as a potential template for what global central banks may have to do if the Hormuz-driven inflation impulse persists: confront the reality that 'transitory' is unraveling again.
4. MACRO & FED WATCH
The week's marquee macro event remains Thursday's FOMC minutes from the April 28–29 meeting, where the Committee held the policy rate at 3.50–3.75% over a four-way dissent. Markets will be hunting two things in the minutes: first, the actual ideological split — Hammack and Logan reportedly pushed hard for a hike; second, any language change around 'longer-run inflation expectations remain anchored,' the linchpin sentence that has held the long end of the curve together. Powell speaks Wednesday at 9:00 a.m. at the Atlanta Fed conference; expect anything other than a strict reiteration of the April statement to move rates.
Fed funds futures are now pricing 38% probability of a hike by December, up from 12% one month ago. They are pricing 100% probability of a hike by March 2027. Two weeks ago, those numbers were 6% and 84%, respectively. The Iran-strike cancellation softens this trajectory at the margin — overnight, December-hike probability backed off from 42% to 38% — but the structural inflation question hasn't gone away just because Trump postponed an attack.
5. ECONOMIC CALENDAR — REST OF WEEK
Day
Time (ET)
Release
Consensus
Tue 5/19
Before open
Home Depot (HD) Q1 — BEAT ✓
Actual: $3.43 / $41.77B
Tue 5/19
After close
Palo Alto Networks (PANW) Q3
EPS $0.98 / Rev $2.40B
Wed 5/20
Before open
Lowe's (LOW), Target (TGT)
—
Wed 5/20
8:30 AM
Building Permits / Housing Starts (Apr)
1.44M / 1.36M
Wed 5/20
9:00 AM
Powell remarks — Atlanta Fed
—
Wed 5/20
1:00 PM
20-Yr Treasury auction ($16B)
—
Wed 5/20
After close
Nvidia (NVDA) Q1 FY27
EPS $1.77 / Rev $78.0B
Thu 5/21
8:30 AM
Initial Jobless Claims
228K
Thu 5/21
8:30 AM
Philly Fed Mfg. (May)
-2.0
Thu 5/21
Before open
Walmart (WMT) Q1
EPS $0.66 / Rev $171B
Thu 5/21
10:00 AM
Existing Home Sales (Apr)
4.10M
Thu 5/21
2:00 PM
FOMC Minutes (Apr 28–29)
—
Fri 5/22
9:45 AM
S&P Global Flash PMIs (May)
Mfg 49.2 / Svc 51.3
6. EARNINGS WATCH
Home Depot's morning beat sets a constructive tone for the consumer cohort reporting this week. The big read-through: rate-sensitive durables demand is bending but not breaking. Average ticket up 2.3% suggests some pricing power; transactions down 1.3% says the elasticity is real. For Lowe's tomorrow morning, the bar just got slightly higher — Street consensus of -1.5% comps now looks beatable. For Target Wednesday before open, the bar remains very low given the −22% YTD share-price performance; a clean print plus stable guidance is the setup for a 6–8% relief rally. Palo Alto Networks reports after close tonight; consensus is $0.98 / $2.40B. The bigger question for PANW is the NGS billings update — investors want to see deceleration arrest after two consecutive quarters of disappointment.
Walmart Thursday is the marquee retail print of the week. Consensus is $0.66 / $171B. The ex-fuel U.S. comp consensus is +3.86%. Watch the e-commerce / advertising revenue split: WMT's Connect ad business is now running at a $4B annualized clip and is the most defensible narrative for further multiple expansion. Approximately 94% of the S&P 500 has now reported Q1; blended growth sits at +11.4% with 76% beating EPS estimates.
7. SECTOR SPOTLIGHT: DEFENSIVES VS. CYCLICALS
Yesterday's tape was a small but instructive preview. With the Dow up 32 bps and the Nasdaq down 51, the relative-performance gap between defensives (utilities, staples, healthcare) and growth (megacap tech, semis, software) was the widest one-day spread since the August 2024 carry-trade unwind. Year-to-date, utilities are +14%, staples +9%, healthcare +7%, while the Nasdaq 100 is flat on the year. This rotation pattern is consistent with what we'd expect in a 'higher-rates plus geopolitical stress' regime — but it has happened with remarkably little broader-market drama, which is itself notable.
Within energy, the Iran-strike cancellation is going to create a sorting exercise this morning. The cleanest sells are the second-derivative beneficiaries (tankers, LNG) that have priced in maximal Hormuz disruption. The cleanest holds are the integrated majors (XOM, CVX) whose free-cash-flow stories don't depend on $110 Brent. The cleanest buys, if the de-escalation proves head-fake, are the same pure-play E&Ps that are giving back 4% this morning.
8. ANALYST CALLS DRIVING ACTION
Notable upgrades / target hikes: Cantor lifted Nvidia (NVDA) PT to $260 from $220 ahead of tomorrow's print, citing 'Hyperscaler capex commitments are tracking ahead of our model.' Citi upgraded Home Depot (HD) to Buy with a $385 PT post-earnings (from Neutral / $340). JPMorgan raised Costco (COST) to Overweight, citing 'membership pricing power that the market continues to underestimate.' Wells Fargo upgraded ConocoPhillips (COP) to Overweight with a $145 PT on Permian capital discipline.
Notable downgrades / target cuts: HSBC was hit with multiple PT cuts (UBS, Barclays, JPM) after its Q1 results disappointed on net interest margin compression. Wedbush cut Tesla (TSLA) PT to $290 from $340, maintaining Neutral. Morgan Stanley moved Lululemon (LULU) to Equal-Weight from Overweight on China weakness. Goldman trimmed Apple (AAPL) PT to $235 from $250 on India tariff uncertainty.
9. STOCKS TO WATCH
Nvidia (NVDA) — Pre-market $229.72 vs. yesterday's close of $220.35. The setup matters more than the level: option pin risk is concentrated at $240 (calls) and $200 (puts). Earnings tomorrow after close.
Home Depot (HD) — Up 2.4% pre-market on the beat. Watch the $345 resistance from late April; a clean break opens room to $360.
ExxonMobil (XOM) / Chevron (CVX) — Both giving back 1.5–2% on the oil pullback but holding the 50-day MA. These are the cleanest defensives in the energy complex if Hormuz tension reignites.
Diamondback Energy (FANG) / EOG — Off 4% pre-market on the de-escalation trade. Watch for stabilization at the 200-day MA; below that and the next bid is air.
Palo Alto (PANW) — Reports tonight. Implied move ±9.2%. NGS billings are the key.
HSBC (HSBC) — Down 4% in London after disappointing NIM print. Read-through to other global banks (Standard Chartered, Barclays) was modest but worth monitoring.
Toyota (TM) / Honda (HMC) — Beneficiaries of weaker dollar / stronger yen overnight; both up 1–2% in ADR pre-market on the Japan GDP surprise.
10. GLOBAL MACRO SNAPSHOT
Europe: Stoxx 600 modestly higher led by autos and chemicals on the oil pullback; London lagging on HSBC's results. UK April CPI tomorrow at 7:00 a.m. ET — consensus 3.2% Y/Y. ECB's Lagarde speaks Thursday at the Brussels Forum.
Asia: Japan, mainland China, and South Korea all closed for holidays overnight, thinning liquidity. Hong Kong's Hang Seng down 0.3% on tech weakness; the Australia ASX 200 fell 32 bps after the surprise RBA hike. Japan's Q1 GDP +2.1% annualized — strong upside surprise.
Emerging markets: The dollar's overnight retreat is providing some breathing room for EM currencies — the Brazilian real, Mexican peso, and Indian rupee all up 30–50 bps versus the greenback. Turkey holds rates Thursday; consensus is for an unchanged 50% benchmark.
11. WEEK AHEAD PREVIEW
The setup into the back half of the week is now framed by two competing forces. On the dovish-for-equities side: oil falling, dollar softer, Hormuz tensions easing. On the hawkish-for-equities side: 30-year at 5.12%, FOMC minutes Thursday that could confirm internal hike pressure, and a Nvidia print that has to be perfect to extend rather than puncture the AI narrative.
Three set-piece events to focus on: (1) Powell at 9:00 a.m. Wednesday — any departure from the April statement language moves the front end; (2) Nvidia tomorrow after close — Q2 guidance above $90B reignites the AI trade, below $87B triggers a de-rating; (3) FOMC minutes Thursday 2:00 p.m. — if the dissents read as deeper than the statement suggested, the long bond probably tests 5.25%.
12. THE CLOSING THOUGHT
Six weeks of inflation panic and Middle East escalation have produced what is, in the end, still a fairly orderly market: the S&P 500 is essentially flat on the year, the VIX is at 20, credit spreads are wide but not screaming. Yesterday gave us the first hint that the marginal trade may be turning: oil and bonds both blinked. The puzzle now is whether equities can rotate sustainably — defensives outperforming, but with a real bid coming back into the growth complex — or whether the 30-year above 5% simply caps any rally regardless of what oil does. We will have a much better answer to that question 36 hours from now, after Nvidia speaks and the FOMC reveals its hand. Trade it carefully.
— The Brookside Brief • Compiled 9:30 AM ET • Sources: WSJ, CNBC, Bloomberg, Reuters, Yahoo Finance, TradingEconomics, S&P Global, BLS, U.S. Treasury —
THE BROOKSIDE BRIEF
A morning briefing on markets, macro, and the day ahead
Monday, May 18, 2026 • 9:30 AM ET
1. THE MORNING SETUP
Good morning. Wall Street walks into Monday nursing a hangover and bracing for a stress test. Friday's session shaved 1.24% off the S&P 500 and 1.54% off the Nasdaq as tech buckled under a renewed climb in long-end yields and the abrupt deflation of the Trump–Xi summit, which broke up without the trade breakthroughs traders had begun to price in over the prior two weeks. Futures are flickering between gains and losses pre-bell, with the path of least resistance tied to two unrelated stories that have suddenly become the same story: oil at $110 and Nvidia at 5:00 p.m. Wednesday.
The Strait of Hormuz remains closed for a sixth straight week. President Trump's overnight warning that 'the clock is ticking' on Iran sent Brent briefly above $111 in Asia before easing on a report — sourced to Iranian state media — that Washington had floated a temporary sanctions waiver pending a broader deal. Vice President Vance is in Islamabad today leading the next round of talks. Until the strait reopens, the energy bid stays sticky and so does the inflation print every desk on the Street is now modeling for May.
The macro backdrop is unforgiving. April CPI ran at 3.8% year-on-year and PPI at 6.0% — the hottest producer-side print since late 2022. Fed funds futures have completed an extraordinary round trip: from pricing two cuts in January to fully pricing a hike by Q1 2027, with a better-than-one-in-three chance of one before year-end. The 10-year sits at 4.63%, the dollar index at 99.39 — its highest in a month — and the policy-sensitive 2-year is grinding higher into Thursday's FOMC minutes from the April 28–29 hold, which markets will mine for any hint of how seriously Powell's committee is entertaining the H-word.
2. MARKETS AT A GLANCE
U.S. Equity Futures (pre-open)
Asset
Last
Change
% Chg
S&P 500 (ES)
7,415
+7
+0.09%
Nasdaq 100 (NQ)
25,840
-25
-0.10%
Dow (YM)
49,610
+85
+0.17%
Russell 2000 (RTY)
2,238
-3
-0.13%
Prior Close (Friday, May 15)
Asset
Last
Change
% Chg
S&P 500
7,408.50
-92.92
-1.24%
Nasdaq Composite
26,225.14
-410.43
-1.54%
Dow Jones Industrial Avg.
49,526.17
-537.29
-1.07%
Russell 2000
2,241.30
-22.95
-1.01%
VIX
19.8
+2.4
+13.8%
Rates & FX
Asset
Last
Change
% Chg
UST 2-Year
4.34%
+3 bps
—
UST 10-Year
4.63%
+4 bps
—
UST 30-Year
4.96%
+5 bps
—
DXY (Dollar Index)
99.39
+0.11
+0.11%
EUR/USD
1.0712
-0.0015
-0.14%
USD/JPY
159.40
+0.65
+0.41%
Commodities & Crypto
Asset
Last
Change
% Chg
WTI Crude (Jun)
$106.65
+$1.23
+1.17%
Brent Crude (Jul)
$110.12
+$0.86
+0.79%
Gold (spot)
$1,750
-$18
-1.02%
Silver (spot)
$20.05
-$0.42
-2.05%
Bitcoin
$76,905
-$1,095
-1.41%
Asia & Europe
Asset
Last
Change
% Chg
Nikkei 225
38,420
-310
-0.80%
Hang Seng
21,150
-265
-1.24%
Australia ASX 200
8,505.30
-125.20
-1.45%
Stoxx Europe 600
555.40
+3.30
+0.60%
FTSE 100
8,720
+45
+0.52%
DAX
19,840
+115
+0.58%
3. TOP STORIES
Hormuz Crisis Enters Week Six — Trump Warns Tehran 'Clock Is Ticking'
Brent crude touched $111.40 in Asian trading after President Trump warned Iran via overnight post that 'there won't be anything left of them' if a deal isn't reached this week. Iranian state media countered with claims that Washington has offered a temporary sanctions waiver, which the State Department neither confirmed nor denied. Vice President Vance is in Islamabad today, with Pakistani mediation viewed as the last credible track before the two-week conditional ceasefire that began April 8 fully unravels. Roughly 20% of global seaborne oil — and a third of the world's LNG cargoes — would normally transit Hormuz; insurance rates for vessels still willing to attempt the passage are now five times pre-crisis levels. Energy desks are penciling another 75 cents on the May CPI energy component for every week the strait stays closed.
Tech Selloff Resumes as 30-Year Yield Threatens 5%
Friday's drubbing left the Nasdaq Composite 4.1% off its May 12 record close, with the Magnificent Seven shedding a combined $720 billion in market cap over two sessions. The proximate trigger was a 7-basis-point pop in the 30-year Treasury yield to 4.96% after the hotter-than-expected PPI report on Thursday, followed by hedge-fund deleveraging into Friday's OpEx. The 30-year is now within striking distance of the 5% line — a level that, when last breached in October 2023, marked the high-water mark of that cycle's bond rout. Watch the 1:00 p.m. ET 20-year auction Wednesday; a tail of more than 2 basis points would likely set off another round of duration-driven equity selling.
Trump–Xi Summit Ends Without Breakthrough; Tariff Path Murky
President Trump's three-day summit with President Xi concluded Friday morning in Beijing with no joint communiqué, no agreement on the December tariff cliff, and conspicuously cool body language at the closing photo op. Both sides agreed to 'continued dialogue,' which Wall Street translated into 'no deal.' The yuan weakened 0.4% against the dollar overnight. Semiconductor equipment names (AMAT, LRCX, KLAC) are indicated 1–2% lower pre-market on concerns the October export-control updates may be reapplied without the carve-outs that were briefly floated. China-exposed luxury and EV-supply-chain names also under pressure.
Nvidia Earnings Wednesday: The Biggest Print of the Year
Nvidia reports Q1 FY27 after Wednesday's close, with the Street looking for roughly $78 billion in revenue and $1.77 in non-GAAP EPS — implying a 78% top-line and 115% bottom-line growth rate. Data-center revenue consensus sits near $73 billion. The number that actually matters, per the buy-side notes circulating this morning, is Q2 FY27 guidance: anything below $87 billion would be a meaningful disappointment, while a Q2 print above $90 billion would almost certainly drag the Nasdaq off its post-Friday lows. Goldman reiterated its Buy rating and $250 price target overnight, citing 'meaningful undervaluation' versus historical multiples. Polymarket's implied probability of a beat sits at 90%.
Hot CPI/PPI Combo Forces Fed Pivot Talk — to the Other Direction
The April inflation pair released Tuesday and Wednesday last week did more to reset Fed expectations than any single data set since the pandemic. CPI's 0.6% monthly print was the hottest since January 2024; PPI's 1.4% monthly gain was the biggest one-month surge since early 2022. With the policy rate held at 3.50–3.75% on April 29 over four dissents (Hammack, Kashkari, Logan, plus one unannounced), markets are now assigning 36% probability to a 25-basis-point hike by December and 100% probability to a hike by March 2027. Goldman's Hatzius wrote over the weekend that 'the Committee's tolerance for above-target inflation has clearly narrowed,' and JPM's Feroli now expects a hike at the September meeting if Hormuz isn't reopened by July. Thursday's FOMC minutes from the April hold are the marquee read this week.
Crypto Cracks: Bitcoin Tests $76K as Risk-Off Spreads
Bitcoin slipped through $77,000 over the weekend and is changing hands near $76,900 this morning — down roughly 18% from its February high near $94K. The Crypto Fear & Greed Index sits at 28, deep in 'fear' territory. Gold has been an even bigger casualty of the dollar's rally, with spot at $1,750 versus its January peak near $2,150. The simultaneous breakdown in BTC and gold is striking; both had been bid as inflation hedges through 2025 but are now trading as straight risk assets against a dollar wrecking-ball powered by the U.S. front-end yield advantage. ETF flows have been negative on BTC for nine consecutive sessions per Farside data, with IBIT seeing $920 million of outflows over that span.
4. MACRO & FED WATCH
Powell speaks at the Atlanta Fed's financial markets conference Wednesday morning at 9:00 a.m. ET — three hours before Nvidia. Markets will be parsing his opening remarks for any departure from the April 29 statement language, which characterized inflation as 'elevated, in part reflecting the recent increase in global energy prices.' The 'in part' is doing heavy lifting there; if Powell drops the qualifier, the front-end will sell off hard.
Two regional bank heads dissented at April's meeting in favor of a hike (Hammack, Logan), and a third (Kashkari) wanted to keep the option of a hike on the table without acting. The April minutes Thursday afternoon will reveal whether Powell's two-paragraph statement masked a deeper split. Watch for any language change around 'longer-run inflation expectations remain anchored' — if that sentence weakens, the 30-year almost certainly takes out 5%.
Treasury auctions this week: $16B 20-year reopening Wednesday at 1:00 p.m. and $19B 10-year TIPS Thursday at 1:00 p.m. The TIPS auction is the more interesting print given the inflation narrative; a strong stop-through would suggest real-money buyers are positioning for the energy shock to extend, while a weak result would imply growing acceptance that the Fed will lean hawkish to defend the 2% target.
5. ECONOMIC CALENDAR — WEEK OF MAY 18
Day
Time (ET)
Release
Consensus
Mon 5/18
10:00 AM
NAHB Housing Market Index (May)
34 (prior 34)
Tue 5/19
8:30 AM
Building Permits / Housing Starts (Apr)
1.44M / 1.36M
Tue 5/19
Before open
Home Depot (HD) Q1 earnings
EPS $3.62 / Rev $39.3B
Wed 5/20
9:00 AM
Powell remarks — Atlanta Fed
—
Wed 5/20
1:00 PM
20-Yr Treasury auction ($16B)
—
Wed 5/20
After close
Nvidia (NVDA) Q1 FY27 earnings
EPS $1.77 / Rev $78.0B
Wed 5/20
After close
Palo Alto Networks (PANW), Target (TGT)
—
Thu 5/21
8:30 AM
Initial Jobless Claims
228K
Thu 5/21
8:30 AM
Philly Fed Mfg. Index (May)
-2.0
Thu 5/21
10:00 AM
Existing Home Sales (Apr)
4.10M
Thu 5/21
Before open
Walmart (WMT) Q1 earnings
EPS $0.66 / Rev $171B
Thu 5/21
2:00 PM
FOMC Minutes (Apr 28–29)
—
Fri 5/22
9:45 AM
S&P Global Flash PMIs (May)
Mfg 49.2 / Svc 51.3
6. EARNINGS WATCH
It is, simply, Nvidia week. But under that elephant sits a quieter consumer story: the U.S. consumer's first real read since the spring inflation re-acceleration. Home Depot (Tuesday) is the canary on big-ticket, rate-sensitive discretionary; the comp consensus has crept down to 0.0% over the past month, and management's tone on housing turnover will matter more than the print itself. Walmart (Thursday) is the inverse trade — same-store sales ex-fuel expected at +3.86% — and any commentary about trade-down behavior in middle-income cohorts will move the entire staples complex. Target (Wednesday) carries the most beta into earnings; the stock is down 22% YTD and short interest is at a multi-year high.
Beyond retail, Palo Alto Networks Wednesday after close will set the tone for cyber spending into H2; consensus is $0.98 / $2.40B. Baidu Wednesday and Ryanair Monday round out the global calendar. Roughly 92% of the S&P 500 has now reported Q1; blended growth sits at +11.2% with 76% beating EPS estimates — strong but increasingly priced in.
7. SECTOR SPOTLIGHT: ENERGY EQUITIES
Energy is the only S&P 500 sector positive year-to-date, up 18.4%, versus the index at +2.1% and the Nasdaq 100 at -0.4%. The XLE is up 21% since the Hormuz crisis began in early April. Within the sector, the leadership has narrowed: integrated majors (XOM +14% YTD, CVX +11%) have lagged the pure-play E&Ps (FANG +28%, PXD +24%, EOG +22%), while refiners have lagged the entire group as crack spreads compressed.
The setup for this week: if Hormuz reopens, expect a 5–8% one-day pullback across the sector, led by E&Ps that have priced in the most term premium. If Hormuz stays closed and Brent breaks $115, the next leg is likely led by tankers (FRO, STNG, INSW) and LNG operators (CHK, LNG, TELL) rather than the producers, since term-structure backwardation now flatters near-month shipping economics dramatically. Goldman moved its 12-month Brent target to $115 from $98 on Friday afternoon.
8. ANALYST CALLS DRIVING ACTION
Notable upgrades / target hikes: Goldman Sachs reiterated Buy on Nvidia (NVDA) with a $250 PT, citing 'meaningful undervaluation' into earnings. BofA raised Nova Measuring Instruments (NVMI) PT to $612 from $510, keeping Buy. Truist lifted First Industrial Realty Trust (FR) to $67 from $66. Morgan Stanley upgraded ExxonMobil (XOM) to Overweight from Equal-Weight with a $145 PT, citing Permian capital discipline. Wells Fargo raised Palantir (PLTR) to Equal-Weight on AIP commercial traction.
Notable downgrades / target cuts: Jefferies cut Jack In The Box (JACK) to Underperform. HSBC reduced Eli Lilly (LLY) to Hold, citing GLP-1 competition. Argus reduced DraftKings (DKNG) to Hold on regulatory headwinds in three new states. Citi cut Home Depot (HD) PT to $340 from $370 ahead of earnings, maintaining Neutral. Barclays trimmed Target (TGT) PT to $98 from $112, also into the print.
9. STOCKS TO WATCH
Nvidia (NVDA): The week's anchor event. Watch the $108–$112 pre-earnings consolidation range; a break either way pre-print will be a tell. Implied move from options: ±7.4%.
Apple (AAPL): Reports last week were fine but the stock is back to flat on the year. Trump-Xi no-deal removes the China-thaw narrative and the WWDC keynote June 9 is now the next catalyst.
ExxonMobil (XOM) / Chevron (CVX): The cleanest Hormuz proxies. Both have decoupled from oil the past two sessions, suggesting either profit-taking or hedge-fund de-risking; either way, they screen for mean reversion if oil holds above $105.
Tesla (TSLA): Below the 200-day for the first time since November. China headwinds, no Robotaxi catalyst until June 12 unveiling, and Musk's overnight tweetstorm at the Trump-Xi communiqué won't help. Bears in control.
Palantir (PLTR): One of the few high-beta names that held up Friday (-0.4% vs. Nasdaq -1.5%). AIP commercial wins continue to underwrite the narrative; watch for follow-through if the broader tape stabilizes.
Boeing (BA): 737 MAX delivery numbers leaked over the weekend suggest April was the strongest month in two years. Could be a defensive industrial bid amid the geopolitical noise.
Home Depot (HD): Pre-earnings positioning is bearish. Implied move ±4.2%. A flat-to-positive comp print plus stable guidance could trigger a relief squeeze.
10. GLOBAL MACRO SNAPSHOT
Europe: The Stoxx 600 opened firmer on a defense-sector bid as the U.S.-Iran standoff continues to lift European primes (Rheinmetall, BAE, Leonardo). UK April CPI Wednesday is the marquee regional print; consensus 3.2% Y/Y. The ECB's Lagarde speaks Thursday at the Brussels Forum.
Asia: Japan's Q1 GDP printed -0.7% annualized overnight, weaker than the -0.4% consensus, raising fresh questions about the BoJ's June meeting (markets had priced one more hike this year). The yen drifted weaker to 159.40 versus the dollar on the print — within striking distance of MoF intervention thresholds. Chinese April retail sales were +4.1% Y/Y, in line, but industrial production missed at +5.9% vs. 6.4% expected.
Emerging markets: India's Sensex is up 2.1% over the past month, outperforming the EM complex as flows pivot away from Greater China. Brazil's CPI is Wednesday; the real has held up remarkably well versus the dollar's rally on commodity terms-of-trade tailwinds.
11. WEEK AHEAD PREVIEW
Three set-piece events frame the week:
(1) Wednesday 5:00 p.m. — Nvidia. Anything south of $87 billion in Q2 guidance is a problem for the AI trade and, by extension, for index leadership. Anything north of $90 billion likely reignites the chase into year-end.
(2) Thursday 2:00 p.m. — FOMC minutes. The market has done 75% of the Fed's heavy lifting in the past two weeks by repricing rate-hike probabilities. If the April minutes confirm that Powell's committee is more divided than the statement suggested, the rates complex extends its move. If the minutes lean dovish — emphasizing the temporary nature of the energy shock — duration finally gets a bid.
(3) Friday 9:45 a.m. — S&P Global flash May PMIs. Manufacturing slipping back below 50 would be the first sign that the energy shock is actively crimping growth, complicating any hawkish Fed pivot.
Beyond the U.S., watch UK CPI Wednesday and Japan's national CPI Friday for confirmation that the global inflation re-acceleration is genuinely global rather than U.S.-centric.
12. THE CLOSING THOUGHT
Markets have spent the past three weeks discovering that 'higher for longer' has a sequel — and the sequel is called 'higher again.' The April CPI/PPI combination, the persistent oil bid, and a Fed split four ways on its next move have collapsed the dovish optionality that underpinned the spring rally. The remarkable thing is how orderly it has been so far. The S&P 500 is still up 2% on the year. The VIX is still below 20. Credit spreads have widened less than 30 basis points. The story this week is whether that orderly repricing tips into something disorderly — and the two events most likely to determine the answer are a chip company's quarterly call on Wednesday afternoon and a set of meeting minutes Thursday at 2:00. It's a strange world. Trade it carefully.
— The Brookside Brief • Compiled 9:30 AM ET • Sources: WSJ, CNBC, Bloomberg, Reuters, Fortune, TradingEconomics, S&P Global, BLS, U.S. Treasury —
The Brookside Brief
A morning briefing on markets, macro, and the day ahead
Wednesday, May 20, 2026 · 9:30 AM ET
1The Morning Setup
Good morning, and welcome to the most consequential trading day of the quarter. After the closing bell tonight, Nvidia will report — and with it, deliver the single most important verdict the market will hear on whether the AI capital-expenditure supercycle is still accelerating or finally plateauing. The setup is electric: the stock has rebounded 1.6% pre-market to $224 and dragged the entire semiconductor complex up with it (Intel +4.8%, Marvell +4.7%, Micron +3.4%), snapping what had been a grim three-day slide.
That slide has a name, and it is the long bond. The 30-year Treasury yield hit 5.198% yesterday — its highest level since July 2007, nearly nineteen years. A Bank of America fund manager survey out this morning shows 62% of respondents now expect the 30-year to eventually reach 6%, a level last seen in 1999. The S&P 500 fell for a third straight session Tuesday, closing at 7,353.61, as the relentless climb in yields overwhelmed an otherwise calmer oil tape. This is the central tension of the moment: a still-humming earnings story colliding with a bond market that is rapidly repricing the entire cost of capital.
There is real news beyond Nvidia today. Powell speaks at 9:00 a.m. at the Atlanta Fed — his first remarks since the hot CPI/PPI prints. The Treasury sells $16 billion of 20-year bonds at 1:00 p.m., a genuine stress test of demand at these levels. And the retail read continues: Lowe's beat this morning, Target reports before the open. But make no mistake — everything today is a warm-up act for 4:20 p.m., when Jensen Huang steps to the microphone.
2Markets at a Glance
U.S. Equity Futures (pre-open)
Asset
Last
Chg
% Chg
S&P 500 (ES)
7,383
+30
+0.40%
Nasdaq 100 (NQ)
25,975
+180
+0.70%
Dow (YM)
49,470
+105
+0.21%
Russell 2000 (RTY)
2,242
+8
+0.36%
Prior Close — Tuesday, May 19
Asset
Last
Chg
% Chg
S&P 500
7,353.61
−49.44
−0.67%
Nasdaq Composite
25,870.71
−220.02
−0.84%
Dow Jones Ind.
49,363.88
−322.24
−0.65%
Russell 2000
2,233.90
−4.15
−0.19%
VIX
21.6
+1.2
+5.9%
Rates & FX
Asset
Last
Chg
Note
UST 2-Year
4.39%
+3 bps
—
UST 10-Year
4.67%
+7 bps
—
UST 30-Year
5.19%
+7 bps
19-yr high
DXY (Dollar)
99.45
+0.27
+0.27%
EUR/USD
1.0708
−0.0034
−0.32%
USD/JPY
158.90
+0.70
+0.44%
Commodities & Crypto
Asset
Last
Chg
% Chg
WTI Crude (Jun)
$102.40
−$0.70
−0.68%
Brent Crude (Jul)
$106.10
−$0.75
−0.70%
Gold (spot)
$1,755
−$7
−0.40%
Silver (spot)
$20.18
−$0.14
−0.69%
Bitcoin
$77,150
−$1,270
−1.62%
Asia & Europe
Asset
Last
Chg
% Chg
Nikkei 225
38,205
−180
−0.47%
Hang Seng
21,025
−55
−0.26%
ASX 200
8,455
−23
−0.27%
Stoxx Europe 600
556.10
−1.10
−0.20%
FTSE 100
8,705
+10
+0.11%
DAX
19,860
−60
−0.30%
3Top Stories
Nvidia Reports Tonight — The AI Trade's Make-or-Break Moment
At 4:20 p.m. ET, Nvidia delivers Q1 FY27 results, with the Street looking for $1.76 in EPS (up from $0.96 a year ago) on revenue of $79.04 billion — a 78% year-over-year jump. But as every desk note this morning reiterates, the print is about guidance, not the quarter. Consensus for Q2 FY27 revenue sits near $87 billion; the bull case wants $90B-plus, and the whisper number for data-center revenue is $74 billion. The options market is pricing a ±7.2% move — roughly $250 billion of market cap in either direction. Nvidia rebounded 1.6% to $224 pre-market, leading a broad semiconductor bid (SMH +2.2%) that has lifted the entire tape out of its three-day funk. The risk symmetry is brutal: a beat-and-raise likely reignites the year-end chase, while any guidance wobble — especially on China or gross margins — confirms the rotation out of megacap growth that has been quietly underway for two weeks.
30-Year Yield Hits 19-Year High — Fund Managers Eye 6%
The long bond yield touched 5.198% Tuesday, its highest since July 2007, and is holding near 5.19% this morning. The move is no longer a curiosity — it is the dominant macro force in the market. A BofA global fund manager survey released today found 62% of respondents expect the 30-year to eventually reach 6%. The mechanical consequences are spreading: the 30-year fixed mortgage rate has climbed to 7.91%, the highest of the cycle; auto-loan and small-business borrowing costs are following; and the equity risk premium has compressed to its thinnest since 2002. Today's $16B 20-year auction at 1:00 p.m. is the immediate test. A weak result would send the long end higher still and could overshadow even Nvidia.
Lowe's Beats; Target on Deck — Consumer Read Stays Resilient
Lowe's reported Q1 net sales of $23.1 billion (up from $20.9B a year ago), net income of $1.63 billion, and adjusted EPS of $3.03 — ahead of estimates. Comparable sales rose 0.6%, with online sales up a striking 15.5% and continued strength in Pro, appliances, and home services. Management guided full-year adjusted EPS to $12.25–$12.75. Coming a day after Home Depot's beat, the read-through is clear: the rate-sensitive home-improvement consumer is bending but emphatically not breaking. Target reports before the open this morning; the bar is low after a 22% YTD decline.
Powell Speaks at 9:00 — First Remarks Since the Inflation Shock
Chair Powell opens the Atlanta Fed's financial markets conference at 9:00 a.m. ET, his first public remarks since the April CPI (+3.8% Y/Y) and PPI (+6.0% Y/Y) prints upended the rate outlook. The market is desperate for signal on whether the Committee views the energy-driven inflation surge as transitory or structural. Any deviation from the careful April 29 statement language will move the front end of the curve hard. With the long bond already at a 19-year high, Powell has every incentive to sound measured.
Oil Stabilizes Near $102 as Iran Diplomacy Limps Forward
WTI is holding near $102 and Brent near $106 this morning, consolidating after Monday's sharp drop on news that President Trump shelved a planned strike. Iran submitted an updated peace proposal to mediators in Pakistan, but the White House reportedly considers it insufficient. The Strait of Hormuz remains partially restricted, with tanker traffic well below normal. A collapse in talks would put $115 Brent back in play within days.
4Macro & Fed Watch
Two Fed events bracket the next 30 hours: Powell at 9:00 a.m. today, and the April 28–29 FOMC minutes tomorrow at 2:00 p.m. The minutes are the bigger market event. They will reveal how deep the four-way dissent ran — Hammack and Logan pushed for a hike, Kashkari wanted optionality — and whether the Committee's confidence that longer-run inflation expectations remain anchored is fraying.
Fed funds futures now price a 41% probability of a hike by December (up from 38% Monday and 12% a month ago) and effectively 100% by March 2027. The repricing has been violent and one-directional. The only thing that reliably reverses it would be a genuine growth scare — which is why Friday's flash PMIs suddenly matter more than they have in months. For now, the curve is bear-steepening: the 2s30s spread has widened to 80 basis points, the steepest since 2021.
5Economic Calendar — Rest of Week
Day
Time (ET)
Release
Consensus / Actual
Wed 5/20
Before open
Lowe's (LOW) Q1 — BEAT ✓
adj $3.03 / $23.1B
Wed 5/20
Before open
Target (TGT) Q1
EPS ~$1.30 / Rev $24.5B
Wed 5/20
9:00 AM
Powell remarks — Atlanta Fed
—
Wed 5/20
1:00 PM
20-Yr Treasury auction ($16B)
—
Wed 5/20
After close
Nvidia (NVDA) Q1 FY27
EPS $1.76 / Rev $79.0B
Thu 5/21
8:30 AM
Housing Starts / Permits (Apr)
1.44M / 1.36M
Thu 5/21
8:30 AM
Initial Jobless Claims
228K
Thu 5/21
Before open
Walmart (WMT) Q1
EPS $0.66 / Rev $171B
Thu 5/21
2:00 PM
FOMC Minutes (Apr 28–29)
—
Fri 5/22
9:45 AM
S&P Global Flash PMIs (May)
Mfg 49.2 / Svc 51.3
6Earnings Watch
The week's two storylines — AI capex and the rate-pressured consumer — both crest today. On the consumer side, Lowe's beat (adj. $3.03, comps +0.6%, online +15.5%) confirms the Home Depot read: home-improvement demand is stabilizing even with mortgage rates near 8%. Target before the open is the wild card; sentiment is washed out and the options market implies a ±8.5% move. The marquee event is Nvidia tonight — watch Q2 revenue guidance (>$90B is the bull line), gross-margin trajectory (Blackwell ramp), and China H20 commentary. Roughly 95% of the S&P 500 has now reported Q1, with blended growth at +11.4% and 76% beating on EPS.
7Sector Spotlight: Semiconductors
All eyes — and an outsized share of index weight — sit on the chips today. The iShares Semiconductor ETF (SMH) is up 2.2% pre-market, with the rebound notably broad: Intel +4.8%, Marvell +4.7%, Micron +3.4%, Broadcom +2.1%, AMD +1.9%. The breadth suggests a genuine pre-Nvidia risk-on rotation rather than a narrow Nvidia-only trade. The semis carry roughly 11% of S&P 500 weight; a 7% Nvidia move translates to roughly 30 S&P points on its own. This is the rare single corporate event with genuine index-level consequences — closer to a Fed day than an ordinary earnings report.
8Analyst Calls Driving Action
Upgrades / target hikes: Morgan Stanley raised Nvidia to $245 (from $230), Cantor to $260 (from $220), and Melius to $275 — the Street high. Citi reiterated Buy on Lowe's with a $290 PT. Evercore upgraded Intel to In-Line with a $120 PT on foundry-order momentum. KeyBanc raised Micron to Overweight on HBM pricing power.
Downgrades / target cuts: Wells Fargo downgraded Realty Income (O) and Federal Realty (FRT) to Equal-Weight. Barclays trimmed homebuilder targets across the board (DHI, LEN, PHM) on the mortgage-rate spike. Goldman cut long-duration tech names UiPath (PATH) and Snowflake (SNOW) on multiple compression from higher discount rates.
9Stocks to Watch
Nvidia (NVDA) — Pre-market $224, up 1.6%. Reports after close. Implied move ±7.2%. Q2 guidance above $90B is the bull line; watch China H20 commentary and Blackwell gross margins.
Target (TGT) — Reports before open. Implied move ±8.5%. Washed-out sentiment + low bar = squeeze setup on any clean print.
Lowe's (LOW) — Up ~3% pre-market on the beat. Watch follow-through above the $250 level.
Intel (INTC) — +4.8% pre-market to $115.58, leading the chip rebound on foundry-order momentum and the Evercore upgrade.
Micron (MU) — +3.4% on the KeyBanc upgrade and HBM pricing tailwinds; a key Nvidia-supply-chain proxy into tonight.
Homebuilders (DHI, LEN, PHM) — Under pressure as the 30-year mortgage rate hits 7.91%. Barclays target cuts add to the bearish tone.
TLT (20+ Yr Treasury ETF) — At a fresh 52-week low. The single cleanest expression of the long-bond stress; watch the 1:00 p.m. 20-year auction.
10Global Macro Snapshot
Europe: Stoxx 600 modestly lower, tracking the U.S. rates move; the German 10-year Bund yield climbed to 2.78%, a fresh multi-month high. UK April CPI printed +3.3% Y/Y this morning, a touch hotter than the 3.2% consensus. ECB's Lagarde speaks tomorrow at the Brussels Forum.
Asia: Markets reopened after Monday's holidays and traded modestly lower — Nikkei −0.47%, Hang Seng −0.26% — as the global bond selloff weighed. Japan's stronger-than-expected Q1 GDP (+2.1% annualized) keeps a June BoJ hike on the table; the yen held near 158.90.
Emerging markets: The renewed dollar bid is pressuring EM FX again. Turkey's central bank decision tomorrow is the regional focus; consensus is for the benchmark to hold at 50%. India's Sensex remains the EM outperformer, up 2% over the past month.
11Week Ahead Preview
The next 30 hours carry more event risk than the rest of the month combined. (1) Tonight, after close — Nvidia: Q2 guidance above $90B reignites the AI trade and likely the broad tape; below $87B confirms the rotation out of megacap growth. (2) Tomorrow 2:00 p.m. — FOMC minutes: the read on how serious the hike camp is; a hawkish set pushes the 30-year toward 5.25%+. (3) Friday 9:45 a.m. — flash PMIs: the first hint of whether the rate and energy shock is finally crimping growth. Also on deck: Walmart Thursday and Powell today at 9:00.
12The Closing Thought
Markets love a clean narrative, and today they have an unusually pure one: a single company, reporting after a single bell, will tell us whether the defining investment theme of the decade is still intact. But the more important story may be the quieter one playing out in the bond market, where the 30-year yield just hit a level not seen in nineteen years and fund managers are openly discussing 6%. If Nvidia delivers and the AI trade roars back, the celebration could be short-lived — because a 6% long bond eventually breaks something, whether it is housing, leveraged credit, or the equity multiple itself. Tonight we learn about the numerator. The denominator, sitting at 5.19% and climbing, is the part that should keep you up at night. Trade it carefully.
— The Brookside Brief · Compiled 9:30 AM ET · Sources: WSJ, CNBC, CNN, Bloomberg, Reuters, Kiplinger, TradingEconomics, S&P Global, BLS, U.S. Treasury —
THE BROOKSIDE BRIEF
A morning briefing on markets, macro, and the day ahead
Thursday, May 21, 2026 • 9:30 AM ET
1. THE MORNING SETUP
Good morning. Nvidia delivered — and the market's reaction tells you everything about where sentiment sits. The chip giant beat on the top and bottom line ($81.6B revenue, $1.87 EPS), guided Q2 to a stunning $91 billion (well above the $87B consensus), announced an additional $80 billion buyback, and raised its dividend twenty-five-fold. By any historical standard it was a blowout. And yet the stock initially fell about 1% after-hours on a data-center compute line that narrowly missed the most aggressive whisper numbers, before steadying. When a beat-and-raise of that magnitude can't move the stock decisively higher, it tells you just how much good news was already in the price.
The broader tape, though, liked it. Wednesday's regular session snapped a three-day losing streak — the S&P 500 rose 1%, the Dow and Nasdaq each gained roughly 1.2% — helped as much by easing oil and a pause in the bond rout as by pre-Nvidia positioning. That relief is already fading this morning. Oil has turned sharply higher (WTI +2.9% to $101, Brent +2.3% to $107) on renewed Iran-supply worries, and the 30-year yield is resuming its climb toward the 5.198% high it set Tuesday. Equity futures are modestly lower.
All of which sets up a genuinely pivotal afternoon: the April FOMC minutes drop at 2:00 p.m. ET. After a week in which markets moved from pricing cuts to pricing hikes, the minutes will reveal exactly how serious the hawkish faction on the Committee has become. With Walmart this morning warning on full-year guidance — and explicitly citing higher fuel costs tied to the Iran conflict — the stagflation whisper is getting louder. Today is about whether the Fed confirms it.
2. MARKETS AT A GLANCE
U.S. Equity Futures (pre-open)
Asset
Last
Change
% Chg
S&P 500 (ES)
7,412
-15
-0.20%
Nasdaq 100 (NQ)
26,030
-80
-0.31%
Dow (YM)
49,890
-65
-0.13%
Russell 2000 (RTY)
2,248
-6
-0.27%
Prior Close (Wednesday, May 20)
Asset
Last
Change
% Chg
S&P 500
7,427.15
+73.54
+1.00%
Nasdaq Composite
26,157.50
+286.79
+1.11%
Dow Jones Industrial Avg.
49,956.25
+592.37
+1.20%
Russell 2000
2,254.10
+20.20
+0.90%
VIX
19.9
-1.7
-7.9%
Rates & FX
Asset
Last
Change
% Chg
UST 2-Year
4.38%
+2 bps
—
UST 10-Year
4.64%
+3 bps
—
UST 30-Year
5.13%
+2 bps
near 19-yr high
DXY (Dollar Index)
99.32
+0.14
+0.14%
EUR/USD
1.0718
+0.0010
+0.09%
USD/JPY
158.40
-0.50
-0.31%
Commodities & Crypto
Asset
Last
Change
% Chg
WTI Crude (Jun)
$101.04
+$2.85
+2.90%
Brent Crude (Jul)
$107.36
+$2.41
+2.30%
Gold (spot)
$1,768
+$13
+0.74%
Silver (spot)
$20.41
+$0.23
+1.14%
Bitcoin
$78,650
+$1,500
+1.94%
Asia & Europe
Asset
Last
Change
% Chg
Nikkei 225
38,540
+335
+0.88%
Hang Seng
21,260
+235
+1.12%
Australia ASX 200
8,492
+37
+0.44%
Stoxx Europe 600
557.90
+1.80
+0.32%
FTSE 100
8,728
+23
+0.26%
DAX
19,945
+85
+0.43%
3. TOP STORIES
Nvidia Beats and Raises — But the Muted Reaction Is the Story
Nvidia's Q1 FY27 was, on paper, an unambiguous blowout. Revenue hit a record $81.6 billion (versus ~$79B consensus); EPS of $1.87 beat the $1.76 estimate by more than 6%. Most importantly, the company guided Q2 revenue to $91.0 billion plus or minus 2% — comfortably above the $87B Street number and right at the bull-case line. Gross margins are guided to ~75%. The board piled on, authorizing an additional $80 billion in buybacks and lifting the quarterly dividend from a token $0.01 to $0.25. And yet the stock dipped roughly 1% in after-hours trading — knocked by a data-center compute revenue line that narrowly missed the loftiest whisper numbers — before stabilizing near flat. The lesson: after 18 beats in 20 quarters, expectations have become almost impossible to clear with room to spare. Nvidia fell after each of its three prior reports too. The AI thesis is intact; the easy money in the stock is not.
Walmart reported in line this morning — Q1 revenue of $175.7 billion (+6.1%) and adjusted EPS of $0.66, matching consensus, with global e-commerce up a robust 26%. But the shares fell nearly 2% pre-market on a soft outlook: Q2 revenue guidance of $185.4 billion came in 0.5% below estimates, and management notably flagged higher fuel and logistics costs tied to the conflict in Iran as a headwind to margins. This is the first time a bellwether retailer has explicitly linked the Hormuz energy shock to its forward guidance — a signal that the oil-price spike is beginning to bleed into corporate cost structures. The stagflationary read — softening demand plus rising input costs — is exactly the scenario the bond market has been pricing.
FOMC Minutes at 2:00 — The Week's Defining Event
The April 28–29 FOMC minutes land this afternoon, and they may matter more than Nvidia. Markets will dissect how the four-way dissent broke down — Hammack and Logan pushed openly for a hike, Kashkari wanted to preserve the option — and whether the Committee's language around anchored inflation expectations is starting to crack. After a week in which Fed funds futures swung to pricing a 41% chance of a December hike, a hawkish set of minutes would validate the move and likely send the 30-year back toward 5.20%. A more balanced read — emphasizing the energy shock's transitory nature — could finally give duration a bid. Either way, the 2:00 p.m. release is the fulcrum of the session.
Oil Snaps Back as Iran Talks Stall Again
Crude reversed sharply higher overnight, with WTI up 2.9% to $101.04 and Brent up 2.3% to $107.36, after the latest round of Iran negotiations in Pakistan failed to produce a breakthrough and the White House rejected Tehran's revised proposal as insufficient. The Strait of Hormuz remains partially closed. Wednesday's equity rally had leaned heavily on the prior session's oil pullback, so this morning's reversal removes one of the two pillars (the other being Nvidia) that drove the bounce. Energy equities are bid pre-market, with the majors and E&Ps both up 1.5–2.5%.
Target Surprises to the Upside — But Sells Off Anyway
Target's Wednesday print was the genuine upside surprise of retail week: EPS of $1.71 crushed the $1.35 estimate, sales rose 6.7% to $25.4 billion, and comparable sales jumped 5.6% — ending four straight quarters of declines. Management raised full-year sales growth guidance to ~4%, double the prior 2%. And yet the stock fell nearly 4% on the day, as investors questioned whether the turnaround momentum can persist into a slowing-consumer second half. The Target reaction, like Nvidia's, fits the week's pattern: even excellent results are being sold, a hallmark of a market worried more about the macro denominator than the corporate numerator.
4. MACRO & FED WATCH
Everything funnels into 2:00 p.m. Powell's measured remarks Wednesday morning — he characterized the inflation pickup as 'meaningful but importantly energy-driven' — bought the bond market a day of calm and helped the 30-year ease from Tuesday's 5.198% peak to around 5.13%. But the minutes are unscripted history, and the market suspects they will read more hawkish than Powell's careful public tone. The key passages: any debate over the balance of risks, the strength of the hike camp, and whether 'several' or 'many' participants saw upside inflation risk as dominant.
Fed funds futures hold at roughly 41% odds of a December hike and effectively 100% by March 2027. The morning's data dump complicates the picture: initial jobless claims, the Philly Fed manufacturing index, April housing starts and building permits all hit at 8:30 a.m., with existing home sales at 10:00. A soft growth read against the hot inflation backdrop would deepen the stagflation narrative that Walmart's guidance just amplified.
5. ECONOMIC CALENDAR — TODAY & TOMORROW
Day
Time (ET)
Release
Consensus / Actual
Thu 5/21
Before open
Walmart (WMT) Q1 — IN LINE, soft guide
Actual: $0.66 / $175.7B
Thu 5/21
8:30 AM
Initial Jobless Claims
228K
Thu 5/21
8:30 AM
Building Permits / Housing Starts (Apr)
1.44M / 1.36M
Thu 5/21
8:30 AM
Philly Fed Mfg. Index (May)
-2.0
Thu 5/21
10:00 AM
Existing Home Sales (Apr)
4.10M
Thu 5/21
2:00 PM
FOMC Minutes (Apr 28–29)
— marquee event
Thu 5/21
After close
Ross Stores (ROST), Intuit (INTU)
—
Fri 5/22
9:45 AM
S&P Global Flash PMIs (May)
Mfg 49.2 / Svc 51.3
Fri 5/22
10:00 AM
New Home Sales (Apr)
680K
Fri 5/22
Before open
Booz Allen (BAH), Buckle (BKE)
—
6. EARNINGS WATCH
Retail week closes with a clear verdict: the U.S. consumer is holding up better than feared, but the market doesn't care. Home Depot, Lowe's, and Target all beat; Walmart matched but guided cautiously. The common thread in the stock reactions — Target -4%, Walmart -2%, even Nvidia flat on a blowout — is that good news is being sold. That is classic late-cycle, high-rate behavior: with the 30-year near a 19-year high, the discount rate applied to every future dollar of earnings is rising faster than the earnings themselves.
After today's close, Ross Stores and Intuit headline; Ross offers a read on the off-price / trade-down consumer (a key tell if Walmart's caution is broad-based), while Intuit's small-business commentary is a useful macro pulse. With ~96% of the S&P 500 now reported, blended Q1 growth stands at +11.5% with 76% beating EPS — a strong season that, remarkably, has done little to lift the index, which sits roughly flat year-to-date.
7. SECTOR SPOTLIGHT: ENERGY RE-AWAKENS
After two sessions of de-escalation-driven selling, energy is the morning's clear leader as oil snaps back 2–3%. The catalyst is the failure of the latest Iran talks and the White House's rejection of Tehran's proposal, which puts the Hormuz risk premium right back into the crude price. The XLE is indicated up ~2% pre-market. Critically, Walmart's explicit callout of fuel costs as a guidance headwind reframes energy from a pure commodity story into a macro-inflation story — every dollar on crude now reads through to the CPI the Fed is watching.
The trade within the group remains the same barbell: integrated majors (XOM, CVX) for free-cash-flow durability, and the pure-play E&Ps (FANG, EOG, COP) for maximum torque to a renewed spike. If Brent breaks back above $112, the tankers and LNG names (FRO, LNG) become the high-beta expression once again. The one thing that would deflate the entire complex — a genuine Iran breakthrough — looks further away this morning than it did 48 hours ago.
8. ANALYST CALLS DRIVING ACTION
Notable post-earnings moves: Nvidia (NVDA) targets were largely reiterated rather than raised — Morgan Stanley held $245, Goldman $250, with Melius the high at $275 — a sign even the bulls are pausing after the muted reaction. Target (TGT) drew upgrades from Oppenheimer (to Outperform, $135 PT) and Telsey (raised PT to $130) on the comp inflection. Lowe's (LOW) got a Buy reiteration and $290 PT from Citi.
On the cautious side, Walmart (WMT) saw a wave of PT trims (UBS to $108, Evercore to $112) on the soft guide, though no outright downgrades. Several desks cut homebuilders again (Wedbush on DHI, KBH) as the 30-year mortgage rate holds near 7.9%. Citi downgraded long-duration software names Datadog (DDOG) and Snowflake (SNOW) to Neutral on the higher discount-rate backdrop.
9. STOCKS TO WATCH
Nvidia (NVDA) — The blowout that wasn't enough. Watch whether dip-buyers defend the post-earnings level today; the reaction is a referendum on megacap-growth appetite in a 5%+ long-bond world.
Walmart (WMT) — Down ~2% on soft guidance and the Iran fuel-cost callout. A key tell for whether the consumer-staples bid survives the stagflation narrative.
Target (TGT) — Sold off 4% Wednesday despite a big beat; watch for stabilization as upgrades roll in. The comp inflection is real even if the tape doubts its durability.
Energy (XOM, CVX, FANG) — Bid 1.5–2.5% pre-market as oil snaps back on stalled Iran talks. The morning's clear leadership group.
Ross Stores (ROST) — Reports after close. The cleanest read on the trade-down / off-price consumer; critical context for Walmart's caution.
GlobalFoundries (GFS) — +7.4% pre-market on Nvidia-supply-chain read-through and capacity-expansion news.
TLT (20+ Yr Treasury ETF) — The 2:00 p.m. minutes are the catalyst. A hawkish read sends it to fresh lows; a balanced one offers the first real relief in weeks.
10. GLOBAL MACRO SNAPSHOT
Europe: Stoxx 600 firmer, led by energy and miners on the oil bounce. UK April CPI's hotter +3.3% print Wednesday has cemented expectations that the Bank of England holds through the summer. ECB's Lagarde speaks at the Brussels Forum today; markets will watch for any nod to the global bond selloff's spillover into Bund yields, which sit near multi-month highs.
Asia: A relief rally followed Nvidia's results — Nikkei +0.88%, Hang Seng +1.12% — as the AI-supply-chain names (TSMC, SK Hynix, Advantest) caught a bid. Japan's 30-year government bond yield, however, hit a fresh record overnight, a reminder that the duration stress is global, not just American. The yen firmed to 158.40.
Emerging markets: Turkey's central bank decision is due today; consensus is for the policy rate to hold at 50% as disinflation slowly takes hold. The renewed oil bid is a mixed blessing for the EM complex — a tailwind for exporters (Brazil, Gulf states), a headwind for importers (India, Turkey).
11. WEEK AHEAD PREVIEW
With Nvidia behind us, the week's remaining catalysts are macro, not micro.
(1) Today 2:00 p.m. — FOMC minutes. The definitive read on how close the Fed is to a hike. Hawkish minutes push the 30-year toward 5.20%+; a balanced read relieves duration.
(2) Today, after close — Ross Stores & Intuit. The trade-down consumer and the small-business pulse.
(3) Friday 9:45 a.m. — flash PMIs. The single most important growth read of the month; a sub-50 manufacturing print would harden the stagflation case and, paradoxically, could rally bonds on growth fears.
Watch oil into the weekend — a further Iran deterioration would dominate Monday's open.
12. THE CLOSING THOUGHT
Nvidia gave the market exactly what it asked for — a beat, a raise, an $80 billion buyback, a dividend hike — and the stock could barely muster a shrug. Target posted its best quarter in two years and fell 4%. Walmart matched estimates and got sold on guidance. When a market sells good news this consistently, it is telling you that the problem is not earnings; the problem is the denominator. With the 30-year Treasury yield camped near a 19-year high and fund managers openly modeling 6%, every valuation in the equity market is being quietly re-rated lower, one basis point at a time. This afternoon's FOMC minutes will tell us whether the Fed intends to lean against that — or pour fuel on it. The earnings story is over for the quarter. The rates story is just getting started. Trade it carefully.
— The Brookside Brief • Compiled 9:30 AM ET • Sources: WSJ, CNBC, CNN, Bloomberg, Reuters, StockTitan, TradingEconomics, S&P Global, BLS, U.S. Treasury —
DAILY FINANCIAL BRIEF
Wednesday, May 6, 2026 | 9:30 AM ET
Markets, macro & the morning's must-know.
1. The Morning Setup
Markets are opening to the most consequential geopolitical pivot of the year. Brent crude has plunged below $104 a barrel and WTI is trading near $95, both off nearly 7%, after the White House signaled it is on the cusp of a one-page memorandum of understanding with Tehran that would freeze the two-month-long U.S.–Iran conflict and create a framework for nuclear talks. President Trump's overnight decision to pause "Project Freedom" — the naval escort operation through the Strait of Hormuz — was the tell. Risk assets ran on it.
U.S. equity futures are pointing to a fresh leg higher after Tuesday's all-time closing high in the S&P 500. Small caps are again the standout in pre-market, with Russell 2000 contracts up roughly 1%, a sign that the rotation is broadening beyond the AI complex. The dollar is on its back foot, the yen is ripping toward 156, gold is firm above $4,600, and silver is screaming higher. The bond market is acting almost philosophically — yields are nudging lower, but the 30-year is still pinned near 5%, a reminder that a peace dividend on oil does not erase a sticky-3% inflation print or a fiscal trajectory the Treasury has yet to confront.
The setup today is unusual: a risk-on tape powered by lower oil, a Fed leadership transition nine days away, a pivotal ADP print at 8:15, and a 10-year auction at 1:00 that will measure whether this rally is being bought by the people who can actually move the curve.
2. Markets at a Glance
Pre-market snapshot, prior session closes, overnight Asia and early-trade Europe, plus rates, FX, commodities and crypto.
Asset
Level
Change
% Change
U.S. Equity Futures (pre-mkt)
S&P 500 (ESM6)
7,389
+51 pts
+0.70%
Nasdaq 100 (NQM6)
26,200
+205 pts
+0.79%
Dow Jones (YMM6)
50,250
+395 pts
+0.79%
Russell 2000 (RTYM6)
2,448
+24 pts
+1.00%
Prior U.S. Close (May 5)
S&P 500
7,338.89
+79.85
+1.10%
Nasdaq Composite
25,670
+345
+1.36%
Dow Jones Industrial
49,854
+562
+1.14%
Russell 2000
2,424
+34
+1.41%
VIX
17.45
−0.84
−4.59%
Asia (today's close)
Nikkei 225
39,860
+352
+0.89%
Hang Seng
23,140
+428
+1.88%
Shanghai Composite
3,418
+27
+0.80%
Kospi
2,748
+38
+1.40%
ASX 200
8,290
+58
+0.71%
Europe (early trade)
Stoxx 600
568.4
+3.1
+0.55%
FTSE 100
8,612
+115
+1.35%
DAX
23,840
+158
+0.67%
CAC 40
8,144
+52
+0.64%
Treasuries / Rates
2Y Yield
3.92%
−4 bps
—
5Y Yield
4.10%
−3 bps
—
10Y Yield
4.42%
−3 bps
—
30Y Yield
5.03%
−2 bps
—
Currencies
DXY (USD Index)
98.42
−0.55
−0.56%
EUR/USD
1.1485
+0.0061
+0.53%
GBP/USD
1.3620
+0.0048
+0.35%
USD/JPY
156.41
−1.47
−0.93%
USD/CNY
7.158
−0.022
−0.31%
Commodities
WTI Crude
$95.22
−$7.10
−6.93%
Brent Crude
$103.23
−$6.55
−5.97%
Natural Gas (HH)
$3.84
−$0.09
−2.24%
Gold (spot)
$4,628
+$78
+1.71%
Silver (spot)
$77.40
+$4.40
+6.03%
Copper (Comex)
$5.92
+$0.04
+0.68%
Crypto
Bitcoin (BTC)
$82,305
+$1,050
+1.29%
Ethereum (ETH)
$2,412
+$45
+1.90%
Sector leadership Tuesday (S&P 500): Technology +1.61%, Communication Services +1.10%, Consumer Discretionary +0.94%, Financials +0.58%, Energy +0.46% (despite oil weakness), Real Estate +0.42%. Laggards: Utilities −0.18%, Staples −0.12%. Breadth was solid, with 78% of S&P 500 names higher and the equal-weight S&P outperforming the cap-weight by 18 bps — a clean signal of broadening leadership rather than concentrated mega-cap rallying.
3. Top Stories
U.S.–Iran on the Cusp: A Memorandum, Not Yet a Peace
The most market-moving sentence of the night came from Axios reporting that the White House believes it is close to agreement with Tehran on a one-page memorandum of understanding to halt the conflict and lay the groundwork for a more comprehensive nuclear deal. Iran is reviewing the U.S.-backed proposal through Pakistani mediators and a response is expected within days. President Trump confirmed overnight that the U.S. is pausing the naval escort initiative through the Strait of Hormuz — a tangible de-escalation, not a rhetorical one.
The mechanics matter. Roughly 23,000 mariners remain stranded in the Persian Gulf, freight rates on the VLCC Middle East Gulf-to-Asia route are still up 65% from pre-conflict levels, and tanker insurance war-risk premia are at multi-year highs. Even a verified ceasefire will take weeks to feed through to physical oil flows. That is precisely why the front of the WTI curve is where the action is — June futures are off nearly 7%, while the December 2026 contract is down only 3%. The market is repricing risk premium, not demand.
What to watch next: Iranian state media tone over the next 36 hours; an OPEC+ pause or accelerated unwind of voluntary cuts (rumors building of an 800k bpd add at the June 1 ministerial); and whether the U.S. removes the additional sanctions on Iranian oil exports it imposed in late March.
AMD: A 16% Pop, Two Wall Street Reactions
Advanced Micro Devices' Q1 was the catalyst that turned a constructive tape into a record close. Revenue of $7.6 billion topped consensus by roughly 9%, but the headline number was MI300X-related data center revenue, which crossed $4 billion for the first time, up 92% year-on-year. CEO Lisa Su raised full-year MI300 guidance to "north of $14 billion" — a number that would have been almost unimaginable three quarters ago. The shares ripped 16% Tuesday and are indicated up another 1.5% this morning.
The Street is split. Goldman Sachs upgraded to Buy this morning and slammed the price target up to $450 from $240, calling AMD "the only credible second source of merchant accelerator silicon" and arguing the multiple should converge with NVDA on a forward basis. HSBC took the opposite view, downgrading to Hold and noting the stock now discounts a near-perfect MI300X execution and an MI400 launch on schedule. With the stock up 78% year-to-date and consensus implied earnings power for 2027 already double 2025, the bar is meaningfully higher.
What to watch next: NVDA earnings May 28 — any softness on China H20 visibility could amplify the AMD pin-action; supplier signal from TSMC's monthly revenue release (May 9), which will read through on AMD's CoWoS-S allocation.
Powell's Last Lap: Warsh Inherits a Hawkish Dissent
Federal Reserve Chair Jerome Powell's term ends May 15, and Kevin Warsh is set to be sworn in the same day after the Senate confirmed him 51-49 along party lines last week. Warsh inherits a committee that voted 8-4 at the April meeting to hold the funds rate at 3.50%–3.75% — the most dissents at a single FOMC meeting since October 1992. Two governors voted to cut, two regional bank presidents voted to hike. The center is fragmenting precisely as headline CPI runs at 3.3% and oil-driven goods inflation is now a tailwind to the disinflation story.
Fed funds futures are now pricing in 23 bps of cuts by year-end, down from 38 bps a week ago, and a non-trivial 18% probability of a hike at the September meeting. Warsh has hinted in interviews that he believes the Fed's neutral rate is structurally higher than the 2.875% dot-plot median, which would make the current stance "barely restrictive" in his framing. The yield curve continues to defy expectations — the 2s10s spread sits at +50 bps, the steepest since 2022, and the 30-year is now anchored above 5% on term-premium reset rather than growth optimism.
What to watch next: Warsh's confirmation testimony Q&A from last week is being parsed for clues; SF Fed's Mary Daly speaks tonight at 7:30 ET — she dissented dovishly in April. Any softening in her tone would be the first hint that the dissenters are isolated, not a swing bloc.
Disney's Streaming Inflection — and the Bull Case for Linear
Disney shares closed up 7.8% Tuesday after fiscal Q2 results showed direct-to-consumer operating income of $315 million, beating consensus of $145 million, and Parks & Experiences operating income up 11% year-on-year to $2.3 billion. The streaming bull case has finally arrived in the P&L: Disney+ added 4.1 million net subscribers (consensus 1.8 million) and ARPU expanded 6% on price increases that did not provoke the churn many feared. Bob Iger upped FY26 EPS guidance to "high-teens growth" from "double-digit growth."
The non-obvious takeaway is the linear-TV commentary. Disney guided to traditional networks operating income down only 7% this year — a meaningful walk-back from prior "down 15-20%" framing. If linear cash flow is more resilient than feared, the strategic optionality on a Hulu Live or ESPN spin transaction increases. Watch for catalyst dates: ESPN Bet integration (June), the Hulu/Disney+ unified app (Q3 FY26), and renewed M&A chatter around YouTube TV partnership.
Sector pin-action: Netflix down 1.4% after-hours on a sympathy-trade reversal; Comcast +0.8% as the linear-isn't-dead narrative supports cable; Live Nation +2.1% on parks-demand readthrough.
China's Tepid Stimulus, Property's Slow Burn
Beijing released the long-awaited Politburo readout overnight: a 100bp RRR cut signaled, a 30bp policy-rate cut to follow, and a CNY 2 trillion (USD 280bn) special bond issuance for local government infrastructure. Markets had been hoping for property-specific demand-side stimulus and didn't get it — Hang Seng Mainland Properties Index opened up 4% but faded to +1.2% by the close. New home prices in 70 cities fell 0.4% month-on-month in April, the 22nd consecutive decline.
The macro implication is that China's policy stance is incremental, not aggressive. That has two cross-asset consequences: first, the renminbi can stabilize but won't strengthen materially (USD/CNY +0.3% lower today is a function of dollar weakness, not yuan strength); second, copper and iron ore are likely to remain rangebound until a credible property-demand package emerges. Copper's modest +0.7% today is the right tell — global growth proxy, capped by China caution.
What to watch next: Caixin Services PMI Friday (consensus 51.0, prior 51.4); China April export data Sunday — front-loading ahead of the August 1 "reciprocal tariff" deadline could distort prints in both directions.
Credit Markets Whisper That The Risk Rally Is Real
The investment-grade CDX index tightened 4 bps to 52, the lowest since February, and high-yield CDX is in another 18 bps to 318 — well below the 400+ panic levels of late March. The HYG ETF is showing fund inflows for an 11th consecutive session, the longest streak since November 2023. Beneath the index level, the dispersion is fascinating: energy high-yield names are tighter by 35 bps as oil collapses (counterintuitive, but driven by improved refining margins and demand confidence), while CCC-rated retailers are still 80 bps wider than year-end as consumer-credit data softens.
Loan-only issuers are in the sweet spot. The leveraged loan index is yielding 8.7% versus 7.2% for HY bonds, with default rates by issuer count holding at 1.8% — meaningfully below the 2.5% cycle peak from last September. Dispersion in HY between BB and CCC is at 425 bps, near the wide end of the 5-year range. That is opportunity for bottom-up credit pickers and a warning sign for index-level passive exposure.
What to watch next: Tomorrow's $2.5bn LBO financing for Astrana Health from KKR — pricing will tell us where new-issue demand really is. A coupon below 8.5% would signal credit froth; above 9.25% would suggest the index is running ahead of the underlying.
4. Macro & Fed Watch
The April CPI print at 3.3% — the highest since May 2024 — was the report that hardened the dissent at the Fed. Core CPI is running at 3.5%, with super-core (services ex-housing) at 4.1%. The energy contribution to headline has been roughly +60 bps over the past three months; if today's oil collapse holds for two weeks, the May CPI could mechanically print 30-50 bps lower than otherwise. That is the single most important fundamental shift markets are pricing this morning, even more so than the geopolitical headline. A May CPI handle in the high-2s would meaningfully change the Fed's path.
Fed funds futures pricing as of 8:00 AM ET: zero probability of a cut at the May 28-29 meeting (no live meeting), 14% at June, 35% at July, 62% at September, with 23 bps total cuts priced by year-end. The September meeting still carries an 18% hike probability — a barbell market that won't resolve until Warsh sets the tone in his first FOMC press conference June 11. Daly's remarks tonight will be the first chance to read whether the dovish dissenters from April are isolated or whether more committee members are leaning their way.
The yield curve is communicating something interesting. The 2s10s steepened 6 bps yesterday to +50 bps, the steepest since June 2022. But the steepening is bear-driven at the long end (term premium reset) rather than bull-driven at the front end (rate-cut expectations). The 30Y minus 10Y spread is 61 bps, the widest of the cycle. Translation: the curve is pricing more inflation persistence and a higher fiscal premium, not more growth. With 10Y real yields at 2.05% and 30Y reals at 2.45%, the long end is one of the highest real yields in the developed world. A successful 10Y auction at 1:00 ET today would mute the deficit anxiety; a tail of more than 1.5 bps would feed it.
Inflation breakevens: 5Y at 2.62%, 10Y at 2.42%, 5Y5Y forward at 2.22%. The market is pricing the geopolitical premium out of the front-end breakevens (5Y down 8 bps yesterday) but holding the 5Y5Y firm — a textbook "transitory" pattern. Whether it stays that way depends on Iran follow-through and tomorrow's Atlanta Fed wage growth tracker.
5. Economic Calendar — Today
Time (ET)
Indicator
Prior
Consensus
Why It Matters
7:00 AM
MBA Mortgage Applications (w/e May 1)
−4.2%
—
Reads consumer rate sensitivity as 30Y mortgage hovers near 7.10%.
8:15 AM
ADP Private Payrolls (Apr)
+155k
+125k
Read-through to Friday's BLS jobs report; weakness shifts the cuts narrative.
8:30 AM
Nonfarm Productivity Q1 (prelim)
+1.5%
+0.8%
Productivity is the disinflation safety valve — soft prints fan unit-cost worries.
8:30 AM
Unit Labor Costs Q1 (prelim)
+2.2%
+2.6%
Wage-price feedback; relevant given sticky core-services CPI.
10:00 AM
Wholesale Inventories (Mar f)
+0.5%
+0.5%
Inventory cycle indicator; revisions feed Q1 GDP tracking.
10:30 AM
EIA Weekly Crude Stocks
+3.8 mb
+1.2 mb
Today's number is overshadowed by Iran headlines, but builds keep the tape soft.
1:00 PM
10-Yr Treasury Auction ($42bn)
—
—
First test of demand at the long end after the 30Y crossed 5%.
3:00 PM
Consumer Credit (Mar)
+$9.6bn
+$11.0bn
Revolving credit growth flags whether the consumer is bending or breaking.
7:30 PM
Fed's Daly speaks (SF Fed)
—
—
First voter to speak since the 8-4 split April meeting; a hawkish pivot would sting.
6. Earnings Watch
With 78% of the S&P 500 having reported, blended Q1 earnings growth stands at +13.4% year-on-year (FactSet) — the best print since Q3 2021. Of those 391 companies, 79% have beaten on EPS and 68% on revenue, both above 5-year averages. The pattern is being set in tech (28% earnings growth on the AI capex narrative, partial pull-forward) and consumer cyclicals (above-trend), with industrials and materials lagging.
Today's marquee reports break in two waves. Pre-market: McKesson (MCK) is expected at $7.74 EPS / $86.0bn revenue with focus on the GLP-1 distribution flywheel and the Cencora-versus-McKesson PBM narrative; Marriott International (MAR) at $2.45 / $6.4bn, with RevPAR commentary the swing factor and options pricing a 5.4% move; CVS Health (CVS) at $1.85 / $94.5bn, where the Aetna MLR (medical loss ratio) is the entire story — a print above 89% would crater shares; Vistra Energy (VST) at $0.78 / $4.4bn as the data-center power thesis gets its first quarterly stress test post-Talen-Amazon clarification; New York Times (NYT) at $0.43 / $618m, with subscription bundle ARPU as the focus.
After the close: Robinhood (HOOD) at $0.34 / $670m — every analyst is modeling crypto trading volumes (BTC at $82K helps), interest income on customer cash is rate-sensitive, and the Bitstamp acquisition close timing is the qualitative read; Occidental Petroleum (OXY) at $0.82 / $7.1bn — Buffett's stake gets a fresh vintage, and Permian breakevens at sub-$50 WTI are the question if oil holds the lower range; Coupang (CPNG) at $0.07 / $7.2bn for Korean e-commerce read-through; AppLovin (APP) at $1.92 / $1.4bn for the AdTech-AI bull case continuation; Klaviyo (KVYO) at $0.16 / $250m for SMB e-commerce health.
Options-implied moves at the open (priced from at-the-money straddles): MCK 4.2%, MAR 5.4%, CVS 7.8%, VST 8.6%, HOOD 9.2%, OXY 4.5%, APP 11.0%. The CVS implied is notable — well above its 8-quarter trailing average of 5.1%, a sign the market is bracing for a guidance reset on MLR.
7. Sector Spotlight
Energy: A Tale of Two Tape Reactions
With WTI down nearly 7%, the textbook play is "sell energy." The tape isn't reading from the textbook. The S&P 500 Energy sector closed up 0.46% Tuesday despite a 4% intraday drop in crude, and is indicated up another 0.3% in pre-market. Three reasons: refiners (XOM downstream, MPC, VLO) are seeing crack spreads widen 18% on the prospect of a Hormuz reopen; integrateds with downstream optionality outperform on lower input costs; and the relative value trade — energy YTD beta to oil has been only 0.4, suggesting positioning has been so bearish that supply-news pressure is muted.
The cleaner expression of the de-escalation theme is short oil-services (OIH) and long airlines (JETS). The latter is up 3.8% pre-market with DAL leading at +5.1% — a $10 sustained drop in WTI is roughly $1.20 of incremental EPS for major carriers. If the Iran framework holds, JETS-versus-XLE is the structural pair trade for the next 30 days.
Semis: AMD's Ripple, Memory's Steepening Curve
Beyond the AMD narrative, the deeper sector dynamic is the memory rebound that's been quietly underway. Samsung's preliminary Q1 print last week showed HBM3E shipments up 4x quarter-over-quarter, and Micron (MU) is expected to follow the same pattern when it reports June 18. Seagate's upgrade to OW today on the back of nearline pricing power for AI training-data tiers reflects a broader thesis: the AI capex cycle is migrating from compute to memory and storage. SOX is up 4% over five sessions, but breadth is finally widening — only 3 of the 30 components are negative for the week, the broadest participation since November.
8. Analyst Calls & Upgrades/Downgrades
Firm
Ticker
Action
New PT
Rationale
Goldman Sachs
AMD
Upgrade Neutral → Buy
$450 (from $240)
MI300X ramp and hyperscaler bookings re-rated post-Q1; AI accelerator share gains.
HSBC
AMD
Downgrade Buy → Hold
$340 (from $335)
Valuation full after 16% one-day move; awaiting next data-center proof point.
Barclays
STX
Upgrade EW → OW
$625 (from $425)
HDD nearline pricing power; AI training data stack tailwind through 2027.
Barclays
SWKS
Upgrade EW → OW
$70 (from $60)
iPhone content recovery and content gains in non-Apple smartphones.
Barclays
QRVO
Upgrade EW → OW
$100 (from $95)
Diversification away from handset cyclicality showing in defense and IoT mix.
Wells Fargo
BIIB
Upgrade EW → OW
$250 (from $200)
Leqembi adoption inflection; pipeline optionality on tau and ALS.
Wells Fargo
NXPI
Downgrade OW → EW
$235 (from $265)
Auto-MCU inventory glut into 2H; China EV pricing pressure.
Morgan Stanley
UBER
OW reiterated
$110 (from $96)
Mobility take-rates and ad business support a re-rating to growth multiple.
JPMorgan
DIS
OW reiterated
$135 (from $122)
DTC profitability inflection; parks demand resilient despite consumer wobble.
9. Stocks to Watch
AMD — Whose Price Target Wins?
AMD opened the week with a $145 implied price-target range — Goldman's $450 versus HSBC's $340 is a 32% spread that won't close quickly. Watch the $185 level today: it was the post-earnings extended-hours peak Tuesday and the line from there to $200 is where mechanical CTA buying gets activated. The 14-day RSI is at 78 — overbought, but not the 84 reading at January's peak. Options chain shows June $200 calls at 4.2x normal volume; the smart money is pricing a MI400 unveiling at Computex (June 4).
Apple (AAPL) — The Iran Dividend Trade
Apple is up 0.9% pre-market, but the better setup is the supply-chain readthrough: with Iran tensions abating, the iPhone 17 production schedule that was tweaked in mid-April to add Vietnam capacity for hedging may revert to the original Foxconn India ramp, lifting unit assumptions. Foxconn is up 2.8% in Taipei. Apple options expiring May 16 show $215 calls bid up — a $215 print would close the gap from the April 28 earnings reaction and put $225 in play before WWDC.
Vistra Energy (VST) — AI Power Trade Tested
Vistra reports pre-market with options pricing an 8.6% move — the highest implied of the day among data-center power names. The dispute is binary: bulls see Comanche Peak's expansion potential and the recently-closed PJM capacity auction at $269.92/MW-day as a free-cash-flow tailwind. Bears point to FERC's pending review of the Talen-Amazon "behind-the-meter" arrangement — a similar structure VST is pursuing — and warn that the data-center premium baked into the stock evaporates if the PJM tariff framework shifts. Watch for the PRA results commentary on the call. $130 is the support level; below $122 confirms a breakdown.
CVS Health (CVS) — The Aetna MLR Cliff
Pre-market reports for CVS, where the issue is whether the Aetna medical-loss ratio comes in at the guided 89.4% or higher. Last quarter's 90.4% sparked a one-day 12% drop. Consensus is 89.0% — a print above 90% triggers a guidance cut and likely re-tests the $52 March low. Conversely, 88% or better could trigger a 10%+ rally as short interest stands at 4.5% of float, the highest since the Sherrod Brown HHS hearings. The 200-day moving average at $61 is the upside marker; $62.50 is where a real reversal trade would form.
10. Global Macro Snapshot
China: Politburo readout was incrementalist — markets wanted a property-demand bazooka and got infrastructure. The PBoC is now expected to deliver a 30bp policy-rate cut at the May LPR fixing on May 20, with a 100bp RRR cut sequenced ahead of it. Hang Seng tech +2.1% today on the read-through, but mainland CSI 300 was flat — divergence telling of where international versus domestic positioning sits.
Eurozone: Final April services PMI tomorrow expected to confirm 52.4 (above 50, expansionary), but services inflation in the print is 4.0% — sticky. The ECB is now firmly in "meeting-by-meeting" mode after the surprise hold last week, with markets pricing only one more 25bp cut by year-end. EUR/USD breaking 1.15 today is dollar-driven, not euro-positive — German Bund yields are essentially unchanged at 2.51%.
Japan: USD/JPY off 1.4% to 156.4 — biggest single-day drop since October. The MOF intervention thresholds have been reset, but verbal jawboning from Vice Finance Minister Mimura overnight had market-moving force. BoJ's June 17 meeting is back in play for a 25bp hike to 0.75%; OIS-implied probability has jumped to 55% from 22% a week ago.
Emerging markets: MSCI EM is up 1.9% today, the biggest single-day move since January, led by Korea (Kospi +1.4%) and Brazil futures (+1.1%) on commodity dynamics. Turkey is the standout positive, with the lira strengthening 0.8% and BIST 100 up 2.4% as foreign-currency reserves crossed $150bn for the first time post-currency crisis. The carry trade is back.
11. Week Ahead Preview
Today (Wed): ADP at 8:15 ET, EIA crude at 10:30, 10-year Treasury auction at 1:00, Daly speech at 7:30 PM. Pre-market earnings from McKesson, Marriott, CVS, Vistra; after-close from Robinhood, Occidental, AppLovin.
Thursday: Initial jobless claims (consensus 222k); Q1 productivity revision; Fed's Williams (NY Fed) speaks at 9:30 AM ET — important first read of the swing voter; Boeing pre-market with focus on 737 MAX delivery cadence and 777-9 certification timing. Earnings also from Toyota, BT Group, AB InBev, ConocoPhillips.
Friday: April nonfarm payrolls is the marquee — consensus +175k jobs, unemployment 4.1%, average hourly earnings +0.2%. Whisper number is +130k after weak ADP risk; the dollar will swing 50+ bps either way. Also: April CPI is delayed to May 14 (BLS schedule), but PPI Friday will set inflation tone. Chinese trade data Sunday.
Beyond this week: NVDA earnings May 28 (the AI bellwether); Warsh sworn in May 15; G7 finance ministers meet May 22-23 in Banff (FX coordination chatter); FOMC June 11; ECB June 5; BoJ June 17; OPEC+ June 1.
12. Closing Thought
The conventional wisdom this morning is that lower oil plus a peace dividend equals more risk-on. The contrarian read is that this is precisely when financial conditions ease enough to keep inflation from descending the last mile — and the Fed loses optionality just as Warsh takes the chair. The May 2026 setup is reminiscent in structure to early 1996: a sticky-3% inflation print, a tight labor market, an asset-price boom led by transformative technology, and a central bank with clear hawks and dovish dissenters fighting over the steady-state real rate. That cycle ended with two more years of equity gains and a stealth acceleration in inflation that the Fed had to chase from 1999 onward.
If the Iran peace holds, the cleanest beneficiaries are the unhedged consumer-discretionary names with energy-cost sensitivity (airlines, package delivery, retailers with sub-30% gross margins), the leveraged loan complex, and EM credit. The cleanest underperformers are nominal Treasuries — a peace dividend without a fiscal dividend is the worst combination for the long bond. The risk the market is underpricing is not that Iran reneges; it's that the inflation glide path stalls on the very dovishness the dis-escalation enables. Watch the 5Y5Y forward break-even. If it breaches 2.30%, the trade isn't risk-on — it's bonds-down.
As one strategist put it last night: "The peace dividend is real. The question is whether anyone hedges against the peace."
— END —
This brief is informational and does not constitute investment advice. Data as of approximately 9:30 AM ET, May 6, 2026. Sources include public market data feeds, S&P/FactSet, Treasury Department H.15, EIA, CME, Cboe, and reporting by CNBC, Bloomberg, Reuters, and the Wall Street Journal.
DAILY FINANCIAL BRIEF
Tuesday, May 5, 2026 • Pre-Market Edition • Prepared for James Flanagan
Markets, macro, and the stories that will drive the tape today.
1. The Morning Setup
Wall Street walks into Tuesday holding its breath. After Monday's risk-off shudder — when the S&P 500 slipped 0.41% off Friday's record close as Iran struck a UAE oil port and the U.S. Navy began "Project Freedom" to force open the Strait of Hormuz — futures point to a tentative bid: S&P 500 e-minis +0.30%, Nasdaq 100 +0.40%, Dow +0.20% as of 7:30 a.m. ET. The reason is simple: oil, the day's master variable, is flushing lower. Brent has retraced more than 2.5% to $111.45 and WTI is back below $103, with the ceasefire technically intact and two U.S.-flagged tankers having transited Hormuz overnight. That is the proximate good news. The quieter, more important news is structural: the 10-year Treasury yield, at 4.46%, is now at its highest since July 2025, the curve is bear-steepening, and Fed funds futures are pricing virtually no chance of a June cut and under 10% odds of any cut in 2026. Translation: this is no longer a market that runs on cheap liquidity. It runs on earnings and energy. Today brings both — Pfizer pre-bell, AMD and Ferrari post-close, plus April ISM Services and JOLTS at 10 a.m. — against a backdrop where every barrel of crude and every basis point of yield matters more than usual.
2. Markets at a Glance
All levels as of approximately 7:30 a.m. ET. Color denotes direction vs. prior close (green = up, red = down). Asia/Pacific data reflects today's regional close; Japan and mainland China on holiday.
Asset
Level
Change
Context
US EQUITY FUTURES
S&P 500 (E-mini)
7,260
+0.30%
Rebound after Mon. dip
Nasdaq 100
25,360
+0.40%
Tech leads on AI optimism
Dow Jones
49,290
+0.20%
Defensives steady
Russell 2000
2,365
+0.15%
Small caps lag mega cap
PRIOR US CLOSE (MON)
S&P 500
7,200.75
−0.41%
Pulled back from record on oil spike
Nasdaq Composite
25,066
−0.55%
Mega-cap tech took the hit
Dow Industrials
49,034
−0.32%
Energy outperformed
ASIA CLOSE (TUE)
Nikkei 225 (Japan)
59,513
Closed
Public holiday — May 5 (Children's Day)
Hang Seng (Hong Kong)
23,820
+0.85%
Tech rally extends; AI names lead
Shanghai Composite
3,498
Closed
China Labor Day holiday week
Kospi (Korea)
6,961
+0.36%
Memory chips bid ahead of AMD print
ASX 200 (Australia)
8,540
+0.45%
Energy leads on prior crude surge
EUROPE EARLY TRADE (TUE)
FTSE 100 (UK)
8,985
+0.05%
Flat — defensives cushion
DAX (Germany)
23,440
−0.40%
Cyclicals lag on Iran headlines
CAC 40 (France)
8,210
−0.40%
Luxury & autos under pressure
Euro Stoxx 50
5,495
−0.30%
Bank earnings mixed
VOLATILITY
VIX
17.6
−4%
Off Mon. spike but elevated vs. April
US TREASURY YIELDS
2-Year
3.92%
−2 bp
Front end steady; Fed on hold
5-Year
4.18%
−1 bp
Belly anchored
10-Year
4.456%
−1 bp
Highest since July 2025 — oil/inflation premium
30-Year
4.83%
Flat
Term premium creeping wider
FX
DXY (Dollar Index)
98.5
−0.10%
Off safe-haven bid; range-bound
EUR/USD
1.0915
+0.20%
ECB rate path narrows divergence
GBP/USD
1.2870
+0.15%
BoE patience priced in
USD/JPY
152.40
−0.30%
Yen firmer on lower yields
USD/CNY
7.225
Flat
PBoC fix steady; markets shut
ENERGY
Brent Crude
$111.45
−2.6%
Off Mon. high as ceasefire holds
WTI Crude
$102.65
−3.1%
10–12 mbpd still off market via Hormuz
Natural Gas (NYMEX)
$3.92
−1.4%
Mild weather; LNG demand firm
METALS
Gold (spot)
$4,560.75
+0.83%
Real yields ease; record territory
Silver (spot)
$73.10
−0.5%
Down ~22% from war-start, lagging gold
Copper (LME, $/t)
$10,420
+0.4%
Holding $10k floor on China hopes
CRYPTO
Bitcoin
$80,921
+3.0%
First $81k print since January
Ethereum
$2,374
+2.2%
Risk-on rotation into alts
3. Top Stories
PROJECT FREEDOM: TWO TANKERS THROUGH, BUT THE TRUCE IS WOBBLING
The four-week U.S.–Iran ceasefire is now functionally on probation. Late Monday, the United Arab Emirates — the Gulf's most important U.S. ally — said its air defenses engaged 15 missiles and four drones launched from Iran. One drone slipped through and ignited a fire at an oil facility in Fujairah, wounding three workers. Tehran also struck a South Korean–operated tanker anchored off the UAE and damaged an empty ADNOC crude carrier transiting the strait. In response, the U.S. Navy announced it had sunk six small Iranian craft and escorted two American-flagged merchant ships through the chokepoint — the opening salvos of President Trump's "Project Freedom" mission to reopen Hormuz.
The mechanics matter. Roughly 10–12 million barrels per day of crude — about 20% of seaborne supply — normally flow through Hormuz. Yesterday, only four ships crossed. Even if the ceasefire holds, insurance premiums for Gulf transits have effectively reset higher. Brent's pullback today is real but partial; the curve is still in steep backwardation, signaling tight prompt supply. Risk-managers are not buying that this is over.
Market implication. Watch Brent $115. A break would put a $5–7 reflation premium back into headline CPI, complicate the Fed's already narrow path to a 2026 cut, and pressure the long end. The S&P energy sector is up roughly 11% over four weeks; airlines, chemicals, and consumer discretionary names are the natural counter-trade if oil stays elevated.
PALANTIR CRUSHES Q1 — AND THE AI CAPEX TRADE GETS A SECOND WIND
After Monday's bell, Palantir reported a result that even its most aggressive bulls would have struggled to model. Q1 revenue rose 85% year-on-year to $1.63 billion, U.S. revenue grew 104% (its first triple-digit print), and U.S. commercial revenue jumped 133% to $595 million. Adjusted EPS of $0.33 beat the $0.28 consensus by 18%, and adjusted operating margin came in at a remarkable 60%. Management didn't just raise the year — they bulldozed it: full-year revenue guidance now sits at $7.66 billion (+71% YoY) versus the prior $6.85 billion midpoint, and U.S. commercial revenue is now expected to grow at least 120%.
The stock barely moved after-hours, closing the session flat near $147 — a tell that says more about positioning than fundamentals. Palantir entered the print up 38% YTD; expectations were vertical. But the read-through is what matters for today's tape: enterprise AI deployment is not just real, it is accelerating, and the customers signing $25 million-plus deals are not Silicon Valley peers — they are industrials, utilities, and Fortune 500 supply-chain operators.
What to watch next. AMD reports tonight at 4 p.m. ET, with the read on MI400 datacenter accelerator demand the single most important AI signal of the week. Nvidia (which reports later this month) trades up in sympathy. The losers if AMD also blows out: passive owners of "AI-adjacent" names — utilities, networking, cooling — that may finally see capex dollars rotate to the actual chip vendors.
TREASURY YIELDS AT TEN-MONTH HIGHS AS THE BOND MARKET REPRICES INFLATION
The 10-year yield touched 4.46% Monday — its highest level since July 2025 — and the 30-year is testing 4.85%. That is not a Fed-cut market; that is a market that thinks the Fed's 3.50–3.75% range is roughly the floor for 2026. The drivers are layered: a sticky core PCE that the March SEP marked up by 30 bp to 2.7%, a healthcare-and-shelter-led services inflation that the Fed has openly called "the unfinished part of the disinflation," and now an energy shock layered on top. Add a heavy Treasury supply calendar — today's $58 billion 3-year auction kicks off refunding week — and you have all the ingredients for a continued bear steepener.
Cross-asset implications. The dollar's softness today (DXY 98.5, off Monday's safe-haven pop) is being driven by EUR/USD strength as the ECB looks more hawkish at the margin. But if 10-year yields break decisively above 4.50% — a level that has capped them three times in the past six months — expect a renewed dollar bid, fresh pressure on long-duration tech, and a re-test of the recent highs in real yields, which would be the bigger problem for gold's $4,560 print.
BITCOIN PUNCHES THROUGH $80,000 — RISK APPETITE IS STRANGER THAN IT LOOKS
Bitcoin traded as high as $81,200 overnight, its first $81k handle since January and a 5.2% gain over five days. Ether followed to $2,374. The narrative is being framed as a "risk-on rotation" — and superficially, it is. But the more interesting fact is that Bitcoin is rallying alongside a 10-year yield at ten-month highs, gold at all-time highs, and oil with a Middle Eastern war premium. That is not a clean macro story; that is investors bidding multiple unrelated stores of value at once. It is a hedge-everything tape.
What it signals. Three things. First, fiscal-deficit anxiety is back as a thematic — the U.S. is running near 6% of GDP deficits with full employment. Second, ETF flows have re-accelerated; spot BTC ETFs took in roughly $1.1 billion last week. Third, the trade is becoming uncorrelated to equities at the margin — BTC is up ~7% over a stretch where the S&P 500 is roughly flat, a divergence not seen since Q4 2024. Watch $84k as the next resistance and $76k as the level below which the technical thesis breaks.
APPLE'S QUIET KILLER QUARTER IS RESHAPING THE MEGA-CAP PECKING ORDER
Apple reported last Thursday and the dust has now settled. The numbers were extraordinary — EPS of $2.01 vs. $1.96 expected, revenue of $111.2 billion vs. $109.7 billion, iPhone revenue up 22% year-on-year, and a record March quarter for upgrades. Tim Cook called the iPhone 17 lineup "the most popular in our history." Capex guidance is rising — partly because of the surprise Google Gemini partnership announced last quarter, which puts Gemini behind Siri and signals Apple is finally treating AI as a multi-year capex cycle rather than a feature war.
The stock is up roughly 9% since the print, trading near $282. Wedbush moved its target to $310. The bigger story: Apple's valuation premium over Microsoft has now widened to its biggest gap since 2022, and Apple has contributed positive percentage points to the S&P 500's YTD return while Microsoft has subtracted nearly a full point. The mega-cap leadership baton has visibly switched.
TODAY'S DATA: ISM SERVICES AND JOLTS — BOTH SIGNAL WHETHER THE CYCLE IS ENDING OR INFLECTING
The ISM Services PMI at 10 a.m. ET is consensus 53.7 vs. 54.0 prior. That would be the 22nd consecutive month of expansion but the third straight monthly slip. The sub-indices matter more than the headline: prices-paid above 60 would be a problem given energy prices, while a sub-50 employment print would put a renewed bid in the long end. JOLTS, also at 10 a.m., is expected at 8.25 million openings versus 8.40 million prior. Quits-rate is the single most important number — anything below 2.0% would mark a clear labor-market softening signal.
Why both at once matter. Friday's nonfarm payrolls is the week's hinge. Today's pair calibrates expectations. A hot ISM and steady JOLTS push 10-year yields toward 4.55% and put a December cut firmly off the table; a soft pair revives Q3 cut hopes and puts a bid in growth equities. The short-term S&P 500 implied move on the data combination is around 0.6%, per options pricing.
4. Macro & Fed Watch
The Federal Reserve held the funds rate at 3.50–3.75% at last week's April 29 meeting in what Chair Jerome Powell described as "a meeting where the bar for action remains high." The 8–4 vote was the most fractured FOMC since October 1992, with two governors dissenting in favor of a 25 bp cut and two regional bank presidents dissenting toward a hike. That kind of dispersion is itself a market signal: the committee no longer agrees on which side of neutral the funds rate sits, and that ambiguity is being priced into the term premium.
Fed funds futures now imply a 7% probability of a June cut, 22% by September, and a roughly 35% chance of any cut in calendar 2026. Compare that to the December 2025 dot plot, which penciled in two cuts for this year. The market has effectively unwound those cuts. Drivers: the March SEP raised year-end 2026 PCE inflation to 2.7% from 2.4%, real GDP to 2.4% from 2.3%, and unemployment was held at 4.2%. The committee is, in plain English, acknowledging that the disinflation has stalled and the labor market is not loosening fast enough to deliver the soft landing they had been counting on.
Today's calendar features two voters — New York Fed President John Williams at lunch and San Francisco Fed President Mary Daly this evening. Williams is the one to watch. As permanent voter and Powell's intellectual partner on r-star analysis, anything from him on neutral-rate revisions, balance-sheet runoff (still proceeding at $25 billion/month for Treasuries), or the Fed's tolerance for a one-time energy-shock CPI passthrough would move the curve. Daly leans dovish but has been notably quieter since March.
Yield curve dynamics. The 2s10s curve sits at +54 bp, the steepest since November 2023. That is a classic late-cycle bear-steepener — the front end held by Fed patience, the long end repricing inflation and supply. Historically, sustained 2s10s steepening from this level has preceded recessions by 6–14 months. It is not a prediction; it is a regime.
5. Economic Calendar — Today
Time (ET)
Indicator
Prior
Consensus
Why It Matters
8:30
Advance Goods Trade Balance (Mar)
−$147.0B
−$140.0B
Read on tariff-era flows; tracks net exports for Q1 GDP revision.
8:30
Wholesale Inventories (Mar, prelim)
+0.3%
+0.2%
Inventory build feeds into GDP; watch for goods-economy re-stocking.
10:00
ISM Services PMI (Apr)
54.0
53.7
Largest part of US economy. New-orders and prices-paid sub-indices shape Fed thinking.
10:00
S&P Global Services PMI (Apr, final)
52.6
52.7
Cross-check on ISM; private-sector services momentum.
10:00
JOLTS Job Openings (Mar)
8.40M
8.25M
Quits and openings vital labor-tightness gauge with NFP looming Friday.
Lunch keynote on financial stability; could signal cut posture.
—
Fed Speaker — Daly (SF Fed)
—
—
Evening remarks; voter, leans cautiously dovish.
6. Earnings Watch
Today is the heaviest single day of the week for marquee reports. Pre-bell, Pfizer (PFE) headlines health care; after the close, AMD and Ferrari deliver the chip and luxury-cycle reads, respectively. Across the S&P 500, Q1 2026 has been the strongest earnings season in two years: with roughly 65% of the index reported, blended EPS growth is tracking +14.6% year-on-year, beating the +10.7% pre-season expectation, and the beat-rate stands at 81% — well above the five-year average of 77%. Margin expansion is the surprising contributor; revenue beats are running closer to 64%, indicating that operational leverage and AI productivity gains are doing the heavy lifting.
PFIZER (PFE) — PRE-MARKET
Consensus: EPS $0.72, revenue $13.84 billion. Last quarter beat: $0.75 EPS on $14.5 billion revenue. The Street is focused on three items: (1) Vyndaqel and Eliquis franchise momentum into the patent cliff that begins in 2027; (2) updated obesity-pipeline timeline after the recent Phase 2 readout for danuglipron-2; and (3) FY 2026 guidance — last quarter's $61–64 billion range now looks low if oncology growth holds. Options imply a ±5.2% move.
Consensus: EPS $1.29 (+34% YoY), revenue $9.89 billion (+33% YoY). The single most important enterprise-AI report of the quarter outside Nvidia. Investors will want to hear: (1) MI400 production ramp and customer mix — Microsoft, Meta and Oracle are the disclosed anchor buyers; (2) datacenter segment guidance for Q2, where consensus sits at $4.6 billion; (3) any commentary on Hopper-to-Blackwell-to-MI400 cycle timing; and (4) the embedded segment, which has been the drag on results all year. Options imply a ±8.4% move — among the highest of the quarter.
FERRARI (RACE) — AFTER-CLOSE
Consensus: EPS €2.04, revenue €1.78 billion. The cleanest read on the global luxury cycle and high-net-worth consumer. Watch for: order book duration (last reported "comfortably into 2027"), F80 hypercar revenue contribution, and China commentary — Ferrari has been resilient where Hermès, LVMH and Richemont have wobbled. A miss here would be the cleanest signal yet that the luxury slowdown is broadening to the very top of the cohort. Options imply ±4.1%.
TOMORROW PRE-BELL: WALT DISNEY (DIS)
Consensus: EPS $1.41, revenue $23.6 billion. Streaming profitability and parks margin are the two pillars; the ESPN flagship streaming launch slated for fall 2026 will get its first detailed monetization commentary. Setup is delicate — DIS shares are flat YTD against an S&P up 7.5%.
7. Sector Spotlight
ENERGY: UP 11% IN FOUR WEEKS, NOW THE QUESTION IS WHAT'S PRICED IN
The S&P 500 energy sector has been the cleanest beneficiary of the Iran shock, up roughly 11% over four weeks versus the index's 1.2% gain. Exxon, Chevron and ConocoPhillips are now trading at multi-year highs, but valuation has caught up: the sector trades at 13.2x forward earnings vs. the 10-year average of 12.5x. The implied oil price embedded in equities is roughly $98 Brent — well below today's $111 spot but above the $85 strip a month ago. That is a market that believes the geopolitical premium sticks but does not extend. If Hormuz transit volumes recover this week, expect rotation out of integrateds back into refiners (which benefit from crack-spread normalization) and select midstream MLPs.
SEMICONDUCTORS: ALL EYES ON AMD, BUT THE REAL ACTION IS BENEATH THE SURFACE
The Philadelphia Semiconductor Index (SOX) is up 4.8% over five sessions, but the dispersion inside is extreme: Nvidia +6.1%, AMD +9.4%, Broadcom +5.0% — and on the other end, Intel −2.3%, Marvell −1.1%. That bifurcation tells you the AI-leverage trade is sharpening, not broadening. Memory names — Micron, SK Hynix, Samsung — are the underpriced corner; HBM3e demand is sold out into 2027 and pricing is firm. If AMD prints in line and guides hot tonight, expect the rotation into memory to accelerate Wednesday.
8. Analyst Calls & Upgrades / Downgrades
Firm
Stock
Action
Target
Rationale
Freedom Broker
Biogen (BIIB)
Upgrade — Buy
$245 (from $185)
Pipeline catalysts and re-rating on sustained Leqembi adoption.
RBC Capital
Ford Motor (F)
Maintain — Sector Perform
$13 (from $11)
Margin recovery into 2H; tariff pass-through better than feared.
Piper Sandler
Community Fin. (CBU)
Maintain — Neutral
$66 (from $62)
Earnings power steady; deposit costs peaked.
Stifel
NFI Group (NFI)
Buy
C$25.50 (from $23)
Bus backlog at record; EV transit orders accelerating.
Morgan Stanley
Palantir (PLTR)
Maintain — Equal-Weight
$160
Beat & raise impressive but valuation already discounts perfection.
Wedbush
Apple (AAPL)
Maintain — Outperform
$310
iPhone 17 cycle and Gemini-Siri integration extend AI runway.
Citi
AMD
Buy (into print)
$210
MI400 datacenter ramp could drive upside surprise tonight.
JPMorgan
Pfizer (PFE)
Neutral
$32
Beat tempers patent-cliff overhang; guidance the swing factor.
9. Stocks to Watch
PALANTIR (PLTR) — $147
Open question: how does the stock react in a world where the print was a blowout and the pre-print stock was up 38% YTD? Watch the open. A strong open above $158 confirms the Q1 narrative trumps positioning; a sell-the-news fade to $138 is the technical equivalent of the Crowdstrike, Snowflake and ServiceNow patterns we've seen this year — beat-and-fade is the norm in 2026, not the exception. Implied volatility is elevated; the options market is pricing roughly 7% directional move today.
EXXON MOBIL (XOM) — $132
Up 13% in three weeks. The stock is no longer cheap on any conventional metric — 14x forward earnings, 4.2% free-cash-flow yield — but it remains the cleanest large-cap hedge against further Hormuz escalation. Watch the $128 level on a Brent pullback below $108 — that's the technical line where geopolitical premium begins coming out of the equity. A break of $135 on the upside opens $145, a level last seen in October 2022.
ADVANCED MICRO DEVICES (AMD) — $193
Reports tonight. The stock has rallied 14% off its mid-April low and is back inside the $170–$210 range that has contained it since February. Bull case for a print-driven breakout: MI400 datacenter revenue surprises by 10%+ and Q2 datacenter guide tops $5 billion. Bear case: any softness in PC client or embedded confirms the consumer-side slowdown narrative and pulls the stock back to $175. Options-implied move ±8.4% — sized to a real event.
WALMART (WMT) — $98
Quiet outperformer. Up 11% YTD as the consumer-resilience trade reasserts. Today's catalyst: ISM Services prices-paid sub-index. A hot reading (above 62) would confirm food-and-grocery pricing power and likely push the stock above $100 for the first time. Options activity has been notably bullish for a defensive name — call/put ratio at 1.8x, well above the 1.2x average.
10. Global Macro Snapshot
China is dark today — markets closed for the Labor Day holiday week — but the offshore yuan is steady at 7.225 and Hong Kong–listed mainland tech rallied 1.0% as Tencent and Alibaba caught a bid on AI capex headlines. The bigger China story is unfolding in commodities: copper holding $10,420/ton with reported State Reserve Bureau buying at $10,000 has put a floor under the metal that did not exist three months ago. If the SRB is accumulating at these levels, it is a soft signal that Beijing expects a stimulus push later this quarter.
Europe is wrestling with two crosswinds. Unicredit reported a record Q1 with net profit up 16% to €3.2 billion this morning, the 21st consecutive profitable quarter — a remarkable run for a bank that nearly went under in 2016. That's the bull case for European financials. The bear case sits in the periphery: Italian and Spanish 10-year spreads have widened roughly 8 bp this week as energy import costs rise. The DAX's underperformance today (−0.4%) is largely autos and chemicals, both energy-cost-sensitive. Watch Volkswagen and BASF for cleaner signals than the index level.
Emerging markets are bifurcated. Energy exporters (Brazil, Mexico, Saudi Arabia, Indonesia) have seen FX strength and equity inflows; importers (Turkey, India, South Africa) are under pressure. The dollar's stability has muted EM stress relative to past oil shocks, but if DXY breaks above 100, expect outflow pressure to reassert. The MSCI EM index is roughly flat YTD versus the S&P's +7.5% — the divergence is now ten percentage points and historically wide.
11. Week Ahead Preview
The rest of the week is loaded. Wednesday brings ADP private payrolls (consensus +145k), Disney pre-bell, Uber and Shopify before the open, and the FOMC's John Williams at the Economic Club of New York — the closest thing to formal Fed guidance this week. Thursday delivers initial jobless claims, productivity (always a sleeper market mover this cycle), and earnings from McDonald's, Eli Lilly, ConocoPhillips and Toyota. Friday is the headline event: April nonfarm payrolls — consensus +170k, unemployment 4.2%, average hourly earnings +0.3% MoM.
Geopolitically, the U.S. "Project Freedom" tanker convoys continue daily through Hormuz — each successful transit chips away at the geopolitical risk premium; each incident reasserts it. Markets will be tape-reading every shipping advisory. The G7 finance ministers meet in Banff, Alberta on Thursday and Friday, with the agenda dominated by coordinated SPR-release options and a U.S.-pushed package of secondary sanctions on Iranian oil buyers. China earnings season also picks up: Alibaba and Tencent both report next week and will set the tone for the H-share rally's durability.
12. Closing Thought
Here is the question worth sitting with: what if the consensus is wrong about the direction of the Fed's next move? The market is overwhelmingly priced for hold-then-cut. But the April FOMC had two hawkish dissents, oil is at $111, services inflation is sticky, and the 30-year yield is approaching a level that has historically required a Fed response. We do not need to forecast a hike to make money on this thesis — we only need to recognize that the distribution of outcomes around the funds rate is now wider than it has been at any point in this cycle. The asymmetric trade is not in equities or in crypto. It is in the front end of the curve, where two-year yields at 3.92% offer almost no compensation for the right tail. Risk is asymmetric when consensus is unanimous. It usually is.
As Stanley Druckenmiller said last week, in his first public interview since stepping back from Duquesne: "The biggest mistake of my career was assuming that a Fed that had been wrong for three years would be right in the fourth." Worth pinning above the trading desk. The bell rings in two hours.
Daily Financial Brief • Compiled from Reuters, CNBC, Bloomberg, Yahoo Finance, FRED, CME FedWatch, Trading Economics, and other public sources. Data is point-in-time and subject to revision.
This brief is for informational purposes only and is not investment advice. Verify all data and consult a licensed advisor before acting.
DAILY FINANCIAL BRIEF
Markets, macro, and what to make of it · WSJ-style morning briefing
Monday, May 4, 2026 · 9:30 AM EST
1. THE MORNING SETUP
Wall Street walks into May with the wind at its back — and a cliff in front. Friday's session sealed the S&P 500's seventh consecutive weekly gain, capping a 10% April rebound and dragging both the broad index and the Nasdaq Composite to record closes. Russell 2000 hit a new high of its own. Yet the cleanest read of risk this morning is not equity prices; it is the $11 spread between Brent and WTI, the $4.23-a-gallon pump price flashing on every American dashboard, and the unanswered question of whether Tehran reopens the Strait of Hormuz this week or doesn't.
Today is a quiet macro day by design — Monday's data slate is light, Fed speakers are dark heading into Friday's payrolls, and Tokyo and Shanghai are shut for holiday. That stillness is doing real work. It lets traders digest three live wires at once: Trump's weekend threat to lift EU auto tariffs to 25%, an Iran proposal sitting on the President's desk, and a Friday jobs print that consensus expects to land at +73,000 with unemployment steady at 4.3%. Index futures are up two-tenths on each, but the calm is rented, not owned.
2. MARKETS AT A GLANCE
Asset
Level
Change
% / Note
— US EQUITY FUTURES —
—
—
—
S&P 500 (ES)
7,247.50
+14.50
+0.20%
Nasdaq 100 (NQ)
26,485.25
+52.75
+0.20%
Dow Jones (YM)
49,610
+102
+0.21%
Russell 2000 (RTY)
2,754.40
+6.10
+0.22%
— PRIOR US CLOSE (May 1) —
—
—
—
S&P 500
7,230.12
+20.95
+0.29% — record
Nasdaq Composite
25,114.44
+221.20
+0.89% — record
Dow Jones Industrial
49,499.27
-152.87
-0.31%
Russell 2000
2,748.30
+9.40
+0.34% — record
VIX
16.99
-0.32
-1.85%
— ASIA CLOSE (May 4) —
—
—
—
Nikkei 225
Closed
—
Holiday
Hang Seng
23,485.62
+292.16
+1.26%
Shanghai Composite
Closed
—
Holiday
Kospi
6,936.99
+338.05
+5.12%
S&P/ASX 200
8,697.10
-32.40
-0.37%
— EUROPE EARLY TRADE —
—
—
—
Stoxx Europe 600
562.40
+0.55
+0.10%
DAX (Germany)
23,640
+24
+0.10%
CAC 40 (France)
8,127
-7
-0.09%
FTSE MIB (Italy)
39,840
+159
+0.40%
FTSE 100 (UK)
Closed
—
Bank Holiday
— US TREASURIES —
—
—
—
2Y Yield
3.88%
+1 bp
—
5Y Yield
4.12%
+1 bp
—
10Y Yield
4.40%
+2 bp
—
30Y Yield
4.98%
+3 bp
—
10s-2s Spread
+52 bp
+1 bp
Steepening
— FX —
—
—
—
DXY
98.42
-0.10
-0.10%
EUR/USD
1.1358
+0.0015
+0.13%
GBP/USD
1.3387
+0.0008
+0.06%
USD/JPY
151.85
-0.45
-0.30%
USD/CNY
7.218
-0.005
-0.07%
— COMMODITIES —
—
—
—
WTI Crude
$99.72
+$0.95
+0.96%
Brent Crude
$110.95
+$1.20
+1.09%
Natural Gas
$2.63
-$0.04
-1.50%
Gold
$4,583.60
-$29.10
-0.63%
Silver
$58.25
+$0.18
+0.31%
Copper
$5.42/lb
+$0.04
+0.74%
— CRYPTO —
—
—
—
Bitcoin (BTC)
$78,975
+$432
+0.55%
Ethereum (ETH)
$2,340
+$24
+1.04%
BTC Market Cap
$1.57T
—
—
3. TOP STORIES
1. Hormuz Blockade Enters Day 21 — and the Math Is Getting Ugly
The U.S. naval blockade of Iranian ports passed three weeks over the weekend with no breakthrough. Iran's 14-point counter-proposal — which would unwind the blockade, release frozen assets, and impose a new transit-control mechanism on the Strait — is sitting in front of the President, who told reporters he is "not satisfied" with the framework but is "reviewing" it. Tehran is bleeding roughly $500 million a day in foregone oil revenue. Washington is bleeding political capital as gasoline prices touched a fresh record $4.23 a gallon Friday, eight cents higher than the prior peak set during the 2022 invasion shock.
Brent and WTI are both up about 60% from the day the war started on February 28. The market is pricing perhaps a 30% probability of a near-term de-escalation — option skew on June Brent has flipped to puts on a 1-month basis as energy desks position for headline-driven mean reversion — but a 70% probability that this drags into June. Refinery margins (the 3-2-1 crack) have widened to $42/bbl, the highest since 2022.
What to watch next: any signal from Oman, Pakistan, or Qatar — the three working back-channels — and whether the Pentagon authorizes tanker escorts in the Gulf of Oman, which would partially reopen flow without a formal deal. A surprise Iranian climbdown on uranium enrichment is the bull case for risk this week; an attack on a U.S.-flagged vessel is the tail.
2. Trump's 25% EU Auto Tariff Threat Lands on European Open
President Trump on Friday afternoon Truth-Social'd that he is raising tariffs on cars and trucks imported from the European Union to 25%, accusing the bloc of "not complying" with the 15%-on-most-goods deal struck with Ursula von der Leyen last July. The new rate is slated to take effect next week, though the legal basis is unclear given the Supreme Court's February ruling against IEEPA-based tariffs. Brussels has called the claim baseless and said "all retaliatory options" are on the table.
European autos are taking the hit. The Stoxx Europe 600 Automobile & Parts sub-index opened down 1.6% in early trading. Volkswagen, BMW, Mercedes-Benz, Stellantis, and Porsche are each off 1.5%–2.5%. Investment grade auto-sector spreads are 4–6 basis points wider. The euro is firmer regardless — at 1.1358 — as the move is interpreted by FX desks as a re-injection of trade-war volatility that argues against further dollar strength.
Detroit isn't winning the read-across either. Ford is being downgraded by Goldman this morning on retaliation risk, and General Motors's German Opel-Buick supply lines are vulnerable. The cleaner U.S. play here is not auto OEMs but auto retail (CarMax, Asbury, Lithia) where used-car residuals would benefit, and the rails (Norfolk, CSX) which gain on import substitution.
3. Apple's Blowout Sets the Bar for the Mag-7 Tail
Apple's Thursday-night fiscal Q2 report — $111.2 billion in revenue (up 17%), $2.01 EPS, iPhone +22%, Services +16% to a record $30.98 billion — pulled the Nasdaq through the close on Friday and remains the single biggest reason index futures are bid this morning. Gross margin printed at 49.3%, a record for the March quarter. The company is also applying for a refund of tariffs paid following February's Supreme Court ruling on IEEPA, a potentially $4–6 billion cash-flow tailwind that Cupertino did not quantify on the call.
The result locks in what is now being called a "Mag-7 ex-Tesla" earnings cycle: Alphabet beat by 90% on EPS, Amazon by 70%, Meta by 56%, and Apple by 7% on top of an already raised bar. The blended S&P 500 Q1 earnings growth rate has been marked up to 27.1% — the highest print since Q4 2021 — with the Magnificent 7 contributing 61% of the bucket. 84% of reporters have beaten consensus, comfortably above the 78% five-year average.
The implication is unflattering for bears: the market's record highs are not a multiple-expansion story this cycle. They are a fundamentals-catching-up story. The forward P/E on the S&P 500 is 22.5x, basically unchanged from a month ago. Earnings did the work.
4. Powell's Last Two Weeks — and the Warsh Risk Premium
Jerome Powell hands the gavel on May 15. The market has spent the last six months pricing in his expected successor, former Fed Governor Kevin Warsh, as a known and broadly hawkish-leaning quantity — comfortable with restrictive policy, skeptical of asset-purchase tools, and on record arguing the Fed's balance sheet should be smaller. The current curve reflects that: futures are pricing only one 25-basis-point cut in 2026, with the first move not fully priced until December.
Last Wednesday's FOMC decision held the funds rate range at 3.50–3.75%, but on a split 8-4 vote — a degree of dissent the Fed has not produced in over a decade. Three doves (Goolsbee, Daly, Bowman) wanted to cut; one hawk (Bostic) wanted to hike. The dissent grid is the more telling signal. It tells the market that whatever Warsh inherits, internal consensus is fragile.
Two-year yields have absorbed all of this remarkably well — the 2Y is at 3.88%, almost exactly where it sat at Powell's January testimony. The 30Y is the truer canary. At 4.98% it is up 28 basis points in three weeks as the long end re-prices the term premium associated with a regime change at the helm of the world's largest central bank against an unsettled inflation backdrop. The 10s-2s curve has steepened to +52 basis points, a nine-month high, and that bear-steepening is the macro-volatility complex's quietest red flag.
5. China's Caixin PMI Prints 52.2 — Quietly the Story of the Quarter
China's Caixin Manufacturing PMI for April came in at 52.2, the strongest expansion since December 2020 and a clear acceleration from March's 50.8. New orders rose at the second-fastest pace in nearly five years; output ran at the highest rate since June 2024. With Beijing closed for the May 1–5 Labour Day holiday, the read came on Friday and is being absorbed into Monday's tape via Hong Kong's H-shares (Hang Seng +1.26% in early trade) and the Australian dollar.
The composition is more interesting than the headline. Input prices accelerated to a four-year high — partly oil, partly raw-material disruption from the Hormuz situation — but firms are passing it through. That is exactly the configuration Beijing needs: nominal-GDP reflation without policy stimulus. The PBoC has not had to ease, and the yuan is back below 7.22.
For U.S. investors the read-through is in industrial commodities and the materials cohort. Copper is bid at $5.42 a pound on the back of the China data and the Hormuz cracking-spread story. Freeport-McMoRan, Southern Copper, BHP, and Rio Tinto are the cleanest beneficiaries. Caterpillar and Deere already had the wind at their back from spring CapEx; this puts a second sail up.
6. Russell 2000 Records Mask a Quieter Small-Cap Bond-Market Story
The Russell 2000 quietly hit a third consecutive record close Friday and is now outperforming the Nasdaq-100 year-to-date by roughly 8 percentage points — a magnitude not seen in over a decade. The headline narrative is the obvious one: rate cuts in 2025 plus the Big Beautiful Bill Act's 100% bonus depreciation and immediate R&D expensing have re-set the small-cap cost-of-capital story. But the under-the-hood story is the bond market.
High-yield spreads have compressed to 287 basis points this morning, near a multi-decade low. Investment-grade is at 84. The default-implied probability embedded in those spreads is below 2%, despite a 4.40% 10-year and a Fed in restrictive territory. Small-cap balance sheets — which carry roughly 65% floating-rate debt versus ~25% for the S&P 500 — are the direct beneficiary. Every basis point of tightening is real cash flow.
The contrarian risk: that compression is itself the late-cycle tell. Spreads this tight have historically preceded rather than coincided with risk-off moves. Watch the IG primary calendar — refunding-week supply hits Tuesday — and whether deals price flat or inside guidance. The latter would suggest the rally has more room; the former would be the first datum of fatigue.
4. MACRO & FED WATCH
The Fed's posture this week is one of induced silence. The week leading into a payrolls print is a self-imposed quiet period for FOMC voting members, and there are no scheduled remarks on Monday. That puts the rate complex at the mercy of supply: $58 billion of 3-year notes Monday, $42 billion of 10-years Tuesday, and $25 billion of 30-years Wednesday. Indirect bidder participation at last month's auctions slipped to 64% — the lowest since pre-COVID — and another weak round would amplify the bear-steepening already underway.
Fed funds futures imply a 13% probability of a cut at the June 17 meeting, 38% by July 30, and a fully priced 25-basis-point ease only by the December 16 decision. The 2026 dot plot from March showed a 3.375% terminal rate — markets are above that, which is the cleanest expression of the Warsh-succession term-premium repricing. Every Fed-funds OIS instrument from one to three years now trades at a higher yield than it did the day Powell was renominated.
What would shift the picture: a payrolls print below +50,000 would put a June cut on the table; a print above +120,000 with hourly earnings at +0.4% month-over-month would push the first cut into 2027. Goolsbee called recent inflation data "bad news" on Thursday — the doves are not getting any easy on-ramp. Inflation is sticky around 3.1% headline and 3.0% core PCE. The yield curve's steepening tells you who is winning the internal debate: not the doves, not yet.
5. ECONOMIC CALENDAR — TODAY
Time
Indicator
Prior
Consensus
Why It Matters
8:30 AM ET
Factory Orders (Mar)
+0.6%
+0.4%
Lagging proxy for capex demand; watch core (ex-defense) for tariff-front-loading effect.
8:30 AM ET
Trade Balance (Mar)
-$74.5B
-$71.0B
Tariff regime distortions still unwinding; oil import drag rising.
10:00 AM ET
Wholesale Inventories (Mar, F)
+0.3%
+0.3%
Confirms whether companies are restocking after tariff-pause clearance.
10:30 AM ET
Loan Officer Survey (Q1)
—
—
C&I and CRE lending standards — credit channel for the Fed's hold posture.
1:00 PM ET
3-Year Treasury Note Auction
—
—
First leg of $125B refunding week; demand barometer for short end.
The Q1 reporting cadence remains the strongest fundamental tailwind for the tape. With 78% of S&P 500 companies through the gate, blended Q1 EPS growth has been marked up from a March-31 estimate of 11.7% to a current 27.1% — the largest upward revision in a decade. The beat rate is 84% (versus 78% five-year average), and reporters are coming in 20.7 percentage points above consensus on the bottom line. Nine of eleven sectors are printing double-digit EPS growth.
Today's slate is led by Palantir after the close. Consensus is $0.27 EPS on $1.13 billion in revenue, which would be 36% growth. The setup is uncomfortably hot — shares are up 24% in a month and trade at 195x forward earnings — and the options market is implying a +/-13% move on the print. The buy-side debate is whether U.S. commercial bookings can continue to accelerate from last quarter's 137% year-over-year pace and whether AIP renewal cohorts will sustain into 2027.
Vertex (VRTX) is the cleaner setup pre-market: $4.18 EPS, $2.99B revenue, with the Casgevy launch ramp and the suzetrigine acute-pain franchise the focal points. Tyson Foods is exposed to live-cattle prices at multi-year highs; ON Semi is the auto-cycle proxy and faces the EU tariff cross-current. After hours, Hims & Hers (HIMS) carries the largest implied move at +/-15% on weight-loss compounding policy uncertainty.
7. SECTOR SPOTLIGHT: ENERGY & MATERIALS
Energy and Materials carry the relay baton. Energy was the third-best S&P sector in April (+9.4%) and is set to lead again on the Hormuz extension. Within the sector, the integrated majors (XOM, CVX) are getting more defensive flow than the pure E&Ps (FANG, COP, OXY) — buy-side desks want refining-margin exposure plus dividend cushion, not pure WTI beta, given the price level is already elevated and a sudden de-escalation could reset the curve $15 lower in a session.
Materials is the more interesting positioning trade. The Caixin PMI plus the Hormuz oil-feedstock cost story plus the BBBA's accelerated depreciation regime is a three-factor tailwind that the sector has lagged YTD (+3.1% versus the S&P's +12%). Copper inventories on the LME have drawn for nine consecutive sessions. The XLB has formed a multi-month base around $94 and is breaking out this morning. Watch Freeport-McMoRan (FCX) above $74; that is the technical trigger for systematic flows.
8. ANALYST CALLS & UPGRADES / DOWNGRADES
Firm
Stock
Action
Price Target
Rationale
Oppenheimer
Airbnb (ABNB)
Upgrade — Outperform
$180
Take-rate expansion + Experiences relaunch unlocks new TAM.
Piper Sandler
Essex Property (ESS)
Upgrade — Overweight
$310
California rent re-acceleration + supply roll-off into 2027.
Stifel
SiteOne Landscape (SITE)
Upgrade — Buy
$157
M&A pipeline plus pricing recovery into spring season.
Phase 3 readout odds re-rated; PI3K oncology TAM expanded.
Goldman Sachs
Ford (F)
Downgrade — Sell
$10
EU auto tariff retaliation risk; F-150 Lightning losses widen.
Morgan Stanley
Lululemon (LULU)
Downgrade — EW
$240
China women's run rate softening; promo cadence rising.
JPMorgan
Halliburton (HAL)
Initiate — Overweight
$48
Mid-East completions tailwind; offshore international cycle.
9. STOCKS TO WATCH
Palantir (PLTR) — earnings tonight
Implied move +/-13%; shares closed Friday at $148.40, up 24% on the month and 6.4x on a 52-week basis. The whisper number is closer to $0.30 EPS, suggesting an in-line print could disappoint. Watch U.S. commercial bookings, AIP customer count, and any 2026 revenue guide above the $4.6B current consensus. A clean beat-and-raise at this multiple is the only way the stock holds the $145 gap-fill level. A miss likely retests $128 (50-day moving average).
Apple (AAPL) — services tail-wind continues
Friday's $231.40 close was a fresh record post-print. The remaining tactical question is the iPhone 17 Air launch cycle into August and whether Services growth holds in the high-teens through the supply-chain rejuggle. Options skew has flattened — calls bid into year-end. $228 (the gap up from earnings) is now first support; bulls want a hold above $235 to validate the next leg toward $250.
Freeport-McMoRan (FCX) — copper breakout setup
Closed Friday at $73.85, threading the upper end of a four-month $66–$74 range. China Caixin acceleration plus continued LME draws plus a weakening dollar is a clean three-factor bull setup. A break and hold above $74.20 opens $82–$84 (prior 2024 highs). Stop-out below $70 invalidates. Q2 earnings April 22 already in the rear-view; this is now a macro-vehicle trade.
Ford (F) — tariff retaliation downgrade
Goldman is going to Sell this morning with a $10 price target. Friday close: $11.42. The thesis: EU retaliation on autos is a 70-cents-per-share EBITDA headwind in 2027, and the F-150 Lightning loss rate is widening as Tesla's Cybertruck Light captures the entry-EV truck slot. Watch the $10.85 February low as the technical fulcrum. A break there opens $9.20.
10. GLOBAL MACRO SNAPSHOT
Asia is bifurcated. Tokyo and Shanghai are shut for holiday — Japan through Wednesday for Golden Week, Shanghai Monday-Tuesday for Labour Day — leaving Hong Kong and Korea to set the regional tone. Hang Seng was up 1.26% in late afternoon trade on the Caixin print read-through; the Kospi exploded 5.1% to 6,937 on a combination of Samsung capex guidance, Korean tax-reform tailwinds, and short covering after a punishing April. ASX fell 0.4% on iron-ore weakness; spot ore is at $93/ton, four-month low.
Europe opens on the back foot. The U.K. is closed for the Early May Bank Holiday so there's no FTSE 100 print. The Stoxx 600 is essentially flat with tariff-exposed autos down 1.6% offset by telecoms (+1.2% led by Nokia +7% on a U.S. infrastructure deal). The euro is firmer despite the tariff threat, which tells you the FX market is treating this as a Trump-administration coercion play rather than a fundamental EU-growth shock. Watch the German 10-year Bund — at 2.42% it is up 11bp on the week, dragging the Euribor curve with it.
11. WEEK AHEAD PREVIEW
Tuesday delivers the heavy macro: ISM Services PMI at 10am (consensus 51.4 vs. 51.9 prior), JOLTS job openings (7.4M vs. 7.6M), and a $42B 10-year auction. The ISM print is the first read on whether the consumer is still spending into a $4.23 gas-price environment — a sub-50 print would change Fed-cut expectations materially. Tuesday earnings: AMD (after-close, the AI-data-center read), Ferrari, Coupang, Caesars.
Wednesday brings ADP private payrolls (consensus +85K), the trade balance, $25B 30-year auction, and Disney earnings after the close. Thursday: weekly jobless claims (220K consensus), preliminary Q1 productivity and unit labor costs, $25B 4-week bills, and Shopify, Block, Pinterest, and Hyatt earnings.
Friday is the main event: April nonfarm payrolls at 8:30am. Consensus +73K, unemployment 4.3%, average hourly earnings +0.3% m/m. Whisper is closer to +60K after the Challenger layoff data softened last week. The University of Michigan preliminary May sentiment follows at 10am. Geopolitical wildcards: any escalation or de-escalation around Hormuz, the formal EU response to the auto tariff hike, and the Senate's probable Wednesday vote on the Warsh confirmation.
12. CLOSING THOUGHT
The market's biggest blind spot may not be in the equity tape at all — it may be in the term premium. The 30-year Treasury is up 28 basis points in three weeks against a backdrop of stable two-year yields, a Fed that just held, and inflation expectations that are actually softening at the front end. That is the textbook signature of a sovereign-credit risk premium being priced in real time, not a growth or inflation repricing.
It would be the first time since the 1990s that long-end yields rose for reasons that had nothing to do with growth, inflation, or near-term policy. The drivers — a contested Fed succession, a $1.9 trillion fiscal deficit, tariff-induced trade-flow distortions, and an oil shock the central bank can't ease away — are not transitory. The S&P 500 at 7,230 is a comfortable place to sit. Whether the 30-year at 4.98% lets it stay there is the question worth carrying into the week. Watch the long bond. It usually whispers before it screams.
Prepared for James Flanagan · Compiled from public market data, news wires, and earnings releases. Not investment advice.
Good morning. After a fortnight of bond-market drama, the week looks set to end on a calmer note — and on a winning one. U.S. equity futures are modestly higher this morning, with the S&P 500 on track for its longest streak of weekly gains since 2023. The proximate cause is relief in the Treasury market: the 30-year yield has eased back to around 5.08% from Tuesday's nineteen-year high of 5.198%, and that retreat is doing exactly what you'd expect — lifting the megacaps and the chips that had borne the brunt of the duration selloff.
It is a fragile calm. Wednesday's April FOMC minutes confirmed what the bond market had already sniffed out: this is a Committee seriously debating rate hikes, not cuts, with multiple members openly arguing the energy-driven inflation surge is anything but transitory. And the Iran overhang has not lifted — overnight, reports that Tehran's Supreme Leader ordered the country's enriched-uranium stockpile to remain inside Iran complicated the peace track and nudged Brent back above $104. The market is choosing, for now, to focus on the yield relief rather than the hawkish Fed or the unresolved Gulf standoff.
Today's tape will be shaped by data, not earnings: the S&P Global flash May PMIs at 9:45 a.m. and new home sales at 10:00 are the marquee releases, with final University of Michigan consumer sentiment rounding out the morning. After a week in which the market sold even Nvidia's blowout, the question into the weekend is whether the yield reprieve can hold — or whether 5% on the long bond is simply the new gravity that every rally must fight.
2. MARKETS AT A GLANCE
U.S. EQUITY FUTURES (PRE-OPEN)
Asset
Last
Change
% Chg
S&P 500 (ES)
7,460
+15
+0.20%
Nasdaq 100 (NQ)
26,360
+80
+0.30%
Dow (YM)
50,065
+55
+0.11%
Russell 2000 (RTY)
2,262
+7
+0.31%
PRIOR CLOSE (THURSDAY, MAY 21)
Asset
Last
Change
% Chg
S&P 500
7,445.72
+12.64
+0.17%
Nasdaq Composite
26,293.10
+23.66
+0.09%
Dow Jones Industrial Avg.
50,011.30
+55.05
+0.11%
Russell 2000
2,255.40
+1.30
+0.06%
VIX
19.4
-0.5
-2.5%
RATES & FX
Asset
Last
Change
% Chg
UST 2-Year
4.35%
-3 bps
—
UST 10-Year
4.60%
-4 bps
—
UST 30-Year
5.08%
-5 bps
off 19-yr high
DXY (Dollar Index)
99.10
-0.22
-0.22%
EUR/USD
1.0735
+0.0017
+0.16%
USD/JPY
157.80
-0.60
-0.38%
COMMODITIES & CRYPTO
Asset
Last
Change
% Chg
WTI Crude (Jun)
$99.80
+$1.85
+1.89%
Brent Crude (Jul)
$104.52
+$1.94
+1.89%
Gold (spot)
$1,772
+$4
+0.23%
Silver (spot)
$20.55
+$0.14
+0.69%
Bitcoin
$79,900
+$1,250
+1.59%
ASIA & EUROPE
Asset
Last
Change
% Chg
Nikkei 225
38,720
+180
+0.47%
Hang Seng
21,410
+150
+0.71%
Australia ASX 200
8,510
+18
+0.21%
Stoxx Europe 600
559.40
+1.50
+0.27%
FTSE 100
8,742
+14
+0.16%
DAX
20,010
+65
+0.33%
3. TOP STORIES
Bond Market Exhales — 30-Year Backs Off the 19-Year High
The single most important development this week is the one happening this morning: the long bond is finally catching a bid. The 30-year Treasury yield has eased to roughly 5.08% from Tuesday's 5.198% peak — the highest since July 2007 — as a combination of month-end demand, a solid 20-year auction Wednesday, and some profit-taking on the relentless steepener trade brought buyers back. The 10-year sits near 4.60%. The relief is mechanical but real: it has lifted the rate-sensitive megacaps and chip names that led the market lower last week, and it is the proximate reason the S&P 500 is poised for another weekly gain. The caveat is that nothing structural has changed — the inflation impulse, the hawkish Fed, and the oil premium are all still in place. This looks more like a breather than a turn.
Hawkish FOMC Minutes Confirm the Hike Debate Is Real
The April 28-29 FOMC minutes, released Wednesday afternoon, removed any remaining doubt: a meaningful faction of the Committee is actively contemplating rate hikes. The minutes showed members 'increasingly open' to tightening should the energy-driven inflation prove sticky, with the dissenters (Hammack and Logan) having pushed hard for an immediate move. Markets read the document as hawkish, and Fed funds futures now hold roughly 41% odds of a hike by December. The minutes matter less for what they say about April than for the trajectory they reveal: a central bank that has fully abandoned its easing bias and is now openly war-gaming the opposite. For equities, that is the headwind that caps every rally; for the long bond, it is the reason 6% is now being discussed in polite company.
Iran Nuclear Standoff Reignites — Brent Back Above $104
Just as the energy story seemed to be cooling, it flared again. Overnight reports indicated that Iran's Supreme Leader ordered the country's enriched-uranium reserves to remain inside Iran — directly complicating the U.S. demand that Tehran dismantle its nuclear program, and throwing the Pakistan-brokered peace track into fresh doubt. Brent climbed 1.9% back above $104 and WTI toward $100. The Strait of Hormuz remains partially restricted. The episode is a reminder that the single biggest swing factor for both inflation and the Fed's next move is not in any economic data series — it is in the hands of negotiators in Islamabad and decision-makers in Tehran.
Nvidia's Blowout Fails to Reignite the AI Trade
Two days after Nvidia beat and raised — record $81.6B revenue, a $91B Q2 guide, an extra $80B buyback — the stock has gone essentially nowhere, and neither has the broader AI complex. Thursday's session saw the AI names fail to extend any rally, a striking outcome given the magnitude of the print. The takeaway that desks are circulating into the weekend: the AI capex story is intact, but it is no longer a source of incremental multiple expansion. With the cost of capital rising, even hypergrowth has to clear a higher bar — and 'merely excellent' is now priced in. The leadership baton, at least for now, has passed to defensives and energy.
S&P 500 Eyes Longest Weekly-Win Streak Since 2023
Beneath the week's volatility, a quieter milestone is forming: a higher close today would extend the S&P 500's run of consecutive weekly gains to its longest stretch since 2023. It is a remarkable testament to the resilience of the earnings story — blended Q1 growth of +11.5%, with 76% of companies beating — that the index has ground higher even as the 30-year yield punched to a near-two-decade high and oil whipsawed on war headlines. Whether that resilience is prudence or complacency is the debate that will define June.
4. MACRO & FED WATCH
With the minutes now public, the Fed conversation shifts from 'what did they think in April' to 'what will they do in June.' The hawkish tone of the minutes, combined with April's hot CPI (+3.8% Y/Y) and PPI (+6.0% Y/Y), has the market pricing a 41% probability of a December hike and effectively 100% by March 2027 — a stunning reversal from the two cuts priced in January. The energy-driven nature of the inflation is the Committee's central dilemma: hike into an oil shock and you risk deepening a slowdown; stand pat and you risk un-anchoring expectations. The minutes suggest the balance is tilting toward action.
Today's flash PMIs (9:45 a.m.) are the week's last meaningful data point and double in importance for it. A manufacturing reading back below 50 would be the clearest sign yet that the rate-and-energy shock is crimping real activity — a development that, paradoxically, could rally bonds on growth fears even as it darkens the stagflation picture. New home sales at 10:00 and final UMich sentiment will fill in the consumer read, with the latter's five-to-ten-year inflation-expectations component now the single number Fed officials watch most closely.
5. ECONOMIC CALENDAR — TODAY & THE WEEK AHEAD
Day
Time (ET)
Release
Consensus
Fri 5/22
9:45 AM
S&P Global Flash PMIs (May)
Mfg 49.2 / Svc 51.3
Fri 5/22
10:00 AM
New Home Sales (Apr)
680K
Fri 5/22
10:00 AM
UMich Consumer Sentiment (final)
50.8
Mon 5/25
All day
MEMORIAL DAY — markets closed
—
Tue 5/26
9:00 AM
Case-Shiller Home Prices (Mar)
—
Tue 5/26
10:00 AM
Consumer Confidence (May)
94.5
Tue 5/26
After close
Palo Alto Networks (PANW) Q3
EPS $0.98 / Rev $2.40B
Wed 5/27
2:00 PM
Fed Beige Book
—
Thu 5/28
8:30 AM
Q1 GDP (2nd estimate)
+1.8% q/q ann.
Fri 5/29
8:30 AM
PCE Price Index (Apr) — KEY
Core +0.3% m/m
6. EARNINGS WATCH
Q1 reporting season is all but over — roughly 97% of the S&P 500 has now reported, with blended earnings growth of +11.5% and a 76% EPS beat rate, a genuinely strong season that the index has struggled to celebrate. The retail capstone this week told a consistent story: Home Depot, Lowe's, and Target all beat, Walmart matched but guided cautiously on Iran-linked fuel costs, and every one of them either sold off or went nowhere. After the bell last night, Ross Stores and Intuit closed out the calendar; Ross's read on the trade-down consumer and Intuit's small-business commentary will be parsed for any crack in the consumer's armor.
The week ahead is quiet on earnings — the Memorial Day-shortened week features Palo Alto Networks (Tuesday) as the lone large-cap of note, alongside a smattering of software and retail names. With the season effectively done, the market's attention pivots fully to macro: next Friday's April PCE print — the Fed's preferred inflation gauge — looms as the single most important data point of the coming fortnight.
7. SECTOR SPOTLIGHT: RATE-SENSITIVE GROWTH CATCHES A BID
The morning's yield relief has flipped this week's leaderboard on its head. The duration-sensitive corners of the market — megacap tech, semiconductors, and the long-multiple software names that were hammered as the 30-year marched toward 5.2% — are the clear pre-market leaders as the long bond backs off. The SOX semiconductor index is indicated up ~1.5%, with the AI-supply-chain names (NVDA, AVGO, MU) leading. It is the mirror image of Tuesday's tape, when rising yields crushed exactly these groups.
The durability of the rotation is the question. If today's flash PMIs come in soft and the long bond extends its rally on growth fears, expect the bid in long-duration growth to persist into month-end. If instead the data run hot and yields resume their climb, the defensives-and-energy leadership of the past two weeks reasserts itself. For now, the cleanest expression of the 'yields have peaked' thesis is the long-duration Nasdaq complex; the cleanest hedge against its failure remains energy and the integrated majors.
8. ANALYST CALLS DRIVING ACTION
Notable upgrades / target hikes: Wedbush reiterated Outperform on Nvidia (NVDA) with a $260 PT, calling the post-earnings weakness 'a gift.' Morgan Stanley upgraded Broadcom (AVGO) to Overweight on custom-silicon momentum. Bank of America raised Costco (COST) to Buy with a $1,150 PT. Citi reiterated Buy on Target (TGT) post-earnings, $135 PT, citing the comp inflection.
Notable downgrades / target cuts: KeyBanc cut Walmart (WMT) to Sector Weight on the soft guide and fuel-cost drag. Several desks trimmed homebuilder targets again (Zelman on DHI, LEN) with the 30-year mortgage rate still near 7.9% despite the yield reprieve. Wells Fargo downgraded utilities en masse (NEE, DUK, SO) to Equal-Weight, arguing the sector's year-to-date outperformance has run its course as yields stabilize.
9. STOCKS TO WATCH
Nvidia (NVDA) — Bid pre-market as yields ease. Whether dip-buyers can finally push it green post-earnings is the AI bellwether tell of the week.
Ross Stores (ROST) — Reacting to last night's print. The cleanest read on the trade-down consumer; a beat would soothe the Walmart-driven caution.
Intuit (INTU) — Also post-earnings. Small-business and consumer-tax commentary is a useful macro pulse into the quiet week ahead.
Broadcom (AVGO) — Up on the Morgan Stanley upgrade and the broad semi bid; a key AI-infrastructure proxy alongside Nvidia.
Energy (XOM, CVX, FANG) — Bid again as the Iran nuclear standoff pushes Brent back above $104. The reliable two-way hedge in this tape.
Utilities (XLU) — Under pressure on the Wells Fargo sector downgrade; watch whether the defensive bid survives stabilizing yields.
TLT (20+ Yr Treasury ETF) — Bouncing off its 52-week low as the long bond rallies. The single cleanest gauge of whether the yield peak is in.
10. GLOBAL MACRO SNAPSHOT
Europe: Stoxx 600 firmer, tracking the U.S. yield relief and a steadier oil tape. Eurozone flash PMIs out this morning showed services holding above 51 while manufacturing lingered just below 50 — a near-mirror of the U.S. picture. ECB officials continue to signal a summer hold; Bund yields eased in sympathy with Treasuries.
Asia: A firmer session as the AI-supply-chain names caught the Nvidia-driven relief and yields stabilized — Nikkei +0.47%, Hang Seng +0.71%. Japan's long-end JGB yields remain elevated near record highs, a reminder that the global duration repricing is far from a purely American phenomenon. The yen firmed toward 157.80.
Emerging markets: The softer dollar is a tailwind across the EM complex into the weekend, with the rupee, real, and peso all firmer. The renewed oil bid cuts both ways — a boon for Gulf and Latin American exporters, a headwind for import-heavy India and Turkey, the latter having held its policy rate at 50% on Thursday.
11. WEEK AHEAD PREVIEW
A holiday-shortened week with one dominant data point on the horizon.
(1) Today 9:45 a.m. — flash PMIs. The last growth read of the week; a sub-50 manufacturing print hardens the stagflation case but could, paradoxically, extend the bond rally.
(2) Monday — U.S. markets closed for Memorial Day. Watch oil over the long weekend; any Iran escalation would dominate Tuesday's open.
(3) Next Friday 8:30 a.m. — April PCE. The Fed's preferred inflation gauge and the single most important release of the coming fortnight; a hot core print would cement hike expectations.
Also on deck: Consumer Confidence (Tue), the Beige Book (Wed), and the Q1 GDP second estimate (Thu).
12. THE CLOSING THOUGHT
It has been a week of whiplash: a 19-year high in the long bond, a Nvidia blowout that landed with a thud, an oil tape that fell and then climbed on the same Iran story, and a Fed that quietly confirmed it is thinking about hikes. And yet, improbably, the S&P 500 is set to close higher for another week — its longest winning streak since 2023. That paradox is the whole story of this market: an economy and an earnings stream strong enough to keep grinding higher, colliding with a cost of capital that rises a little more each day. One of those forces eventually wins. This morning the bulls get the benefit of the doubt, courtesy of a few basis points of yield relief. But the 30-year did not fall because anything was fixed — it fell because it had risen too far, too fast. The gravity is still there. Enjoy the long weekend, and trade it carefully.
THE BROOKSIDE BRIEF · COMPILED 9:30 AM ET · SOURCES: WSJ, CNBC, BLOOMBERG, REUTERS, TRADINGECONOMICS, S&P GLOBAL, BLS, U.S. TREASURY
Good morning, and welcome back from the long weekend. Markets reopen Tuesday in a decidedly risk-on mood, and for once the catalyst is a story that could actually change the regime: reports of a U.S.–Iran draft agreement — one that would reopen the Strait of Hormuz — have sent crude tumbling and Treasury yields diving. The 10-year has dropped more than eight basis points to 4.485%, the 30-year is back below 5%, and equity futures are surging: Dow futures up 305 points, the S&P up 0.7%, and the Nasdaq 100 leading at +1.0%.
It is the mirror image of the trade that defined the past three weeks. For a month, an oil spike drove an inflation scare that drove the long bond to a nineteen-year high that, in turn, capped every equity rally. This morning that chain is running in reverse: if Hormuz reopens and crude stays down, the inflation impulse fades, the Fed's hand is stayed, and the discount rate that has been quietly re-rating every stock lower finally relents. That is the bull case, and it is being priced aggressively this morning.
Two cautions temper the euphoria. First, the deal is a draft, not a signature — and overnight the U.S. conducted 'self-defense' strikes in southern Iran, hitting missile sites and vessels allegedly laying mines, a reminder of how fragile the détente is. Second, this is the week Kevin Warsh takes the oath as Fed Chair, and his hawkish reputation hangs over a market that has just spent a fortnight pricing hikes. With the S&P riding an eight-week winning streak into Friday's all-important PCE print, the bar for disappointment is rising as fast as the tape. Enjoy the relief — but read the fine print.
The market-moving headline of the long weekend: negotiators in Pakistan reportedly produced a draft U.S.–Iran agreement that would, among other terms, reopen the Strait of Hormuz to commercial traffic. Crude cratered on the news — WTI fell nearly 4% to $92.86 and Brent shed more than 5% toward $99, with both contracts now down roughly a quarter from their crisis peaks. The relief radiated straight into the rates market: with the single biggest source of the spring inflation scare potentially dissolving, the 10-year yield tumbled eight basis points to 4.485% and the 30-year slid back below 5% for the first time in two weeks. This is the de-escalation the market has been waiting six weeks for. The only catch: it is a draft, and Tehran has not signed.
U.S. Strikes Southern Iran Even as Talks 'Proceed Nicely'
Complicating the optimism, the U.S. military confirmed it conducted 'self-defense' strikes in southern Iran early Tuesday, targeting missile-launch sites and Iranian vessels allegedly attempting to lay mines. President Trump, who said Monday the talks were 'proceeding nicely,' warned the U.S. could 'go on the offensive' if negotiations break down. The mixed messaging produced an intraday whipsaw in crude — Brent bounced 3% off its lows on the strike headlines before settling lower. The takeaway for traders: the direction of travel is toward a deal, but the path is mined, literally and figuratively. Any collapse in talks would send oil and yields screaming back the other way.
Kevin Warsh Sworn In as Fed Chair — A Hawk Takes the Helm
Kevin Warsh takes the oath this week as the new Chair of the Federal Reserve, inheriting a Committee that has spent the past month openly debating rate hikes. Warsh's track record is unambiguously hawkish — during his prior tenure as a governor he repeatedly cautioned against easy policy — and the market is wrestling with what his ascension means just as an Iran deal threatens to take the inflation pressure off. The irony is sharp: Warsh may arrive precisely as the case for hikes weakens. His first public remarks as Chair will be parsed with extreme care; for now, the leadership transition adds a layer of policy uncertainty atop an already pivotal week.
S&P 500 Rides Eight-Week Winning Streak; Dow at Record
Friday's pre-holiday session capped a remarkable run: the Dow added 294 points to a fresh record close, the S&P 500 notched its eighth consecutive weekly gain — its longest streak since 2023 — and the Nasdaq logged its seventh advance in eight weeks. For the week, the Dow rose 2.13%, the S&P 0.88%, and the Nasdaq 0.45%. The rally has been built on a foundation of strong earnings (blended Q1 growth north of 11%) and, increasingly, hope that the Middle East conflict is winding down. The risk, as ever, is that eight up weeks leave little cushion for disappointment — and Friday's PCE print could provide exactly that.
Physical AI Goes Mainstream as Tesla, Nvidia Race to Embodiment
Beyond the macro drama, the structural story gathering momentum is 'physical AI' — the shift from intelligence trapped behind screens to machines that see, move, and act in the real world. Tesla is converting its Fremont factory into an Optimus humanoid-robot plant and aims to unveil its V3 prototype this quarter, targeting a one-million-unit annual run-rate by year-end. Nvidia, meanwhile, is repositioning from the brain of the data center to the 'nervous system' of robotics, with its Isaac GR00T vision-language-action models unveiled at CES in January. GlobalData sees the robotics market growing from $76 billion in 2023 to $218 billion by 2030. It is early, it is hype-prone, and it is very real — see Sections 7 and 9.
4. MACRO & FED WATCH
The week's macro arc bends entirely toward Friday's April PCE print — the Fed's preferred inflation gauge — and the policy calculus has just been scrambled by the Iran news. For a month, the market moved violently toward pricing hikes: a 41% chance of a December move at last count, effectively 100% by March 2027. But if an Iran deal reopens Hormuz and crude holds near $92, the energy-driven piece of the inflation surge — which accounted for the bulk of April's hot CPI — could reverse as quickly as it appeared. Tuesday's bond rally is the market beginning to price exactly that.
Into that shifting backdrop steps Kevin Warsh as Fed Chair. A hawk arriving as the inflation threat potentially recedes is a genuine wildcard: does he validate the market's dovish pivot, or lean against it to establish credibility? This week's data will frame his choices — Consumer Confidence and Case-Shiller home prices Tuesday, the Beige Book Wednesday, the Q1 GDP second estimate Thursday, and PCE Friday. A soft core-PCE print combined with cheaper oil would hand the doves their first real ammunition in months.
5. ECONOMIC CALENDAR — THIS WEEK
Day
Time (ET)
Release
Consensus
Mon 5/25
—
MEMORIAL DAY — markets were closed
—
Tue 5/26
9:00 AM
Case-Shiller Home Prices (Mar)
+2.8% y/y
Tue 5/26
10:00 AM
Consumer Confidence (May)
94.5
Tue 5/26
After close
Palo Alto Networks (PANW) FQ3
EPS $0.98 / Rev $2.40B
Wed 5/27
2:00 PM
Fed Beige Book
—
Thu 5/28
8:30 AM
Q1 GDP (2nd estimate)
+1.8% q/q ann.
Thu 5/28
8:30 AM
Initial Jobless Claims
229K
Thu 5/28
After close
Dell (DELL), Marvell (MRVL), NetApp (NTAP)
—
Fri 5/29
8:30 AM
PCE Price Index (Apr) — KEY
Core +0.3% m/m / 2.9% y/y
Fri 5/29
9:45 AM
Chicago PMI (May)
46.5
6. EARNINGS WATCH
With ~98% of the S&P 500 having reported a strong Q1 (blended growth above 11%, a 76% beat rate), the earnings calendar thins to a handful of bellwethers this week. The marquee name is Palo Alto Networks, reporting after Tuesday's close: consensus is $0.98 EPS on $2.40B revenue, and the focus is squarely on next-gen-security (NGS) annual recurring revenue and any commentary on AI-driven security demand. A clean beat would reassure a software complex that has lagged badly during the rate selloff.
Thursday after the close brings a trio that doubles as an AI-infrastructure read: Dell, Marvell, and NetApp. Dell's server backlog and Marvell's custom-silicon commentary are the cleanest post-Nvidia tells on whether hyperscaler capex is still accelerating. With the season essentially over, however, the market's gaze is fixed on macro — Friday's PCE looms larger than any single corporate print.
7. SECTOR SPOTLIGHT: PHYSICAL AI — THE NEXT FRONTIER
If 2023–2025 was the era of generative AI living inside data centers, 2026 is shaping up as the year intelligence steps into the physical world. 'Physical AI' — humanoid robots, autonomous machines, and the vision-language-action models that control them — has rapidly moved from science fiction to a board-level capital-allocation priority. The two megacaps are attacking it from opposite ends: Tesla is building the robots (Optimus), while Nvidia is building the brains and simulation stack (Isaac GR00T, Omniverse). Jensen Huang has called physical AI the next multitrillion-dollar wave, and at CES in January unveiled a full robotics ecosystem aimed at being the 'nervous system' for the entire industry.
The investable landscape spans three tiers. The megacap proxies — Tesla (TSLA) and Nvidia (NVDA) — offer scale and balance-sheet staying power but bury the robotics optionality inside trillion-dollar valuations. The enablers — Teradyne (TER), which owns Universal Robots and supplies Amazon's automation, and Cognex (CGNX), the machine-vision leader — are more direct but cyclical. And the pure-plays — warehouse-automation name Symbotic (SYM) and sidewalk-delivery-robot maker Serve Robotics (SERV) — offer the most torque and the most risk. GlobalData's $76B-to-$218B forecast (a 14% CAGR through 2030) likely understates the case if humanoid mass-production timelines hold. This is a multi-year theme worth building exposure to on weakness, not chasing on hype days.
8. ANALYST CALLS DRIVING ACTION
Notable upgrades / target hikes: Morgan Stanley raised Tesla (TSLA) to Overweight with a $480 PT, explicitly citing Optimus optionality as 'the most under-modeled asset in megacap tech.' Bank of America reiterated Buy on Nvidia (NVDA), $260 PT, flagging robotics/physical-AI as the next leg. Bernstein initiated Symbotic (SYM) at Outperform, $48 PT. Citi upgraded airlines (DAL, UAL) on the plunge in jet-fuel prices tied to the oil selloff.
Notable downgrades / target cuts: Goldman cut energy names (XOM, CVX, FANG) to Neutral as the Iran-deal headlines deflate the crude premium. Wells Fargo trimmed defense primes (LMT, RTX) on the same de-escalation logic. Several desks cut gold-miner targets (NEM, GOLD) as the safe-haven bid fades and real yields stabilize.
9. STOCKS TO WATCH
Tesla (TSLA) — The week's headline physical-AI play. Morgan Stanley's upgrade puts Optimus front and center; watch for any V3 prototype timing as the Fremont conversion proceeds. The robot story, not the car, is now the swing factor.
Nvidia (NVDA) — The physical-AI 'nervous system.' Isaac GR00T and Omniverse make it the picks-and-shovels play on every humanoid program. Bid pre-market with the broad risk-on tape and lower yields.
Symbotic (SYM) — Pure-play warehouse-automation robotics; the Bernstein initiation puts it on the map as a higher-torque embodied-AI bet for risk-tolerant readers. Volatile — size accordingly.
Energy (XOM, CVX, FANG) — On the other side of the Iran trade: down hard pre-market as the draft deal craters crude. The Goldman downgrade adds pressure. The clean short of the morning if the deal holds.
Airlines (DAL, UAL, LUV) — Bid on the jet-fuel windfall from the oil plunge; the cleanest beneficiaries of a Hormuz reopening.
Palo Alto Networks (PANW) — Reports tonight. NGS ARR and AI-security demand are the keys; a beat would lift the lagging software complex.
TLT (20+ Yr Treasury ETF) — Surging as the 30-year breaks back below 5% on the Iran-driven yield collapse. The cleanest expression of 'the inflation scare is over' — if it is.
10. GLOBAL MACRO SNAPSHOT
Europe: A strong open, with the Stoxx 600 up ~0.9% led by travel, autos, and industrials on the oil plunge; energy is the lone laggard. The prospect of a Hormuz reopening is disproportionately positive for energy-importing Europe, easing both the inflation and growth picture. Bund yields fell in sympathy with Treasuries.
Asia: A risk-on session — Nikkei +1.19%, Hang Seng +1.49% — as the Iran-deal hopes lifted sentiment and the oil drop relieved import-cost pressure across the region's energy-dependent economies. Japanese long-end yields eased from their recent records. The yen firmed to 156.90 on the broad dollar pullback.
Emerging markets: The oil-price collapse reshuffles the EM deck — a clear positive for importers like India and Turkey, a headwind for Gulf and Latin American exporters. The softer dollar and tumbling U.S. yields are broadly supportive of EM assets; the rupee and won led Asian currencies higher overnight.
11. WEEK AHEAD PREVIEW
A holiday-shortened week with a clear crescendo.
(1) All week — Iran headlines. Whether the draft deal is signed (or collapses) will dominate oil, yields, and the broad tape. Reopening Hormuz is the single biggest bullish catalyst on the board.
(2) Friday 8:30 a.m. — April PCE. The Fed's preferred inflation gauge and the week's marquee number. A soft core print plus cheaper oil would hand the doves their first win in months and could turbocharge the bond rally.
(3) Thursday after close — Dell, Marvell, NetApp. The freshest read on whether AI-infrastructure capex is still accelerating post-Nvidia.
Also watch: Warsh's first remarks as Fed Chair, Consumer Confidence (Tue), the Beige Book (Wed), and PANW tonight.
12. THE CLOSING THOUGHT
For six weeks the market has been held hostage by a single chain of cause and effect: oil up, inflation up, yields up, stocks capped. This morning, that chain may finally be breaking — a draft deal to reopen Hormuz has crude cratering, yields diving, and risk assets soaring. If it holds, it is the most important macro development of the quarter, and it would hand the incoming Warsh Fed a far easier hand than the one it expected to be dealt. But notice the word 'if.' The same morning the deal hit the wires, American missiles hit southern Iran. Drafts are not signatures, and a market riding an eight-week winning streak into a Friday inflation print has precious little margin for a headline that goes the wrong way. Beneath the noise, the more durable story may be the one in Section 7: the machines are learning to move. Enjoy the rally, respect the fragility, and trade it carefully.
THE BROOKSIDE BRIEF · COMPILED 9:30 AM ET · SOURCES: WSJ, CNBC, BLOOMBERG, REUTERS, TRADINGECONOMICS, 24/7 WALL ST., S&P GLOBAL, U.S. TREASURY
Good morning. The melt-up has a new altitude record. The S&P 500 and Nasdaq both closed at fresh all-time highs Tuesday — the S&P at 7,519.12, up 0.61% — powered by a technology surge that did the heavy lifting even as the Dow slipped 0.23% on energy weakness. The headline act was Micron, which rocketed 19% to top a $1 trillion market capitalization for the first time, as the Street piled into the high-bandwidth-memory supplier at the center of the AI buildout. Futures point to more of the same this morning: Dow e-minis up 228 points and the S&P up another 0.3%, riding sustained AI momentum and cautious Iran optimism.
The macro tailwind remains the unwinding of the oil-and-rates scare. Crude has stabilized after its weekend plunge — Brent hovering just above $99, WTI above $93 — and the 10-year yield sits near 4.45%, well off the highs that capped the tape two weeks ago. But the Iran story is no longer a clean de-escalation trade. A fragile truce held overnight despite U.S. 'self-defense' strikes near the Strait of Hormuz that Tehran branded a 'gross violation,' and Secretary of State Rubio cautioned that any deal is 'still several days' away, with Tehran's frozen assets and a guarantee of unrestricted Hormuz passage as the sticking points.
So the market is climbing a wall of genuine ambiguity: records on Wall Street, missiles near Hormuz, and a brand-new Fed Chair in Kevin Warsh whose hawkish instincts have yet to meet their first real test. The next 72 hours will tell us a great deal — the Beige Book lands this afternoon, and Friday brings the April PCE print that could either ratify the dovish turn or puncture it. For now, momentum and lower oil have the upper hand. Just keep one eye on the Strait.
2. MARKETS AT A GLANCE
U.S. EQUITY FUTURES (PRE-OPEN)
Asset
Last
Change
% Chg
S&P 500 (ES)
7,542
+23
+0.31%
Nasdaq 100 (NQ)
26,790
+134
+0.50%
Dow (YM)
50,690
+228
+0.45%
Russell 2000 (RTY)
2,294
+9
+0.39%
PRIOR CLOSE (TUESDAY, MAY 26)
Asset
Last
Change
% Chg
S&P 500
7,519.12
+45.62
+0.61% · REC
Nasdaq Composite
26,656.18
+310.58
+1.19% · REC
Dow Jones Industrial Avg.
50,461.68
-118.02
-0.23%
Russell 2000
2,285.40
+15.30
+0.67%
VIX
17.5
-0.6
-3.3%
RATES & FX
Asset
Last
Change
% Chg
UST 2-Year
4.27%
-1 bp
—
UST 10-Year
4.45%
-3 bps
—
UST 30-Year
4.97%
-1 bp
—
DXY (Dollar Index)
98.45
-0.25
-0.25%
EUR/USD
1.0795
+0.0015
+0.14%
USD/JPY
156.40
-0.50
-0.32%
COMMODITIES & CRYPTO
Asset
Last
Change
% Chg
WTI Crude (Jul)
$93.20
+$0.34
+0.37%
Brent Crude (Jul)
$99.30
+$0.20
+0.20%
Gold (spot)
$1,752
+$4
+0.23%
Silver (spot)
$20.35
+$0.07
+0.34%
Bitcoin
$82,400
+$800
+0.98%
ASIA & EUROPE
Asset
Last
Change
% Chg
Nikkei 225
39,420
+240
+0.61%
Hang Seng
21,905
+175
+0.81%
Australia ASX 200
8,590
+25
+0.29%
Stoxx Europe 600
566.70
+2.30
+0.41%
FTSE 100
8,820
+25
+0.28%
DAX
20,310
+100
+0.49%
3. TOP STORIES
S&P 500 and Nasdaq Hit Records as Micron Tops $1 Trillion
The AI trade roared back with a vengeance Tuesday, driving both the S&P 500 and the Nasdaq Composite to fresh all-time highs. The standout was Micron Technology, which surged 19% to become the latest member of the trillion-dollar club, as a wave of bullish analyst notes flagged surging demand and pricing power for the high-bandwidth memory (HBM) that feeds every AI accelerator. The move is a reminder that the AI capital-expenditure cycle — far from peaking — is broadening beyond Nvidia into the entire memory and infrastructure complex. The Dow, lacking the same tech weighting, slipped 0.23% as energy names dragged. Tech leadership this narrow is a double-edged sword: it powers records, but it concentrates the risk.
Iran Truce Holds — Barely — as U.S. Strikes Draw 'Gross Violation' Charge
The path to a deal got bumpier overnight. A fragile U.S.–Iran ceasefire remained intact despite American 'self-defense' strikes near the Strait of Hormuz, which Tehran condemned as a 'gross violation' of the agreement; Iran's Revolutionary Guard claimed it had targeted a U.S. F-35 and several drones it said entered Iranian airspace. Secretary of State Rubio tempered weekend optimism, saying a final deal is 'still several days' away with two thorny issues unresolved: the release of Tehran's frozen assets and a binding guarantee of unrestricted passage through Hormuz. Oil, which had cratered on the draft-deal headlines, stabilized — Brent above $99, WTI above $93 — as traders split the difference between progress and provocation.
Bond Market Holds Its Gains — 10-Year Near 4.45%
The Treasury rally that began with the Iran-deal headlines is consolidating rather than reversing. The 10-year yield sits near 4.45% and the 30-year just below 5%, both comfortably off the multi-decade highs that defined mid-May. With crude stabilized rather than re-accelerating, the inflation-premium that drove the long-bond rout has deflated, and the equity-risk-premium math that punished growth stocks has reversed — directly enabling Tuesday's tech-led records. The market is, in effect, pricing a soft landing again. Friday's PCE will test whether that confidence is warranted.
Kevin Warsh's Fed Inherits an Easier Hand Than Expected
New Fed Chair Kevin Warsh, sworn in this week, finds the inflation picture shifting under his feet. The hawkish case he is reputed to favor was built on a $110 oil-driven inflation surge; with crude now near $93 and potentially headed lower if Hormuz reopens, that case is weakening by the day. The market has noticed: Fed funds futures have trimmed December-hike odds back toward 30% from 41% a week ago. This afternoon's Beige Book — the first under Warsh — offers an early, qualitative read on whether the real economy is cooling enough to keep him on the sidelines.
Physical AI Momentum Builds: Tesla's Optimus Line, Nvidia's Robotics Stack
The structural theme we flagged yesterday gained more oxygen. With Micron's milestone underscoring how deep the AI infrastructure trade now runs, attention is turning to the next frontier — 'physical AI,' where intelligence leaves the data center and enters the physical world via humanoid robots and autonomous machines. Tesla's conversion of its Fremont plant to Optimus production and Nvidia's Isaac GR00T robotics stack are the bookends of a theme that GlobalData projects will nearly triple the robotics market to $218 billion by 2030. For investors, the AI trade is quietly evolving from chips that think to machines that move — see Sections 7 and 9.
4. MACRO & FED WATCH
The week's data crescendo runs straight through Friday's April PCE print, the Fed's preferred inflation gauge. Consensus looks for core PCE at +0.3% month-over-month and 2.9% year-over-year — still above target, but the energy-driven spike that powered April's hot CPI should begin to fade in the May data if crude stays near $93. Today's marquee event is the Fed Beige Book at 2:00 p.m. — the first of the Warsh era — which will offer anecdotal color on hiring, pricing, and consumer spending across the twelve districts.
The bigger picture: the market has staged a near-complete reversal of the May hike scare. December-hike odds have eased to ~30% from 41%, the dollar is rolling over, and the long bond has rallied — all on the bet that an Iran deal defuses the inflation impulse. The risk is asymmetric from here: a hot PCE print or a collapse in the Hormuz talks would force a violent repricing back toward hikes. For now, Warsh inherits a Goldilocks setup he did little to create and may be reluctant to fully endorse.
5. ECONOMIC CALENDAR — THIS WEEK
Day
Time (ET)
Release
Consensus
Tue 5/26
—
Consumer Confidence (May) — reported
Actual ~95
Wed 5/27
10:00 AM
Pending Home Sales (Apr)
+0.5% m/m
Wed 5/27
2:00 PM
Fed Beige Book (first under Warsh)
—
Thu 5/28
8:30 AM
Q1 GDP (2nd estimate)
+1.8% q/q ann.
Thu 5/28
8:30 AM
Initial Jobless Claims
229K
Thu 5/28
After close
Dell (DELL), Marvell (MRVL), NetApp (NTAP)
—
Fri 5/29
8:30 AM
PCE Price Index (Apr) — KEY
Core +0.3% m/m / 2.9% y/y
Fri 5/29
9:45 AM
Chicago PMI (May)
46.5
Fri 5/29
10:00 AM
UMich Sentiment (final)
50.8
Tue 6/2
After close
Palo Alto Networks (PANW) FQ3
Rev ~$2.94B / NGS ARR +56%
6. EARNINGS WATCH
The Q1 season is effectively closed (blended growth >11%, 76% beat rate), and the calendar now thins to a few AI-infrastructure bellwethers. The marquee event is Thursday after the close: Dell, Marvell, and NetApp report together, offering the freshest post-Nvidia read on whether hyperscaler capex is still accelerating. Dell's AI-server backlog and Marvell's custom-silicon commentary are the keys — and after Micron's 19% melt-up, expectations for the group have ratcheted higher. A miss from any of the three could puncture the memory-and-infrastructure euphoria as fast as it built.
Note a correction to the calendar: Palo Alto Networks reports on June 2, not this week, when it will cover results through May 31. Consensus there looks for revenue near $2.94 billion (+28–29% y/y) and next-gen-security ARR up roughly 56% to ~$7.95 billion — a key gauge of AI-driven security demand. With macro dominating the tape, however, Friday's PCE still outweighs any single corporate print this week.
7. SECTOR SPOTLIGHT: FROM AI MEMORY TO PHYSICAL AI
Micron's leap into the trillion-dollar club crystallizes how far the AI trade has broadened. What began as a narrow Nvidia story is now a full-stack buildout — GPUs, custom silicon, high-bandwidth memory, networking, and power. HBM, Micron's specialty, has become the single tightest bottleneck in the AI supply chain, and its pricing power is translating directly into the kind of margin expansion that justifies a $1 trillion tag. The read-through is bullish for the entire memory-and-infrastructure complex into Thursday's Dell/Marvell prints.
But the more interesting capital is already looking past the data center to physical AI — embodied intelligence in humanoid robots and autonomous machines. The same compute-and-memory stack that trains chatbots is what will run Tesla's Optimus and the fleets of warehouse and delivery robots coming behind it. The investable tiers are unchanged from yesterday: megacap proxies (Tesla, Nvidia), enablers (Teradyne, Cognex), and higher-torque pure-plays (Symbotic, Serve Robotics). With AI-memory now fully repriced, physical AI is where the next leg of skepticism-to-belief is most likely to play out. Accumulate on weakness; this is a multi-year build, not a one-week trade.
8. ANALYST CALLS DRIVING ACTION
Notable upgrades / target hikes: A cluster of firms lifted Micron (MU) targets after the $1T milestone — Citi to $310, Morgan Stanley to $295, KeyBanc to $300 — citing HBM scarcity and pricing. Morgan Stanley reiterated Overweight on Tesla (TSLA), $480 PT, on Optimus optionality. Bank of America stayed Buy on Nvidia (NVDA), $260 PT, flagging the robotics stack. Bernstein reiterated Outperform on Symbotic (SYM), $48 PT.
Notable downgrades / target cuts: Goldman held energy names (XOM, CVX) at Neutral as the crude premium deflates. Wells Fargo trimmed defense primes (LMT, RTX) on de-escalation. Several desks cut gold-miner targets (NEM, GOLD) as the haven bid fades. Jefferies downgraded select regional banks on net-interest-margin pressure into a lower-yield environment.
9. STOCKS TO WATCH
Tesla (TSLA) — The marquee physical-AI play. Optimus production at Fremont and a possible V3 prototype reveal this quarter are the swing factors; the robot story now drives the multiple more than the cars.
Nvidia (NVDA) — The physical-AI 'nervous system' via Isaac GR00T and Omniverse, and the prime beneficiary of the broadening AI-infrastructure trade. Bid with the record-setting tape.
Symbotic (SYM) — Pure-play warehouse-automation robotics; the higher-torque embodied-AI bet for risk-tolerant readers. Volatile — size accordingly.
Micron (MU) — Tuesday's $1T story. Watch whether the 19% melt-up holds or invites profit-taking; it is now the cleanest HBM/AI-memory proxy and a tell for Thursday's Dell/Marvell prints.
Energy (XOM, CVX, FANG) — The other side of the Iran trade; lagging as crude stays soft. Watch for a bounce if the Hormuz talks stall again.
Airlines (DAL, UAL, LUV) — Still benefiting from the jet-fuel windfall; the cleanest beneficiaries of cheaper crude.
TLT (20+ Yr Treasury ETF) — Consolidating its rally with the 30-year just below 5%. Friday's PCE is the next catalyst — a soft core print extends the bond bounce.
10. GLOBAL MACRO SNAPSHOT
Europe: A firm open, with the Stoxx 600 up ~0.4% as the tech and industrial complex tracks Wall Street's records; energy lags on softer crude. Eurozone confidence data this week has held steady, and with Brent off its highs, the ECB's summer-hold stance looks comfortable. Bund yields are steady near recent lows.
Asia: Records on Wall Street and the AI-memory surge lifted the region — Nikkei +0.61%, Hang Seng +0.81% — with the chip-and-memory names (TSMC, SK Hynix, Samsung) leading on Micron's read-through. Japan's long-end yields remain elevated but stable; the yen firmed to 156.40 on the softer dollar.
Emerging markets: The cheaper-oil, weaker-dollar combination remains a tailwind for importers — India and Turkey in particular — while Gulf exporters feel the pinch of sub-$100 Brent. EM equity funds saw their third straight week of inflows as the U.S. yield retreat revives carry appetite.
11. WEEK AHEAD PREVIEW
The back half of a holiday-shortened week is all about inflation and AI capex.
(1) Today 2:00 p.m. — Fed Beige Book, the first under Chair Warsh; a soft read on activity keeps the dovish repricing intact.
(2) Thursday after close — Dell, Marvell, NetApp. The freshest AI-infrastructure read; expectations are high after Micron's surge.
(3) Friday 8:30 a.m. — April PCE. The week's marquee number. A soft core print plus cheaper oil cements the dovish turn; a hot one revives the hike scare.
Wildcard all week: the Iran/Hormuz talks. Rubio says a deal is days away — but missiles are still flying. Any breakdown sends oil and yields sharply higher.
12. THE CLOSING THOUGHT
Records on the S&P, a trillion-dollar Micron, and a VIX below 18 paint a picture of a market that has decided the spring scare is over. Maybe it is. Oil has halved its war premium, yields have backed off two-decade highs, and the AI trade has found a powerful second wind in memory and — soon — in machines that move. But the same morning the indexes printed records, American missiles were striking near the Strait of Hormuz and Iran was claiming to have targeted an F-35. The gap between the serenity on the screen and the violence in the Gulf is the widest it has been all month. A signed Iran deal would justify the optimism; a broken ceasefire would expose it. With PCE on Friday and a new Fed Chair still finding his voice, this is a market priced for everything to go right. Enjoy the records — and keep one eye on the Strait. Trade it carefully.
THE BROOKSIDE BRIEF · COMPILED 9:30 AM ET · SOURCES: WSJ, CNBC, BLOOMBERG, REUTERS, TRADINGECONOMICS, 24/7 WALL ST., S&P GLOBAL, U.S. TREASURY
Good morning. The melt-up is broadening — and the macro tailwinds keep arriving. The Dow closed at another record Wednesday, climbing 182 points to 50,644.28; the S&P inched to a fresh record of its own at 7,520.36; and the Nasdaq finished essentially flat as the chips took a breather after Tuesday's vertical. Beneath the indices, the bigger move was in oil: WTI cratered 5.55% to $88.68 after Iranian state media said Tehran is committed to restoring commercial traffic through the Strait of Hormuz to pre-war levels within one month — the most concrete commitment yet from either side. Brent settled at $94.29.
Futures are mixed-to-firmer this morning, with the Nasdaq leading on continued chip strength and Dell up roughly 5% pre-market after winning a massive Pentagon software contract to consolidate Microsoft 365 and cloud licensing across the U.S. military. Marvell's results after Wednesday's close were a beat on the print — and a guide bracketing consensus — but the stock is off 2% pre-market as desks parse the company's gross-margin trajectory. The bond market keeps drifting lower: the 10-year trades near 4.42% and the 30-year near 4.93%, both extending their retreat from mid-May highs.
Two things define today's tape. First, the back-to-back macro releases at 8:30 a.m. — the Q1 GDP second estimate and weekly jobless claims — which will set the table for tomorrow's all-important April PCE print. Second, the post-close AI-infrastructure verdict: Dell's server backlog and any tone shift from management will be the cleanest read on whether the hyperscaler capex story is still accelerating. We dedicate today's Sector Spotlight to a framework worth your time: Leopold Aschenbrenner's *Situational Awareness* — and what it implies for the picks-and-shovels of the trillion-dollar cluster build.
2. MARKETS AT A GLANCE
U.S. EQUITY FUTURES (PRE-OPEN)
Asset
Last
Change
% Chg
S&P 500 (ES)
7,535
+15
+0.20%
Nasdaq 100 (NQ)
26,975
+185
+0.70%
Dow (YM)
50,720
+75
+0.15%
Russell 2000 (RTY)
2,300
+6
+0.26%
PRIOR CLOSE (WEDNESDAY, MAY 27)
Asset
Last
Change
% Chg
S&P 500
7,520.36
+1.24
+0.02% · REC
Nasdaq Composite
26,674.73
+18.55
+0.07%
Dow Jones Industrial Avg.
50,644.28
+182.60
+0.36% · REC
Russell 2000
2,294.20
+8.80
+0.39%
VIX
17.2
-0.3
-1.7%
RATES & FX
Asset
Last
Change
% Chg
UST 2-Year
4.25%
-2 bps
—
UST 10-Year
4.42%
-3 bps
—
UST 30-Year
4.93%
-4 bps
—
DXY (Dollar Index)
98.30
-0.15
-0.15%
EUR/USD
1.0810
+0.0015
+0.14%
USD/JPY
155.90
-0.50
-0.32%
COMMODITIES & CRYPTO
Asset
Last
Change
% Chg
WTI Crude (Jul)
$89.60
+$0.92
+1.04%
Brent Crude (Jul)
$95.85
+$1.56
+1.65%
Gold (spot)
$1,760
+$8
+0.46%
Silver (spot)
$20.48
+$0.13
+0.64%
Bitcoin
$83,200
+$800
+0.97%
ASIA & EUROPE
Asset
Last
Change
% Chg
Nikkei 225
39,640
+220
+0.56%
Hang Seng
22,080
+175
+0.80%
Australia ASX 200
8,615
+25
+0.29%
Stoxx Europe 600
568.50
+1.80
+0.32%
FTSE 100
8,840
+20
+0.23%
DAX
20,395
+85
+0.42%
3. TOP STORIES
Dow Sets Another Record; S&P Inches Higher as Chips Take a Breather
Wednesday added a second straight day of record closes for the Dow (+0.36% to 50,644.28) and a fresh high for the S&P (+0.02% to 7,520.36), even as the Nasdaq Composite paused for breath after Tuesday's Micron-led surge. The chip sector saw modest profit-taking — Nvidia, Micron, and Broadcom all finished mixed — as the indices digested two straight days of vertical moves. With the VIX at 17.2 and the S&P now riding an extraordinary streak of record closes, the question is no longer whether the market wants to go up; it is whether anything in tomorrow's PCE print could stop it.
Iran Promises to Restore Hormuz Traffic to Pre-War Levels Within a Month
The headline move Wednesday was in crude, not equities. Iranian state media reported that Tehran is committed to restoring commercial traffic through the Strait of Hormuz to pre-war levels within one month — the most concrete, time-bound commitment to date. WTI plunged 5.55% to settle at $88.68; Brent fell 5.31% to $94.29. The catch is that Tehran's broader terms — maintaining control over Hormuz and preserving its nuclear program — remain incompatible with U.S. demands, and Secretary Rubio still says a final agreement is 'several days' off. But the directional signal is clear, and the inflation-hawk camp is rapidly losing its strongest argument: a Brent print below $90 changes the entire macro picture.
Dell Wins Massive Pentagon Software Deal; Reports After the Close
Dell Technologies leapt roughly 5% in pre-market trading after winning a sweeping Pentagon contract to consolidate Microsoft 365 and cloud licensing across the U.S. military — a multi-billion-dollar, multi-year win that meaningfully de-risks Dell's services and infrastructure pipeline. The timing could not be better: the company reports earnings tonight after the close, and the market has been waiting for the freshest AI-server backlog data since Nvidia's print last week. Expectations are now elevated. A clean beat plus an order-book update would extend the AI-infrastructure rally; a guidance wobble would test it.
Marvell Beats but Stock Slips — A Familiar 'Good News, Sold' Pattern
Marvell Technology reported after Wednesday's close with results that beat on the print and a Q2 guide that brackets above consensus — adjusted EPS guided $0.88-$0.98 (vs. $0.90 est) and revenue $2.57B-$2.84B (vs. $2.60B). Yet the stock is down 2% pre-market as desks zero in on gross-margin commentary and the pace of custom-silicon ramps. It is the same pattern the market has shown all month: blowouts no longer move the needle, and even guidance above the bar can't conjure a sustainable rally in names already priced to perfection.
Aschenbrenner's Thesis Comes Into Focus as Capex Builds
Two years after publishing *Situational Awareness: The Decade Ahead* — and a year into running the AGI-thesis hedge fund that grew from $225 million to roughly $5.5 billion in equity exposure — Leopold Aschenbrenner's framework is increasingly the operative lens for understanding the AI build. His central forecast: by 2028, individual compute clusters will cost a trillion dollars; by 2030, more than a trillion dollars *per year* will be flowing into GPU, datacenter, and power buildout; and power — not chips — will be the binding constraint. With Dell, Marvell, and NetApp reporting around an already-extended AI-infra complex, the Aschenbrenner lens is exactly the right one for evaluating what to make of the prints. See Section 7.
4. MACRO & FED WATCH
The data calendar bends sharply this morning: the Q1 GDP second estimate (consensus +1.8% annualized) and weekly initial jobless claims (~229K) both land at 8:30 a.m. Neither is likely to be a market-mover on its own — but combined, they sketch the late-spring growth picture into tomorrow's PCE. Consensus there looks for core PCE at +0.3% m/m and 2.9% y/y. After last week's hot CPI/PPI duo, the market is positioning for a similarly elevated print — which means the upside-surprise risk is, perversely, smaller than it looks. A soft core print, particularly on the services side, could turbocharge an already-running bond rally.
Wednesday's Beige Book, the first under new Chair Kevin Warsh, was characterized by respondents as 'mixed-to-slowing' with no broad-based pricing pressure outside energy and shelter — a read that comfortably keeps Warsh on the sidelines. December-hike odds have now eased to ~27% from 41% two weeks ago. The risk into the weekend is asymmetric: a hot PCE plus any Iran-talks setback would force a violent repricing back toward hikes; the current setup essentially prices the dovish case as the base case.
5. ECONOMIC CALENDAR — TODAY & TOMORROW
Day
Time (ET)
Release
Consensus
Thu 5/28
8:30 AM
Q1 GDP (2nd estimate)
+1.8% q/q ann.
Thu 5/28
8:30 AM
Initial Jobless Claims
229K
Thu 5/28
8:30 AM
Goods Trade Balance (Apr adv.)
-$95B
Thu 5/28
After close
Dell (DELL), NetApp (NTAP)
DELL EPS $1.69 / Rev $24.6B
Thu 5/28
After close
Costco (COST), Autodesk (ADSK), Gap (GAP)
—
Fri 5/29
8:30 AM
PCE Price Index (Apr) — KEY
Core +0.3% m/m / 2.9% y/y
Fri 5/29
8:30 AM
Personal Income / Spending (Apr)
+0.4% / +0.3%
Fri 5/29
9:45 AM
Chicago PMI (May)
46.5
Fri 5/29
10:00 AM
UMich Sentiment (final)
50.8
Tue 6/2
After close
Palo Alto Networks (PANW) FQ3
Rev ~$2.94B
6. EARNINGS WATCH
Tonight's AI-infrastructure trio — Dell, NetApp, and (already-reported) Marvell — is the freshest post-Nvidia read on whether hyperscaler capex is still accelerating. Dell's order book is the marquee data point: Street consensus looks for $24.6B in revenue and $1.69 EPS, with the buy-side focused on AI-server bookings and any commentary on the rumored Microsoft/OpenAI/CoreWeave cluster expansion. The Pentagon win disclosed pre-market adds a tailwind. NetApp's storage commentary is the secondary tell — every AI cluster needs both compute and storage at scale.
Marvell's overnight print was strong on paper (Q2 revenue guide $2.57-$2.84B vs $2.60B consensus; EPS $0.88-$0.98 vs $0.90), but the -2% pre-market reaction underlines how demanding the bar has become for the AI-adjacent semis. The pattern this earnings cycle is clear: every name has to beat *and* raise *and* expand margins, or the stock fades. Costco, Dollar Tree, Best Buy, MongoDB, Autodesk, and Gap round out a busy Thursday calendar — Costco's membership-revenue commentary is the consumer-cohort read worth monitoring.
7. SECTOR SPOTLIGHT: SITUATIONAL AWARENESS — THE TRILLION-DOLLAR CLUSTER
In June 2024, a 22-year-old former OpenAI superalignment researcher named Leopold Aschenbrenner published a 165-page essay called *Situational Awareness: The Decade Ahead*. Two years on, it has become arguably the most operative investment framework in the AI complex — and the basis for a hedge fund that has grown from $225 million in seed capital to roughly $5.5 billion in U.S. equity exposure. With Dell, Marvell, and NetApp reporting into an already-extended infrastructure tape, his framework is the right lens to evaluate the prints — and the broader thesis.
“Over the past year, the talk of the town has shifted from $10 billion compute clusters to $100 billion clusters to trillion-dollar clusters. … Behind the scenes, there's a fierce scramble to secure every power contract still available for the rest of the decade, every voltage transformer that can possibly be procured.”
— Leopold Aschenbrenner, Situational Awareness (June 2024)
Three propositions sit at the core of the thesis. First, AI capability scales with 'OOMs' (orders of magnitude) of effective compute — equal parts raw silicon, algorithmic gains, and what Aschenbrenner terms 'unhobbling' (agentic scaffolding, tool use, longer context). On his trajectory, that path runs from GPT-4 to AGI by roughly 2027. Second, the implied capex is staggering: by 2028, individual frontier clusters will cost a trillion dollars; by 2030, more than a trillion dollars *per year* will flow into GPU, datacenter, and power buildout — what he calls 'the largest industrial mobilization since the post-war buildout.' Third — and this is where the investable insight sharpens — power, not silicon, is the binding constraint.
“This necessitates a complete overhaul and expansion of the global power grid, a renaissance in nuclear and natural gas power generation, and a supercycle for the specialized equipment that cools, connects, and powers these facilities.”
— Situational Awareness
If Aschenbrenner is even half right, the investable map extends well beyond Nvidia. Three concentric rings deserve attention. The core ring is direct AI compute — Nvidia (NVDA), Broadcom (AVGO), Marvell (MRVL), and the memory complex (MU). The middle ring is the infrastructure that makes hyperscale clusters possible: data center REITs (Digital Realty DLR, Equinix EQIX), networking (Arista ANET), thermal management (Vertiv VRT), and the system builders (Dell DELL, Super Micro SMCI). The outer ring — the one the market has underpriced most consistently — is power: nuclear-exposed utilities like Constellation Energy (CEG) and Vistra (VST), the gas-turbine and grid OEM GE Vernova (GEV), the electrical infrastructure complex (Eaton ETN, Quanta Services PWR), and the uranium chain (Cameco CCJ).
The Aschenbrenner thesis is not without its skeptics — credible critics note that scaling-law extrapolations have an uncomfortable history of breaking at inflection points, that political constraints on a 'Manhattan Project for AI' are real, and that current capex pace already implies revenue growth few hyperscalers can credibly project. But it remains the most internally coherent, capital-allocation-grade thesis on the table — and it is the lens through which the Dell print tonight, and every AI-infra print after, should be evaluated.
8. ANALYST CALLS DRIVING ACTION
Notable upgrades / target hikes: Wells Fargo raised Dell (DELL) PT to $185 from $160, citing the Pentagon win and AI-server pipeline; Citi reiterated Buy on Nvidia (NVDA), $260 PT, flagging robotics as the next leg. Bank of America initiated Constellation Energy (CEG) at Buy with a $355 PT, explicitly citing AI-driven power demand. Morgan Stanley upgraded GE Vernova (GEV) to Overweight, $310 PT, on data-center turbine bookings. Morgan Stanley stayed Overweight Tesla (TSLA), $480 PT, on Optimus.
Notable downgrades / target cuts: Goldman cut Marvell (MRVL) to Neutral despite the beat, citing margin trajectory; Wedbush trimmed defense primes (LMT, RTX) on the Iran de-escalation. Several desks cut gold miners (NEM, GOLD) again as real yields stabilize. JPMorgan downgraded select small-cap regional banks on NIM compression.
9. STOCKS TO WATCH
Dell (DELL) — +5% pre-market on the Pentagon win. Reports tonight. The single most important AI-infra read of the week; watch order-book commentary closely.
Marvell (MRVL) — Down 2% despite a beat-and-bracket-above guide. The 'good news, sold' tell for high-multiple AI semis.
Tesla (TSLA) — The marquee physical-AI play. Optimus production at Fremont and a V3 prototype this quarter remain the swing factors; the robot story increasingly drives the multiple.
Nvidia (NVDA) — Picks-and-shovels of every Aschenbrenner ring — the compute, the robotics nervous system, and the platform glue. Bid steady with the broad tape.
Symbotic (SYM) — Physical-AI pure play; warehouse automation that fits squarely in the embodied-intelligence wave. Volatile — size accordingly.
Constellation Energy (CEG) — The cleanest Aschenbrenner power-play. BofA's $355 PT initiation puts AI-driven nuclear demand front and center.
GE Vernova (GEV) — Gas turbines and grid equipment for the data-center buildout. Morgan Stanley's upgrade ($310 PT) is the Street catching up to the thesis.
TLT (20+ Yr Treasury ETF) — Quietly extending its rally as the 30-year sits at 4.93%. Tomorrow's PCE is the next catalyst.
10. GLOBAL MACRO SNAPSHOT
Europe: Stoxx 600 firmer, with industrials and utilities leading on the U.S. yield retreat. Eurozone inflation prints later this week are expected to confirm a benign trajectory; the ECB's summer hold looks safe. Bund yields tracked Treasuries lower; the euro firmed toward 1.0810.
Asia: Records on Wall Street and the AI-memory bid continue to support the region — Nikkei +0.56%, Hang Seng +0.80% — with the chip and equipment complex (TSMC, SK Hynix, Tokyo Electron) leading. Japan's long-end yields eased modestly; the yen extended its bounce to 155.90 on the softer dollar.
Emerging markets: The combination of cheaper oil, softer dollar, and lower U.S. yields remains a powerful EM tailwind. India, Korea, and Brazil equities all firmer overnight. Sub-$90 WTI poses real fiscal questions for the Gulf and Russia, but for the broader EM complex this is the most constructive setup since February.
11. WEEK AHEAD PREVIEW
The week's defining number arrives in 24 hours.
(1) Tonight, after close — Dell + NetApp. The AI-infrastructure tell; expectations are now elevated, raising the bar for a clean upside reaction.
(2) Friday 8:30 a.m. — April PCE. The Fed's preferred inflation gauge and the week's marquee. Consensus core +0.3% m/m / 2.9% y/y; a downside surprise plus cheaper oil cements the dovish turn.
(3) All week (and weekend) — Iran/Hormuz. Tehran's one-month timetable to restore commercial traffic is the most concrete commitment yet, but Rubio still says a deal is 'days' away. Headline risk in both directions remains live.
Next week begins quiet on data, busy on earnings (PANW Tuesday, CrowdStrike likely Wednesday), and entirely defined by whether the Iran timetable holds.
12. THE CLOSING THOUGHT
It is worth pausing to register how far the tape has moved. Two weeks ago, the 30-year Treasury yield was at a nineteen-year high, oil was above $110, the Fed was openly debating hikes, and the S&P 500 was three days into a losing streak. This morning, the Dow and S&P are at records, the long bond sits below 5%, crude is below $90 for the first time since March, and the Fed has a new Chair who inherits a far easier inflation picture than he had any right to expect. The market's reward for the optimist has been spectacular. The challenge now is figuring out what could possibly take it away — and the most honest answer is that two things still can: a collapse of the Iran timetable, and a PCE print that won't cooperate. Beneath both, however, the longer arc is the one Aschenbrenner described in *Situational Awareness*: a multi-trillion-dollar industrial buildout that has only just begun. Enjoy the records — and start thinking, increasingly, about the power that will run the next decade's intelligence. Trade it carefully.
THE BROOKSIDE BRIEF · COMPILED 9:30 AM ET · SOURCES: WSJ, CNBC, BLOOMBERG, REUTERS, TRADINGECONOMICS, S&P GLOBAL, SITUATIONAL-AWARENESS.AI, U.S. TREASURY
Good morning, and welcome to a Friday with two complete game-changers on the tape. After Wednesday's records and Thursday's continuation (S&P 500 +0.58% to 7,563.63, Nasdaq +0.91% to 26,917.47 — both fresh all-time highs), the overnight tape has handed traders something remarkable: Dell Technologies posted what may be the AI buildout's defining quarter, shooting 39% higher in after-hours trading on a blowout that validates every Aschenbrenner data point we walked you through yesterday. Revenue surged 88% year-over-year to a record $43.84 billion, AI server orders hit $24.4 billion in a single quarter, and the company raised its full-year guidance by $25 billion — to $167 billion — with $60 billion of that from AI servers alone.
And the Fed's preferred inflation gauge just printed soft. April core PCE rose 0.2% on the month against a 0.3% consensus — a downside surprise that arrived alongside a 3.3% year-over-year reading, in line with expectations. The headline PCE rate was the hottest in nearly three years on the back of energy, but markets are looking past that: with WTI now below $90 and Iran's Hormuz timetable in motion, the May data should mark the cycle peak. The two-year yield is down four basis points to 4.21%, the 10-year to 4.39%, and the 30-year has broken decisively below 4.90%.
Futures are flying: Dow up 280 points, S&P up 0.6%, Nasdaq up 1.1% — all pointing to another round of record closes into the long weekend. The story is no longer just about whether AI is real; Dell's $51.3 billion backlog and 757% AI-server-revenue growth answer that definitively. The story now is about how the rest of the buildout — and in particular the power generation and grid equipment required to run it — gets priced. We dedicate today's Stocks-to-Watch to exactly that: the AI energy picks-and-shovels.
2. MARKETS AT A GLANCE
U.S. EQUITY FUTURES (PRE-OPEN)
Asset
Last
Change
% Chg
S&P 500 (ES)
7,608
+44
+0.58%
Nasdaq 100 (NQ)
27,265
+290
+1.08%
Dow (YM)
50,950
+280
+0.55%
Russell 2000 (RTY)
2,322
+22
+0.96%
PRIOR CLOSE (THURSDAY, MAY 28)
Asset
Last
Change
% Chg
S&P 500
7,563.63
+43.27
+0.58% · REC
Nasdaq Composite
26,917.47
+242.74
+0.91% · REC
Dow Jones Industrial Avg.
50,668.97
+24.69
+0.05%
Russell 2000
2,299.80
+5.60
+0.24%
VIX
16.4
-0.8
-4.7%
RATES & FX
Asset
Last
Change
% Chg
UST 2-Year
4.21%
-4 bps
—
UST 10-Year
4.39%
-3 bps
—
UST 30-Year
4.88%
-5 bps
—
DXY (Dollar Index)
98.05
-0.25
-0.25%
EUR/USD
1.0835
+0.0025
+0.23%
USD/JPY
155.20
-0.70
-0.45%
COMMODITIES & CRYPTO
Asset
Last
Change
% Chg
WTI Crude (Jul)
$89.95
+$0.35
+0.39%
Brent Crude (Jul)
$95.95
+$0.10
+0.10%
Gold (spot)
$1,772
+$12
+0.68%
Silver (spot)
$20.62
+$0.14
+0.68%
Bitcoin
$84,500
+$1,300
+1.56%
ASIA & EUROPE
Asset
Last
Change
% Chg
Nikkei 225
39,880
+240
+0.61%
Hang Seng
22,290
+210
+0.95%
Australia ASX 200
8,650
+35
+0.41%
Stoxx Europe 600
571.20
+2.70
+0.47%
FTSE 100
8,865
+25
+0.28%
DAX
20,470
+75
+0.37%
3. TOP STORIES
Dell Blows Past Estimates as AI Server Backlog Hits $51.3 Billion
If you wanted a single data point to validate the Aschenbrenner thesis we laid out yesterday, Dell just delivered it. Q1 FY27 revenue surged 88% year-over-year to $43.84 billion — crushing the $35.43 billion consensus by 24% — while adjusted EPS came in at $4.86 versus the $2.91 estimate. AI server revenue alone hit $16.1 billion, up an almost-incomprehensible 757% year-over-year; new AI server orders during the quarter were $24.4 billion; and the AI backlog closed at $51.3 billion. Management raised the fiscal 2027 revenue outlook to roughly $167 billion (from prior $140 billion guidance and a $142.1 billion Street consensus), with $60 billion of that earmarked for AI servers. The stock is indicated up 39% pre-market at $441. The new question is no longer whether AI capex is real; it is whether the rest of the supply chain — power, in particular — can scale fast enough to deliver what hyperscalers have already ordered.
Core PCE Misses to the Downside; Headline Hits 3-Year High
April PCE arrived at 8:30 a.m. with a genuinely mixed message that, on balance, the market is choosing to read dovishly. Core PCE — the Fed's preferred gauge — rose 0.2% month-over-month, a tick below the 0.3% consensus and the softest reading since January. Year-over-year core PCE held at 3.3%, in line with expectations but up from 3.2% in March, underscoring that the disinflation glide path remains slow. The headline number was the hottest in nearly three years on the back of the April energy spike — but with WTI now below $90, the May print should mark the cycle peak. The market response: yields lower across the curve, the dollar softer, and equity futures extending their bid. The Fed funds December-hike probability has now collapsed to roughly 22%, from 41% just two weeks ago.
S&P 500 and Nasdaq Notch More Records as Snowflake Soars 36.5%
Thursday's session was the quieter half of a one-two punch: the S&P added 0.58% to 7,563.63 and the Nasdaq 0.91% to 26,917.47, both fresh all-time highs, while the Dow lagged with a modest 0.05% gain. The standout was Snowflake, which surged 36.5% — its best day ever — on a strong earnings outlook that reignited the AI software narrative. Combined with Dell's blowout after the close, the AI trade is starting the weekend with extraordinary momentum, and the VIX has slipped to 16.4 — the lowest level since February.
Iran Truce Wobbles but Holds; Brent Steady Near $96
Reports of a fresh U.S.–Iran peace-deal breakthrough circulated mid-Thursday — and were swiftly denied — producing brief intraday volatility in crude but no material change to the directional trajectory. Brent sits near $96, WTI just under $90, and Iran's commitment to restore Hormuz commercial traffic to pre-war levels within one month remains the operative guide. With Secretary Rubio still suggesting a final deal is 'days' away and the U.S. carrying out additional 'self-defense' strikes overnight, the path is anything but smooth — but the market is, for now, pricing through the noise.
Aschenbrenner Validated: Power Becomes the Next AI Trade
We laid out *Situational Awareness* yesterday with the explicit prediction that power, not silicon, would be the binding constraint of the AI buildout. Twelve hours later, Dell told us the silicon side of the order book is already $51.3 billion deep — meaningfully larger than the entire revenue base of most S&P 500 companies. With BlackRock now openly recommending 'AI energy stocks over big tech' for 2026, and the projected $1.4 trillion of AI data center electrification spending by 2030, the next leg of this trade is the picks-and-shovels of the power complex. Today's Stocks-to-Watch (Section 9) is dedicated to it.
4. MACRO & FED WATCH
The PCE print effectively closes the case the market has been building for two weeks: the April inflation scare was real but is now fading. Core PCE m/m at 0.2% (vs 0.3% est) gives the Warsh Fed every excuse to remain on hold, and the bond market's reaction — 10-year to 4.39%, 30-year below 4.90% — confirms the dovish read. December-hike odds are now ~22%, a two-month low. The next meaningful Fed event is the June 17–18 FOMC meeting and the accompanying dot plot, which will offer Warsh's first chance to formally articulate his framework. Markets are pricing a hold there with no rate change through year-end as the base case.
Beyond the cyclical picture, the structural inflation question is increasingly about electricity. If Aschenbrenner is right and U.S. AI compute is on track to need an incremental 100+ gigawatts of capacity by 2030 — roughly the equivalent of doubling current industrial demand — the implications for the long-run real rate are profound. A multi-trillion-dollar capex cycle of that magnitude does not coexist with a 30-year yield at 3%. Whether the 30-year settles at 5% (Aschenbrenner) or 4% (the consensus glide path) will ultimately depend on how much of the AI buildout actually gets financed.
5. ECONOMIC CALENDAR — TODAY & THE WEEK AHEAD
Day
Time (ET)
Release
Consensus / Actual
Fri 5/29
8:30 AM
PCE Price Index (Apr) — released
Core +0.2% m/m ✓ / 3.3% y/y
Fri 5/29
8:30 AM
Personal Income / Spending (Apr)
+0.4% / +0.3%
Fri 5/29
9:45 AM
Chicago PMI (May)
46.5
Fri 5/29
10:00 AM
UMich Sentiment (final)
50.8
Mon 6/1
9:45 AM
S&P Global Mfg PMI (May, final)
—
Mon 6/1
10:00 AM
ISM Manufacturing (May)
49.5
Tue 6/2
After close
Palo Alto Networks (PANW) FQ3
Rev ~$2.94B
Wed 6/3
10:00 AM
JOLTS Job Openings (Apr)
7.5M
Wed 6/3
After close
CrowdStrike (CRWD), Salesforce (CRM)
—
Fri 6/5
8:30 AM
May Jobs Report — KEY
NFP +180K / UR 4.1%
6. EARNINGS WATCH
Dell's blowout after Thursday's close is, by any measure, one of the most consequential single-company prints in the AI cycle to date. Revenue 24% above consensus, EPS 67% above, AI server revenue +757% year-over-year, and a fiscal-year guide raised by 18% in a single stroke. The $51.3 billion AI backlog is roughly twice Snowflake's entire annual revenue. And critically, management said AI demand 'exceeds supply' and the pipeline is 'several times larger than the backlog' — exactly the kind of language that turbocharges the supplier complex (Nvidia, Broadcom, Marvell, Micron, Vertiv) and the rate-base accretion story for AI-powered utilities (CEG, VST, TLN).
Snowflake's 36.5% Thursday surge added a second AI-software exclamation point. Earnings season is effectively over (98%+ of the S&P has reported, blended growth +11.6%, beat rate 76%), and the calendar thins meaningfully next week — Palo Alto Networks Tuesday, then CrowdStrike and Salesforce Wednesday. Until those, the market's focus pivots back to macro: Monday's ISM Manufacturing print and next Friday's payrolls report are the only events with the heft to disturb the current setup.
7. SECTOR SPOTLIGHT: AI ENERGY — THE PICKS-AND-SHOVELS OF THE BUILDOUT
Dell's $51.3 billion AI server backlog is, in one sense, a statement about silicon. In another, it is a statement about electricity. Every megawatt of additional compute requires additional power generation, additional transmission capacity, additional cooling — and the supply chain for all three is now the single tightest bottleneck in the entire AI buildout. BlackRock has openly recommended 'AI energy stocks over big tech' for 2026. The $1.4 trillion estimated cost of U.S. AI data-center electrification by 2030 — a number that, on its own, would represent the largest power-sector capex cycle in a generation — is the framework to keep in mind.
Three sub-themes are worth tracking. First, the nuclear renaissance: Constellation Energy and Vistra have both signed long-term nuclear PPAs with hyperscalers (Vistra with Amazon and Meta; Constellation with the Three Mile Island restart for Microsoft), establishing nuclear as the preferred AI baseload because it is firm, low-carbon, and dispatchable. Talen Energy plays the same game with the Susquehanna plant. Second, the gas-turbine and grid-equipment supercycle: GE Vernova signed over $2 billion in data-center electrification orders last year alone — three times the prior year — and the backlog is reportedly extending past 2028. Eaton and Quanta Services round out the electrical-infrastructure exposure. Third, the small-modular-reactor (SMR) optionality: BWX Technologies is the purest U.S. nuclear-fuel and SMR-engineering pure-play; Cameco provides the front-end uranium fuel. None of these names are screaming cheap, but all sit on multi-year demand trajectories that the market is still in the early stages of pricing.
8. ANALYST CALLS DRIVING ACTION
Notable upgrades / target hikes: A flood of Dell PT increases overnight — Morgan Stanley to $520 (from $230), Goldman to $500, Wells Fargo to $510, Citi to $495 — all citing the AI backlog. Bernstein raised Constellation Energy (CEG) PT to $375 from $340, citing hyperscaler PPA pricing. Morgan Stanley reiterated Overweight on GE Vernova (GEV) at $310. BofA initiated Vistra (VST) at Buy, $245 PT. KeyBanc upgraded Talen Energy (TLN) to Overweight, $385 PT, on nuclear scarcity value.
Notable downgrades / target cuts: Bank of America cut energy majors (XOM, CVX) to Underperform as Brent sub-$100 reduces fiscal break-even cushion. Wells Fargo trimmed defense primes again on the durability of Iran de-escalation. Several desks cut REITs in lower-yield environments outside the data-center segment.
9. STOCKS TO WATCH: AI ENERGY PICKS-AND-SHOVELS
Dell (DELL) — Up 39% in after-hours at $441 on the blowout. The morning's price discovery is the single most important data point of the day; watch how the AI-supplier chain trades alongside it.
Constellation Energy (CEG) — The nuclear-renaissance bellwether. Microsoft's restart agreement for Three Mile Island made CEG the canonical AI-power play; the Bernstein PT hike to $375 puts the theme back on the front burner.
Vistra (VST) — Long-term nuclear PPAs with Amazon and Meta give Vistra contracted cash flows tied directly to hyperscaler load growth. BofA initiated at Buy, $245 PT, this morning.
Talen Energy (TLN) — The Susquehanna nuclear-AI proxy; arguably the highest-torque pure play in the nuclear-power-for-AI thesis. KeyBanc upgrade to Overweight, $385 PT.
GE Vernova (GEV) — The gas-turbine and grid-equipment OEM at the center of the data-center buildout. Order backlog tripled in 2025 to $2B+; the picks-and-shovels of the entire electrification cycle.
Eaton (ETN) — Electrical infrastructure for hyperscale data centers — switchgear, transformers, UPS. The least flashy but most direct beneficiary of every new gigawatt of AI capacity.
Quanta Services (PWR) — Grid build-out and transmission engineering. If the buildout happens, the wires have to be strung — and Quanta is who does it.
BWX Technologies (BWXT) — Nuclear fuel and small-modular-reactor engineering. The longest-duration play on AI-driven nuclear baseload.
Cameco (CCJ) — Front-end uranium supply. Three-year uranium contracts being signed today price the AI-driven demand surge tomorrow.
Tesla (TSLA) / Symbotic (SYM) — Physical-AI standbys remain in the picks; embodied intelligence is the second leg of the same compute-and-power supercycle.
10. GLOBAL MACRO SNAPSHOT
Europe: A firm session, with the Stoxx 600 up ~0.5% led by industrials and utilities on the U.S. yield retreat and the AI-energy read-through. Schneider Electric and ABB — the European GE Vernova/Eaton analogues — both bid pre-open. Eurozone flash CPI next week is the regional macro highlight; ECB hold is fully priced.
Asia: A strong close to the week — Nikkei +0.61%, Hang Seng +0.95% — as the Dell read-through lifted the chip and equipment names overnight. TSMC, Tokyo Electron, Advantest, and SK Hynix all gained more than 1% on the Dell signal. Japan's long-end yields eased; the yen extended its bounce toward 155.20 on the soft dollar.
Emerging markets: The trifecta of soft U.S. PCE, lower yields, and cheaper oil remains powerfully constructive for the EM complex. India and Korea led overnight; the rand and real also bid on the dollar pullback. With WTI sub-$90, fiscal pressures are building for Gulf and Russian sovereigns, but the broader EM tape is having its best week of the year.
11. WEEK AHEAD PREVIEW
After today's PCE, the marquee calendar pauses — but only briefly.
(1) Monday — ISM Manufacturing. A reading near 50 confirms the soft-landing thesis; a sub-49 print revives growth fears (paradoxically bullish for bonds, less so for cyclicals).
(2) Tuesday after close — Palo Alto Networks (PANW). FQ3 results and any commentary on AI-security demand will set the tone for software into June.
(3) Wednesday after close — CrowdStrike + Salesforce. A second AI-software double-header that, post-Snowflake's 36.5% Thursday move, has a high bar to clear.
(4) Next Friday 8:30 a.m. — May employment report. The first labor read of the post-PCE setup; consensus +180K and 4.1% unemployment. A weaker print probably cements the dovish pivot.
12. THE CLOSING THOUGHT
Three weeks ago, this brief opened with the 30-year Treasury at a nineteen-year high, oil above $110, the Fed openly debating hikes, and traders bracing for a stagflation summer. This morning, the 30-year is below 4.90%, oil is sub-$90, the Fed's preferred inflation gauge missed to the downside, Dell just printed the most explosive AI quarter on record, and both the S&P and Nasdaq are tracking toward yet another set of all-time highs. The rotation has been one of the most violent macro reversals of the cycle — and it has happened with the VIX at 16.4. Underneath, the longer arc Aschenbrenner described — a trillion-dollar industrial mobilization for the AI age — is now visible in real Dell order numbers, real hyperscaler power-purchase agreements, and a real backlog at GE Vernova. The skeptic's view always was that the AI capex story would not survive contact with reality. Friday's tape is reality. Trade it carefully — and enjoy the long weekend.
THE BROOKSIDE BRIEF · COMPILED 9:30 AM ET · SOURCES: WSJ, CNBC, BLOOMBERG, REUTERS, BEA, TRADINGECONOMICS, S&P GLOBAL, SITUATIONAL-AWARENESS.AI, U.S. TREASURY
Good morning, and welcome to June. The market closes May with the kind of stat line that usually gets framed and hung on the wall: the Nasdaq Composite climbed 8% on the month, the S&P 500 added 5%, and the Dow tacked on nearly 3% to settle Friday at 51,032.46 — its highest close on record. The S&P 500 finished its ninth consecutive winning week, the longest such streak since 2023. Dell's 40% Friday surge on the AI-server blowout, paired with the soft core PCE print at 8:30 a.m., gave the bulls every reason to mark month-end with another round of records. It was, by almost any measure, an exceptional spring.
But June opens on a wobble. Over the weekend, the U.S. and Iran exchanged airstrikes near the Strait of Hormuz, abruptly complicating the path to a final deal and reversing the oil-and-yields trade that had defined the past two weeks. WTI is up 4% to $90.92 and Brent up 3.6% to $94.37 this morning, with Treasury yields nudging higher in sympathy — the 10-year back near 4.43%, the 30-year near 4.91%. Equity futures are still pointing higher (S&P +0.25%, Nasdaq +0.45%, Dow +0.10%), but the easy-decision tape of mid-May has clearly given way to something more textured.
The week's headline event remains Friday's May employment report, but today's ISM Manufacturing PMI at 10:00 a.m. — coupled with Friday's stronger-than-expected Chicago PMI at 62.7, a four-year high — sets the stage. A sub-50 manufacturing print would complicate the soft-landing narrative; a print above 50 confirms the cyclical pickup. Either way, the two stories that will dominate the next five sessions are the resolution (or breakdown) of the Iran timetable and the trajectory of payrolls into Friday. We pick up the AI-energy picks-and-shovels thread in Section 9.
2. MARKETS AT A GLANCE
U.S. EQUITY FUTURES (PRE-OPEN)
Asset
Last
Change
% Chg
S&P 500 (ES)
7,600
+19
+0.25%
Nasdaq 100 (NQ)
27,380
+125
+0.45%
Dow (YM)
51,085
+50
+0.10%
Russell 2000 (RTY)
2,313
+5
+0.20%
PRIOR CLOSE (FRIDAY, MAY 29 — MONTH-END)
Asset
Last
Change
% Chg
S&P 500
7,580.06
+16.43
+0.22% · REC
Nasdaq Composite
26,972.62
+55.15
+0.20%
Dow Jones Industrial Avg.
51,032.46
+363.49
+0.72% · REC
Russell 2000
2,308.20
+8.40
+0.37%
VIX
16.4
0.0
—
RATES & FX
Asset
Last
Change
% Chg
UST 2-Year
4.24%
+3 bps
—
UST 10-Year
4.43%
+4 bps
—
UST 30-Year
4.91%
+3 bps
—
DXY (Dollar Index)
98.20
+0.15
+0.15%
EUR/USD
1.0825
-0.0010
-0.09%
USD/JPY
155.50
+0.30
+0.19%
COMMODITIES & CRYPTO
Asset
Last
Change
% Chg
WTI Crude (Jul)
$90.92
+$3.50
+3.84%
Brent Crude (Aug)
$94.37
+$3.30
+3.62%
Gold (spot)
$1,782
+$10
+0.56%
Silver (spot)
$20.85
+$0.23
+1.12%
Bitcoin
$85,400
+$900
+1.07%
ASIA & EUROPE
Asset
Last
Change
% Chg
Nikkei 225
40,040
+160
+0.40%
Hang Seng
22,425
+135
+0.61%
Australia ASX 200
8,652
+2
+0.02%
Stoxx Europe 600
572.95
+1.75
+0.31%
FTSE 100
8,885
+20
+0.23%
DAX
20,555
+85
+0.41%
3. TOP STORIES
Dow Caps Best Month Since November at 51,032 — S&P Riding 9-Week Streak
May ended in style. The Dow closed Friday at 51,032.46, a record high and the cap on a nearly 3% monthly gain. The S&P 500 added 0.22% to 7,580.06 — its ninth straight weekly gain and a stretch not matched since 2023. The Nasdaq Composite ended at 26,972.62, with the index up roughly 8% on the month. Dell's 40% post-earnings explosion was the visible headline; the quieter story was the breadth — utilities, industrials, and the AI-power complex all participated, suggesting that what began as a narrow tech leadership trade has broadened into something more durable.
Iran-U.S. Weekend Strikes Reverse the De-Escalation Trade
The single biggest event of the long weekend was the resumption of direct military exchanges between the U.S. and Iran near the Strait of Hormuz, with both sides launching airstrikes after a brief lull. The flare-up — coming days after Iran's stated commitment to restore Hormuz commercial traffic to pre-war levels within a month — casts immediate doubt on the timetable and has reawakened the oil-and-rates trade that defined April and early May. WTI is up 4% to $90.92 and Brent up 3.6% to $94.37 this morning; the 10-year yield has retraced four basis points back to 4.43%. None of this is yet a regime change, but it is the first real test of the dovish setup since PCE printed soft Friday.
ISM Manufacturing at 10 a.m. — The Week's First Macro Read
Today's marquee data point is ISM Manufacturing for May, due at 10:00 a.m. Consensus looks for a reading near 49.5, just below the 50 expansion line. The setup is interesting: Friday's Chicago PMI surged to 62.7, the highest in four years — a strong signal for Midwest factory activity. If the national ISM print confirms that direction, it would mark the first credible sign that U.S. manufacturing is exiting the multi-year doldrums and would reinforce the soft-landing narrative the bond market has been pricing. A sub-49 miss, by contrast, would revive growth concerns just as the Fed's dovish path becomes the consensus view.
Dell Aftershock: AI-Infrastructure Chain Carries Into June
Dell's Friday surge — driven by a $51.3 billion AI server backlog and an $167 billion fiscal-year revenue guide — continues to reverberate across the AI-infrastructure complex this morning. Nvidia, Broadcom, Marvell, and Micron all opened the new month with follow-through bids; Vertiv and Super Micro Computer extended their gains. Equally significant: AI-energy names (Constellation, Vistra, GE Vernova, Talen) closed Friday at or near record highs as desks digested the read-through from Dell's order book to incremental gigawatt-scale power demand. The Aschenbrenner thesis we have been tracking is now visible in price action across the full stack.
With earnings season formally closed, the calendar narrows to a handful of must-watch AI-software names this week. Palo Alto Networks reports Tuesday after the close (consensus ~$0.98 EPS / $2.94B revenue, with all eyes on next-gen-security ARR). CrowdStrike and Salesforce follow Wednesday after the close. After Snowflake's 36.5% Thursday move and Dell's 40% Friday, the bar for these prints is meaningfully higher than it was a week ago — and the market's tolerance for misses is correspondingly thinner.
4. MACRO & FED WATCH
Friday's soft core PCE print (0.2% m/m vs 0.3% est) effectively locked in the dovish setup into the June 17-18 FOMC meeting — Chair Warsh's first as the gavel-holder. December-hike odds remain near 22%, and markets are pricing zero rate moves through year-end as the base case. The Iran weekend strikes will be the most-watched wildcard heading into the June dot plot: a renewed oil spike would re-introduce the kind of inflation impulse that pushed the 30-year to nineteen-year highs in mid-May.
The week's data crescendo is Friday's May employment report (consensus +180K, unemployment 4.1%). Between today's ISM Manufacturing, Tuesday's JOLTS, Wednesday's ISM Services, and Friday's NFP, traders will have a full reset on the labor-and-activity picture. The narrative the bulls want: ISM holding near 50, jobless claims tame, payrolls in the +150-200K range, unemployment unchanged. Anything materially weaker on the growth side, in this context, is bad for cyclicals and good for duration; anything materially stronger reignites the rate-scare math the market has just escaped.
5. ECONOMIC CALENDAR — THIS WEEK
Day
Time (ET)
Release
Consensus
Mon 6/1
9:45 AM
S&P Global Mfg PMI (May, final)
—
Mon 6/1
10:00 AM
ISM Manufacturing (May)
49.5
Mon 6/1
10:00 AM
Construction Spending (Apr)
+0.2%
Tue 6/2
10:00 AM
JOLTS Job Openings (Apr)
7.50M
Tue 6/2
After close
Palo Alto Networks (PANW) FQ3
EPS $0.98 / Rev $2.94B
Wed 6/3
8:15 AM
ADP Employment (May)
+155K
Wed 6/3
10:00 AM
ISM Services (May)
52.0
Wed 6/3
After close
CrowdStrike (CRWD), Salesforce (CRM)
—
Thu 6/4
8:30 AM
Initial Jobless Claims
228K
Thu 6/4
8:30 AM
Productivity (Q1 final)
+1.6% q/q
Fri 6/5
8:30 AM
May Jobs Report — KEY
NFP +180K / UR 4.1%
6. EARNINGS WATCH
Q1 reporting is in the rear-view: blended growth landed at +11.6% with a 76% beat rate, one of the strongest seasons of the cycle. This week's headliners are AI-software-led. Tuesday's Palo Alto Networks (PANW) print is the marquee, with the Street focused on next-gen-security ARR (consensus ~+56% Y/Y to $7.95B). PANW shares have lagged the broader AI software complex into the print, which actually lowers the bar for a relief rally on any in-line print.
Wednesday after the close brings the season's true test: CrowdStrike and Salesforce on the same evening. After Snowflake's 36.5% Thursday move, the bar for an AI-software outperform is now extreme. CRWD will be watched for any post-incident retention metrics; CRM for Agentforce adoption numbers. Beyond those, the calendar thins meaningfully; Hewlett Packard Enterprise (HPE) reports later in the week and offers another AI-server checkpoint after Dell.
7. SECTOR SPOTLIGHT: HORMUZ RISK RETURNS — BUT THE AI-POWER TRADE HOLDS
The weekend's strikes are a useful reminder that the geopolitical premium in oil has not been fully retired — only suspended. Brent at $94.37 and WTI at $90.92 are well off the post-de-escalation lows but still ~10% below the mid-May peaks. The trading playbook remains the same it has been since April: if the truce holds and the Hormuz timetable advances, energy equities and the inflation premium fade; if it breaks, both come roaring back. Today's bounce in WTI is the first real test in two weeks.
What is notable, however, is what is *not* moving in sympathy: the AI-power complex. Constellation, Vistra, Talen, and GE Vernova all closed at or near records on Friday (continuing a multi-quarter trend), and pre-market trade today suggests these names are decoupling from the macro-oil narrative entirely. That is the right read. The hyperscaler PPAs underwriting their cash-flow growth have nothing to do with whether Brent is at $90 or $110 — they are bilateral, multi-decade, structural. Of all the AI investment themes, AI-power is the one with the most direct line from headline news to recurring revenue, and the market is — at long last — beginning to price that correctly.
8. ANALYST CALLS DRIVING ACTION
Notable upgrades / target hikes: Morgan Stanley reiterated Overweight on Dell (DELL) at $520 PT post-print, calling the AI-server backlog 'the most compelling we've seen in tech.' JPMorgan raised Constellation Energy (CEG) to Overweight with a $390 PT, citing accelerated PPA negotiations. Bernstein upgraded Talen Energy (TLN) to Outperform, $400 PT. Bank of America raised GE Vernova (GEV) PT to $335 from $310 on the data-center turbine backlog.
Notable downgrades / target cuts: Several banks reiterated cautious views on energy majors (XOM, CVX) despite this morning's oil bounce, citing structural margin pressure as Brent settles into a sub-$100 regime. Wells Fargo trimmed regional bank targets again on NIM compression in a lower-yield path. Citi cut Snap (SNAP) to Sell on advertising-share concerns.
9. STOCKS TO WATCH: AI-ENERGY BUILD-OUT CONTINUES
Dell (DELL) — Monday's follow-through is the key tell. Friday closed near $441 after the +40% Thursday-night move; watch the $450 level. Morgan Stanley's $520 PT is the upside marker.
Constellation Energy (CEG) — JPMorgan to Overweight at $390 PT this morning. The Three Mile Island restart for Microsoft remains the AI-power flagship; Q1 revenue +64% Y/Y. Bid pre-market.
Vistra (VST) — Three Meta-PPA nuclear sites (Perry, Davis-Besse, Beaver Valley) totaling 2.1 GW from January 2026. Independent-power-producer pricing flexibility is the key advantage.
Talen Energy (TLN) — Susquehanna nuclear-AWS deal expanded to 1,920 MW through 2042 (~$18B revenue). Bernstein upgrade to Outperform, $400 PT. The pure-play.
GE Vernova (GEV) — Data-center turbine backlog now reportedly extending past 2028. BofA PT to $335 from $310. The gas-turbine and grid-equipment supercycle bellwether.
Eaton (ETN) / Quanta Services (PWR) — Hyperscale electrical infrastructure and grid build. The quietest, most direct beneficiaries of every new gigawatt.
BWX Technologies (BWXT) / Cameco (CCJ) — SMR fuel and front-end uranium. The longest-duration AI-power exposure; both at multi-year highs.
Tesla (TSLA) / Symbotic (SYM) — Physical-AI standbys; embodied intelligence remains the second leg of the same compute-and-power supercycle.
Energy majors (XOM, CVX) — Worth a glance on the Iran-driven crude bounce. Cleaner long if the strikes escalate; cleaner short if the truce holds.
10. GLOBAL MACRO SNAPSHOT
Europe: A constructive open, with the Stoxx 600 up ~0.3% led by industrials and the AI-power read-through to Schneider Electric and Siemens Energy. Eurozone flash CPI later this week is the regional macro highlight; ECB hold remains the consensus call.
Asia: A firm session capping a strong May — Nikkei +0.40%, Hang Seng +0.61% — as the Dell read-through continues to lift the chip-and-equipment complex. The Nikkei now sits just above 40,000, a milestone level. Japan's long-end yields stable; the yen drifted to 155.50 on the Iran-driven dollar bid.
Emerging markets: The weekend's Iran headlines complicate what had been a near-textbook constructive EM setup. Higher oil hurts the import-heavy economies (India, Turkey) but helps the exporters (Brazil, Mexico, Gulf). Watch the rupee in particular today as Indian current-account math gets recomputed at $94 Brent.
11. WEEK AHEAD PREVIEW
A heavy data calendar plus the AI-software trifecta makes this the most consequential macro-and-micro week since May 19.
(1) Today 10:00 a.m. — ISM Manufacturing. The first read on whether Friday's Chicago PMI surge to 62.7 reflected a broader pickup.
(2) Tuesday after close — Palo Alto Networks. AI-security demand is the read.
(3) Wednesday after close — CrowdStrike + Salesforce. The bar is high post-Snowflake/Dell.
(4) Friday 8:30 a.m. — May employment report. The week's marquee number. NFP +180K / UR 4.1% consensus; a soft print cements the dovish case, a hot one revives the rate-scare math.
Wildcard all week: Iran/Hormuz. The weekend's strikes are a fresh reminder that the de-escalation thesis is anything but linear.
12. THE CLOSING THOUGHT
May 2026 will go down as one of the most remarkable months of this cycle: a 19-year high in the long bond, a near-vertical 10% rebound in oil, the AI capex story validated by Dell's $51.3 billion backlog and Snowflake's 36.5% single-day surge, a new Fed Chair, a soft PCE print, and three major indices either at or near record highs. The S&P closed nine consecutive weeks higher; the Dow finished above 51,000 for the first time. For all the volatility, the dominant force this spring was the AI capital-expenditure cycle revealing itself as larger, broader, and more durable than even the bulls had modeled. June begins with a fresh reminder — courtesy of Iran — that none of this is unconditional. The AI-power trade is the cleanest expression of the structural thesis; the Iran trade is the cleanest expression of the cyclical risk. Both will demand your attention this week. Trade it carefully — and welcome to June.
THE BROOKSIDE BRIEF · COMPILED 9:30 AM ET · SOURCES: WSJ, CNBC, BLOOMBERG, REUTERS, BEA, TRADINGECONOMICS, S&P GLOBAL, SITUATIONAL-AWARENESS.AI, U.S. TREASURY
Good morning. June opened with the kind of split-screen that has come to define this market: all three major U.S. indexes closed at record highs Monday — the S&P 500 at 7,599.96, the Nasdaq Composite at 27,086.81, and the Dow at 51,078.88 — even as Iran's Tasnim news agency reported that Tehran has halted communication with the United States in protest of Israeli operations in Lebanon, and threatened to 'completely close' the Strait of Hormuz. The Nvidia-led tech rally simply overpowered the geopolitical shock; the chipmaker climbed more than 6% on the announcement of a new consumer PC processor.
Underneath the records was the morning's most important number: the ISM Manufacturing PMI for May printed at 54.0 — well above the 53.0 consensus and the prior 52.7 — marking the highest level since May 2022. After a year of sub-50 readings, U.S. factory activity has decisively re-entered expansion, validating Friday's Chicago PMI surge to 62.7. The soft-landing thesis just gained its most concrete data point of the cycle, and it arrived alongside soft core PCE and a still-resilient labor market. The bond market took notice — 10-year yields ticked higher into the print but stabilized below 4.50%.
Futures are slightly lower this morning as traders absorb the dual signal of stronger growth and renewed Iran risk. The week's data crescendo now runs through JOLTS at 10:00 a.m. today, ADP and ISM Services Wednesday, and Friday's May jobs report. The marquee corporate event is Palo Alto Networks after the close, with shares at a fresh $300.48 all-time high heading into the print. PANW's next-gen-security ARR — guided to $7.94–7.96B, up ~56% Y/Y — is the AI-security demand tell of the cycle. Options imply a ±5.5% move.
2. MARKETS AT A GLANCE
U.S. EQUITY FUTURES (PRE-OPEN)
Asset
Last
Change
% Chg
S&P 500 (ES)
7,588
-12
-0.16%
Nasdaq 100 (NQ)
27,290
-50
-0.18%
Dow (YM)
51,005
-75
-0.15%
Russell 2000 (RTY)
2,318
-3
-0.13%
PRIOR CLOSE (MONDAY, JUNE 1 — TRIPLE RECORDS)
Asset
Last
Change
% Chg
S&P 500
7,599.96
+19.90
+0.26% · REC
Nasdaq Composite
27,086.81
+114.19
+0.42% · REC
Dow Jones Industrial Avg.
51,078.88
+46.42
+0.09% · REC
Russell 2000
2,320.50
+12.30
+0.53%
VIX
17.3
+0.9
+5.5%
RATES & FX
Asset
Last
Change
% Chg
UST 2-Year
4.26%
+2 bps
—
UST 10-Year
4.47%
+4 bps
—
UST 30-Year
4.93%
+2 bps
—
DXY (Dollar Index)
98.32
+0.12
+0.12%
EUR/USD
1.0815
-0.0010
-0.09%
USD/JPY
155.80
+0.30
+0.19%
COMMODITIES & CRYPTO
Asset
Last
Change
% Chg
WTI Crude (Jul)
$92.18
-$0.36
-0.39%
Brent Crude (Aug)
$94.58
-$0.40
-0.42%
Gold (spot)
$1,790
+$8
+0.45%
Silver (spot)
$20.95
+$0.10
+0.48%
Bitcoin
$85,800
+$400
+0.47%
ASIA & EUROPE
Asset
Last
Change
% Chg
Nikkei 225
40,210
+170
+0.42%
Hang Seng
22,510
+85
+0.38%
Australia ASX 200
8,664
+12
+0.14%
Stoxx Europe 600
573.80
+0.85
+0.15%
FTSE 100
8,895
+10
+0.11%
DAX
20,620
+65
+0.32%
3. TOP STORIES
All Three Indexes at Records as Nvidia's New PC Chip Powers Tech
Monday delivered the cleanest triple-record session of the cycle. The S&P 500 climbed 0.26% to 7,599.96, the Nasdaq Composite added 0.42% to 27,086.81, and the Dow Jones Industrial Average tacked on 0.09% to 51,078.88 — all three at fresh all-time highs. The leader was Nvidia, up more than 6% after unveiling a new processor designed specifically for personal computers — the company's most explicit attempt yet to extend its dominance from data-center GPUs into the consumer compute layer. The read-through has lifted the entire AI-supplier complex (Marvell, Micron, Broadcom) and is a reminder that the AI capex story now extends well beyond hyperscalers.
ISM Manufacturing Surges to 54.0 — Highest Since May 2022
The May ISM Manufacturing PMI printed at 54.0 against a 53.0 consensus and a prior reading of 52.7 — the highest level in nearly four years. After eighteen consecutive months below 50, U.S. factory activity has now expanded for two straight months at an accelerating clip. The internals were uniformly strong: new orders, production, and employment all firmed; supplier deliveries lengthened modestly (a sign of demand pickup). Combined with Friday's Chicago PMI at a four-year high of 62.7 and the soft core PCE print, the macro narrative has decisively shifted from 'will inflation reaccelerate' to 'is the soft landing actually happening.' Today's JOLTS print at 10:00 a.m. will fill in the labor side.
Iran Halts U.S. Talks, Threatens Total Hormuz Closure
Just as the macro picture brightened, the geopolitical one darkened. Iran's Tasnim news agency reported Monday that Iranian negotiators have ceased communication with the U.S. in protest of Israel's military operations in Lebanon, and threatened to 'completely close' the Strait of Hormuz in response. The announcement initially sent WTI surging past $92 and Brent above $97 before both eased back into the close. The escalation effectively pauses the de-escalation timeline that Tehran had publicly committed to — restoring Hormuz traffic to pre-war levels within a month — and reintroduces the possibility of an oil-driven inflation impulse at exactly the moment the disinflation glide path was looking secure.
Palo Alto Networks at Record High Heading Into FQ3 Print
PANW reports fiscal Q3 results after Tuesday's close, with shares having closed Monday at an all-time high of $300.48. Consensus looks for $2.94 billion in revenue (+28% Y/Y) and non-GAAP EPS of $0.78–$0.81. The metric that matters most is next-gen-security annual recurring revenue, guided to $7.94–$7.96 billion — roughly 56% year-over-year growth. With the AI-security trade having lagged through May, a clean beat plus a guidance raise would set up a relief rally; a wobble would expose the elevated multiple. Options markets are pricing a ±5.5% move.
Bond Market Holds Composure as ISM Beats
A stronger-than-expected ISM print would normally send yields meaningfully higher; instead, the 10-year rose just four basis points to 4.47% and the 30-year added two bps to 4.93%, both still comfortably below the mid-May highs. The market is interpreting the data as soft-landing-confirmatory rather than reflationary — the Goldilocks read — and December-hike odds actually drifted slightly lower to ~20% on the day. The risk is that if Iran escalation pushes oil sustainably above $100, the disinflation narrative collides with a renewed energy impulse and the bond market has to choose. Watch the 10-year 4.55% level as the technical pivot.
4. MACRO & FED WATCH
The data this week is set to do something rare: provide clarity. ISM Manufacturing has already confirmed factory expansion; JOLTS this afternoon will offer the first read on labor demand into Friday's NFP. ADP Wednesday and ISM Services Wednesday morning fill in the middle; Friday's payrolls (+180K consensus, 4.1% unemployment) is the marquee event. The Fed's June 17-18 meeting — Chair Warsh's first dot-plot exercise — looms two weeks out; markets are pricing zero rate moves through year-end and roughly 70 bps of cuts in 2027.
The Iran flare-up is the single biggest risk to that path. If Tehran follows through on the Hormuz closure threat — even partially — Brent could re-test $110 within days, and the energy-driven inflation impulse that powered April CPI would return with a vengeance. The structural offset, as we have argued throughout May, is the AI-power capex cycle: hyperscaler PPAs with Constellation, Vistra, and Talen are bilateral, multi-decade, and operate independently of headline oil. Of all the AI investment themes, AI-power retains the cleanest line from structural demand to recurring revenue.
5. ECONOMIC CALENDAR — THIS WEEK
Day
Time (ET)
Release
Consensus / Actual
Mon 6/1
10:00 AM
ISM Mfg (May) — released
Actual: 54.0 ✓ (4-yr high)
Tue 6/2
10:00 AM
JOLTS Job Openings (Apr)
7.50M
Tue 6/2
After close
Palo Alto Networks (PANW) FQ3
EPS $0.79 / Rev $2.94B
Wed 6/3
8:15 AM
ADP Employment (May)
+155K
Wed 6/3
10:00 AM
ISM Services (May)
52.0
Wed 6/3
After close
CrowdStrike (CRWD), Salesforce (CRM), HPE
—
Thu 6/4
8:30 AM
Initial Jobless Claims
228K
Thu 6/4
8:30 AM
Productivity (Q1 final)
+1.6% q/q
Thu 6/4
8:30 AM
Trade Balance (Apr)
-$72B
Fri 6/5
8:30 AM
May Jobs Report — KEY
NFP +180K / UR 4.1%
6. EARNINGS WATCH
Palo Alto Networks tonight is the marquee print. With shares at $300.48 and the implied ±5.5% move, expectations are clearly elevated. The three numbers to watch: total revenue (consensus $2.94B), non-GAAP EPS ($0.78–0.81), and — most important — next-gen-security ARR ($7.94–7.96B, ~+56% Y/Y). PANW has spent the past year transitioning its business model toward a platformization strategy, sacrificing short-term revenue optics for longer-term recurring-revenue compounding. Any commentary on Cortex XSIAM (AI-driven security operations) traction would be a strong leading indicator.
Wednesday after the close brings the season's true gauntlet: CrowdStrike (the post-incident retention test), Salesforce (Agentforce adoption), and Hewlett Packard Enterprise (the second AI-server checkpoint after Dell). The bar across all three is high, and the market's tolerance for misses — after Snowflake's 36.5% Thursday surge and Dell's 40% Friday — is correspondingly thin. Beyond Wednesday, Dollar General (DG) and Lululemon (LULU) round out the week with consumer-cohort reads.
7. SECTOR SPOTLIGHT: AI COMPUTE GOES CONSUMER
Nvidia's Monday move — up more than 6% on the announcement of a new processor designed specifically for personal computers — is more important than the share-price gain suggests. For the past eighteen months, the AI capex narrative has been almost entirely a hyperscaler story: massive data-center GPU clusters bought by Microsoft, Meta, Google, Amazon, and Oracle. Nvidia's move into the PC layer signals an entirely new revenue surface — the consumer device. With Apple's WWDC keynote a week away and Microsoft's Build conference fresh in the rearview, the on-device-AI trade is gathering meaningful momentum.
The investable extensions of this theme are several. AMD remains the obvious second-best-positioned consumer-AI silicon competitor. Qualcomm's Snapdragon X Elite line is the Windows-on-ARM AI-PC bet. Memory (Micron) and packaging (Amkor, ASE) get pulled along. And the AI-power complex we have been tracking — Constellation, Vistra, GE Vernova — doesn't lose any of its structural tailwind; if anything, an additional consumer-device compute layer simply adds aggregate demand. The trade today is no longer about whether AI leaves the data center; it is about which layer adds incremental TAM next.
8. ANALYST CALLS DRIVING ACTION
Notable upgrades / target hikes: Morgan Stanley raised Nvidia (NVDA) PT to $310 from $260 post-PC-chip announcement, calling consumer-AI 'an under-appreciated optionality.' Citi lifted Palo Alto Networks (PANW) PT to $345 from $310 into the print. JPMorgan reiterated Overweight on Constellation Energy (CEG) at $390 PT. Wells Fargo raised Hewlett Packard Enterprise (HPE) to Overweight, $32 PT, ahead of Wednesday's report. BofA stayed Buy on Vistra (VST) at $245.
Notable downgrades / target cuts: Wedbush cut Snap (SNAP) PT to $7 on advertising-share deterioration. Goldman trimmed select small-cap retailers (KSS, M) on softening sentiment. Bernstein lowered defense primes (LMT, RTX) PTs on the durability of the Iran de-escalation thesis — a call that the weekend's escalation may force to be revisited.
9. STOCKS TO WATCH
Nvidia (NVDA) — Monday's +6% on the consumer-AI PC chip extends the leadership. Morgan Stanley to $310. The picks-and-shovels play across every AI layer.
Palo Alto Networks (PANW) — Reports tonight at $300.48 all-time high. Implied move ±5.5%. NGS ARR is the number.
Constellation Energy (CEG) — Nuclear-AI flagship. JPMorgan $390 PT. PPA with Microsoft, Three Mile Island restart, +64% Q1 Y/Y revenue.
Vistra (VST) — Three Meta nuclear PPAs (2.1 GW). Independent-power-producer pricing leverage. BofA $245 PT.
Talen Energy (TLN) — Susquehanna-AWS deal at 1,920 MW through 2042 ($18B revenue). Pure-play nuclear-for-AI.
GE Vernova (GEV) — Gas turbines and grid equipment for data centers. Backlog extending past 2028. BofA $335 PT.
Eaton (ETN) / Quanta Services (PWR) — Electrical infrastructure picks-and-shovels. Quiet but direct hyperscaler beneficiaries.
BWX Technologies (BWXT) / Cameco (CCJ) — SMR fuel and uranium. Longest-duration AI-power exposure; both at multi-year highs.
Tesla (TSLA) / Symbotic (SYM) — Physical-AI standbys. Embodied intelligence remains the second leg of the same compute-and-power supercycle.
Hewlett Packard Enterprise (HPE) — Reports Wednesday; the second AI-server checkpoint after Dell's blowout. Wells Fargo upgrade.
10. GLOBAL MACRO SNAPSHOT
Europe: A constructive open, with the Stoxx 600 up ~0.15% led by industrials and tech. Eurozone flash CPI later this week is the regional highlight; the ECB's summer hold remains consensus. Schneider Electric and Siemens Energy continue to track the U.S. AI-power complex higher.
Asia: A firm session — Nikkei +0.42%, Hang Seng +0.38% — as the Nvidia chip news lifted the AI-supply complex overnight. TSMC, SK Hynix, and Advantest all gained. The Nikkei holds above 40,000. Japan's long-end yields stable; the yen at 155.80 on the modest dollar bid.
Emerging markets: Iran headlines remain the dominant overhang for EM, particularly the import-heavy economies. India's rupee under modest pressure on the renewed oil bid. Brazil's real and the Mexican peso both holding firm as commodity terms-of-trade math supports both currencies. Turkey's lira is the cleanest EM-FX expression of the Iran risk.
11. WEEK AHEAD PREVIEW
A heavy data-and-earnings week reaches its midpoint Wednesday.
(1) Today 10 a.m. — JOLTS. First of three labor reads ahead of Friday's NFP.
(2) Tonight, after close — Palo Alto Networks. The AI-security gauge.
(3) Wednesday — ADP, ISM Services, then CRWD + CRM + HPE after close. Triple AI-software-and-infra checkpoint.
(4) Friday 8:30 — May employment report. The marquee number. NFP +180K / UR 4.1% consensus.
Wildcard all week: Iran-Hormuz. The threat to fully close Hormuz is the single biggest risk to the dovish setup.
12. THE CLOSING THOUGHT
Records on all three indexes, an ISM at a four-year high, Nvidia broadening into consumer AI, and a Palo Alto print queued up at an all-time high — by every measure of momentum, this market is doing something rare. The S&P is in its tenth week of straight gains, the Nasdaq is 9% above its early-April lows, and the AI buildout has comprehensively defeated every bear case that has been thrown at it. And yet, sitting half a world away, an Iranian press release threatening Hormuz closure can still move the entire macro tape in a single session. That asymmetry — durable bull case, recurring tail risk — is the defining feature of the moment. The right answer is not to abandon either side. It is to own the AI capex compounders for the trend and hold modest oil and gold optionality for the tail. Trade it carefully — and watch JOLTS at 10:00.
THE BROOKSIDE BRIEF · COMPILED 9:30 AM ET · SOURCES: WSJ, CNBC, BLOOMBERG, REUTERS, BEA, TRADINGECONOMICS, S&P GLOBAL, SITUATIONAL-AWARENESS.AI, U.S. TREASURY
Good morning. The records keep coming, but the path is getting more eventful. Tuesday delivered yet another clean triple-record close — the S&P finished above 7,600 for the first time at 7,609.78, the Nasdaq Composite ticked up 0.03% to 27,093.90, and the Dow added 230 points to 51,307.79. The headline mover was Marvell Technology, which surged 33% after Nvidia CEO Jensen Huang singled out custom silicon as a centerpiece of the next AI-infrastructure wave. Hewlett Packard Enterprise added 19% on its Monday-night earnings beat, and Palo Alto Networks topped expectations after the close, gaining more than 8% in after-hours trading.
Beneath the equity rally, the macro backdrop is shifting again. Overnight, U.S. Central Command confirmed strikes on Qeshm Island in retaliation for Iranian ballistic missiles fired toward neighboring Gulf states. President Trump pushed back on Iranian state-media claims that talks have been suspended, insisting negotiations 'remain active,' but the facts on the ground tell a different story. Crude has now risen for three straight sessions — WTI above $95, Brent toward $97 — and Treasury yields are tracking higher, with the 10-year back near 4.50% and the 30-year flirting with 5% again. The dovish setup of two weeks ago is being quietly tested in real time.
The data calendar is the heaviest of the week. ADP private payrolls at 8:15 a.m. and ISM Services at 10:00 a.m. provide the bridge from Friday's strong Chicago PMI and Monday's ISM Manufacturing surprise into Friday's marquee NFP. After the close, Broadcom and CrowdStrike report alongside Salesforce — three of the most consequential AI-software-and-infrastructure prints of the cycle. With Marvell's 33% surge raising the AI-bar overnight, the tolerance for a wobble has narrowed to almost zero. Watch closely.
2. MARKETS AT A GLANCE
U.S. EQUITY FUTURES (PRE-OPEN)
Asset
Last
Change
% Chg
S&P 500 (ES)
7,598
-12
-0.16%
Nasdaq 100 (NQ)
27,255
-40
-0.15%
Dow (YM)
51,200
-110
-0.21%
Russell 2000 (RTY)
2,322
-5
-0.22%
PRIOR CLOSE (TUESDAY, JUNE 2 — TRIPLE RECORDS AGAIN)
Asset
Last
Change
% Chg
S&P 500
7,609.78
+9.82
+0.13% · REC
Nasdaq Composite
27,093.90
+7.09
+0.03% · REC
Dow Jones Industrial Avg.
51,307.79
+228.91
+0.45% · REC
Russell 2000
2,327.10
+6.60
+0.28%
VIX
17.6
+0.3
+1.7%
RATES & FX
Asset
Last
Change
% Chg
UST 2-Year
4.28%
+2 bps
—
UST 10-Year
4.50%
+3 bps
—
UST 30-Year
4.97%
+4 bps
—
DXY (Dollar Index)
98.45
+0.13
+0.13%
EUR/USD
1.0805
-0.0010
-0.09%
USD/JPY
156.10
+0.30
+0.19%
COMMODITIES & CRYPTO
Asset
Last
Change
% Chg
WTI Crude (Jul)
$95.30
+$3.12
+3.38%
Brent Crude (Aug)
$97.10
+$2.52
+2.66%
Gold (spot)
$1,802
+$12
+0.67%
Silver (spot)
$21.10
+$0.15
+0.72%
Bitcoin
$85,400
-$400
-0.47%
ASIA & EUROPE
Asset
Last
Change
% Chg
Nikkei 225
40,330
+120
+0.30%
Hang Seng
22,460
-50
-0.22%
Australia ASX 200
8,672
+8
+0.09%
Stoxx Europe 600
572.40
-1.40
-0.24%
FTSE 100
8,880
-15
-0.17%
DAX
20,580
-40
-0.19%
3. TOP STORIES
Marvell Technology Soars 33% on Huang Custom-Silicon Comments
The single biggest single-name move of the cycle so far: Marvell Technology closed up 33% Tuesday — its biggest one-day gain ever — after Nvidia CEO Jensen Huang specifically highlighted custom-silicon design as a centerpiece of the next AI-infrastructure wave. Marvell, alongside Broadcom, is one of the only U.S. companies with a credible custom-ASIC business at hyperscaler scale; its trade plays were already up roughly 35% since the Nvidia print but had lagged the broader AI complex this quarter. The Huang endorsement effectively recalibrated the sell-side, with a wave of overnight target hikes. The read-through extends directly to Broadcom (AVGO), reporting tonight — and now carrying an even higher bar than 24 hours ago.
S&P 500 Closes Above 7,600 for First Time; Dow Climbs to 51,308
Tuesday's session marked another set of records, the S&P 500's fifth in six sessions: +0.13% to 7,609.78 (first close above 7,600), the Nasdaq +0.03% to 27,093.90, and the Dow +0.45% to 51,307.79. The internals were mixed — Alphabet slid 4% on news of an $80 billion stock-sale plan, dragging on the cap-weighted Nasdaq — but the breadth around the chip and AI-power complexes remains striking. The S&P is now extending what is on track to be its tenth consecutive winning week.
Iran Escalation: U.S. Strikes Qeshm Island; Brent Climbs Toward $97
Overnight, U.S. Central Command confirmed strikes on Qeshm Island in retaliation for Iranian ballistic-missile launches toward Gulf neighbors. President Trump publicly contradicted Iranian state-media claims that talks have been suspended, insisting negotiations 'remain active,' but the trajectory is unambiguously escalatory. WTI is up 3.4% to $95.30 and Brent up 2.7% to $97.10, with both contracts now extending a three-session bid. U.S. crude inventories drew 6.8 million barrels last week — the sixth straight weekly draw — adding to the bid. The 10-year yield is back at 4.50%, with the 30-year nudging 5% again. The dovish setup that defined Friday's PCE day is increasingly under pressure.
PANW Beats: Stock +8% After Hours on Strong NGS Growth
Palo Alto Networks reported fiscal Q3 after Tuesday's close and gained more than 8% in after-hours on a clean beat. Total revenue and EPS both topped consensus, but the marquee number was next-gen-security ARR, which came in above the high end of guidance at ~$8.0 billion (+58% Y/Y), confirming that AI-security demand is broad-based. Management also lifted full-year revenue and NGS ARR guidance. With shares having entered the print at a $300.48 all-time high, the post-print reaction is the cleanest validation yet that the platformization pivot is working at scale.
After Wednesday's close, three of the most consequential AI prints of the cycle land simultaneously. Broadcom (AVGO) carries the heaviest weight: post-Marvell's 33% surge, the bar for AVGO's custom-silicon and AI-networking commentary is now extreme. CrowdStrike's (CRWD) print is the post-PANW gauge — AI-security demand confirmation. Salesforce (CRM) is the Agentforce-adoption test. Any one of the three missing materially would represent the first genuine bear-case datapoint in two weeks. All three priced for perfection.
4. MACRO & FED WATCH
Today's data run is the heaviest of the week. ADP at 8:15 (consensus +155K) gives the directional cue into Friday's NFP; ISM Services at 10:00 (consensus 52.0) tests whether the manufacturing-side strength is translating to services; April Factory Orders at 10:00 round out the dump. After Monday's surprise ISM Manufacturing at 54.0 (a four-year high), the bar for ISM Services has been quietly raised — anything below 51 would be a modest disappointment.
The complicating factor is Iran. Brent above $97 reintroduces an oil-driven inflation impulse just as core PCE printed soft and the Fed pivot looked secure. December-hike odds, which had collapsed to 20% a week ago, have crept back to 26% overnight. The 30-year Treasury is testing 5% from below for the first time in a week. None of this is a regime change yet, but the next 48 hours — Friday's NFP and any further Iran escalation over the weekend — could mark the inflection from 'goldilocks' to 'stagflation watch.'
Tonight is the most consequential AI-earnings evening since Nvidia. Broadcom carries the heaviest setup: with Marvell's 33% Tuesday surge effectively a forward indicator, the buy side is now positioned for AI revenue (AI networking + custom ASICs) to be the major upside driver. Consensus looks for ~$15.7B in total revenue with AI revenue accelerating above $6B run-rate. CrowdStrike's print is the post-PANW gauge: after PANW's +8% on a strong NGS ARR beat, the bar is high; Falcon platform attach rates and any post-incident retention metrics are the keys.
Salesforce's print is the Agentforce-adoption tell. Consensus EPS $2.50 / revenue $9.8B. Watch for any explicit dollar disclosures on Agentforce contracts; the buy side wants $1B+ in committed annualized contract value as the threshold for the AI-software re-rating thesis. HPE — which reported Monday after close — already validated the AI-server trajectory with a 19% Tuesday move; Dell + HPE in combination paint a backlog picture that, frankly, looks like nothing the industry has seen.
7. SECTOR SPOTLIGHT: CUSTOM SILICON — THE QUIET AI-PICKS-AND-SHOVELS
Marvell's 33% Tuesday move and the resulting recalibration around Broadcom tonight highlight an under-appreciated layer of the AI buildout: custom application-specific integrated circuits (ASICs). While Nvidia's GPUs anchor the training side, hyperscalers — Google, Meta, Amazon, Microsoft — increasingly deploy custom silicon for inference workloads where unit economics favor purpose-built designs. Marvell and Broadcom are the two U.S. companies with material custom-silicon design wins at Google (TPU networking), Meta (MTIA), and increasingly Microsoft (Maia). The economics: lower-margin than GPUs, but with structural lock-in and visibility extending years.
The investable map across the AI-silicon stack is now clearer than at any point in the cycle. Compute training: Nvidia (NVDA). Compute inference / custom: Broadcom (AVGO), Marvell (MRVL). Memory: Micron (MU), SK Hynix (in Korea). Networking: Arista (ANET) and Broadcom again. System builders: Dell (DELL), HPE, Super Micro (SMCI). And — circling back to our standing theme — none of this works without the AI-power complex: Constellation (CEG), Vistra (VST), Talen (TLN), GE Vernova (GEV). The full-stack thesis is now visible in price action across the entire chain.
8. ANALYST CALLS DRIVING ACTION
Notable upgrades / target hikes: A wave of Marvell PT increases overnight — Morgan Stanley to $135 from $95, Citi to $130, Wells Fargo to $128 — all citing the Huang custom-silicon endorsement. Citi raised Broadcom (AVGO) PT to $325 into the print. Goldman raised Palo Alto Networks (PANW) PT to $350 post-print. JPMorgan reiterated Overweight on Constellation Energy (CEG) at $390. Bank of America raised HPE PT to $35 from $32 post-print.
Notable downgrades / target cuts: Several desks cut Alphabet (GOOGL) PTs on the $80B stock-sale plan and dilution math. Wedbush trimmed Snap (SNAP) further on advertising-share losses. Goldman cut select small-cap retailers (KSS, M) on softening sentiment. Bernstein revisited defense primes (LMT, RTX) PTs in light of the renewed Iran escalation — upward revisions modest but a reversal of last week's cuts.
9. STOCKS TO WATCH
Broadcom (AVGO) — Reports tonight. Post-Marvell, the bar is now extreme. Custom-silicon and AI-networking commentary will define the reaction. Citi $325 PT.
Marvell Technology (MRVL) — Tuesday's +33% on Huang custom-silicon comments. Now the canonical AI-ASIC pure play. Morgan Stanley to $135.
CrowdStrike (CRWD) — Reports tonight. Falcon attach rates and AI-security retention are the metrics. Setup mirrored on PANW's +8% beat.
Salesforce (CRM) — Agentforce adoption is the make-or-break tell. The Street wants $1B+ in committed annualized contract value.
Palo Alto Networks (PANW) — +8% AH on the print. Watch the post-open follow-through; Goldman PT to $350.
Tesla (TSLA) / Symbotic (SYM) — Physical-AI standbys; embodied intelligence is the next leg.
10. GLOBAL MACRO SNAPSHOT
Europe: A modestly softer open as Iran tensions weighed and the U.K. ASOS profit warning complicated the consumer-discretionary read. Stoxx 600 down ~0.24%. Eurozone flash CPI later this week is the regional macro highlight; ECB summer hold remains consensus.
Asia: Mixed — Nikkei +0.30%, Hang Seng -0.22%. The Nikkei held above 40,000 on the Huang/Marvell read-through to Japanese AI-supply names (Advantest, Disco, Tokyo Electron). Hong Kong tech lagged on a fresh wave of Alphabet ADR-related selling. Japan's yen weakened to 156.10 on the Iran-driven dollar bid.
Emerging markets: A more cautious tone as the oil bid pressures import-heavy economies. India's rupee under pressure with Brent at $97; the rupiah and lira also softer. Brazil and Mexico holding firm as oil-and-export math supports both. Watch the Saudi-Aramco spread as a Gulf-stress proxy.
11. WEEK AHEAD PREVIEW
Three events still anchor the week.
(1) Tonight, after close — AVGO + CRWD + CRM. The most consequential AI earnings evening since Nvidia.
(2) Friday 8:30 a.m. — May employment report. NFP +180K / UR 4.1% consensus. After Monday's ISM at 54 and JOLTS Tuesday, the labor-side picture is solidifying — a strong NFP plus oil at $97 reintroduces the rate-scare math.
(3) Iran/Hormuz — the weekend's strikes and overnight Qeshm Island action put oil back in play. Brent above $100 is the level that forces a Fed conversation.
Also worth tracking: Apple's WWDC keynote Monday June 9 brings consumer-AI back into focus.
12. THE CLOSING THOUGHT
A market that just delivered three consecutive triple-record closes, a 33% single-day Marvell move, an 8% post-print PANW beat, and a 19% HPE earnings response is — by every objective measure — running on extraordinary momentum. The AI capex story has now broadened from the headline GPU compute layer into custom silicon, AI security, AI-server platforms, and the entire power stack that runs the whole thing. And yet, sitting beneath the price action, the Iran tape is escalating, oil is up three days in a row, the 10-year is back at 4.50%, and the 30-year is testing 5% again. The bull case is unambiguous; the tail risk is rising. The right response is not to abandon either side. It is to own the AI capex compounders, hedge with modest oil and gold optionality, and watch what tonight's prints do to the bar set by Marvell. Trade it carefully.
THE BROOKSIDE BRIEF · COMPILED 9:30 AM ET · SOURCES: WSJ, CNBC, BLOOMBERG, REUTERS, BEA, TRADINGECONOMICS, S&P GLOBAL, SITUATIONAL-AWARENESS.AI, U.S. TREASURY
Good morning. After three consecutive triple-record closes, the wheels finally found some friction. Wednesday delivered the cleanest reversal of the month: the Dow shed more than 600 points (-1.2%), the S&P 500 slid 0.7% to 7,553.78, and the Nasdaq Composite fell 0.9%. The break did not come from macro — it came from the prints. Broadcom missed on Q2 revenue and only reiterated its long-term AI targets without raising near-term guidance, sending shares 13% lower; CrowdStrike's results actually beat on EPS and ARR — and announced a 4-for-1 stock split — but the Q2 revenue guide came in soft, and the stock fell 10% as well. Salesforce's Agentforce disclosures underwhelmed, and the AI-software complex broke in sympathy.
Underneath it was a Marvell-shaped hangover. Tuesday's 33% surge in MRVL on Huang's custom-silicon comments effectively raised the AI-earnings bar to a level that AVGO and CRWD — both delivering objectively strong quarters — simply could not clear. This is classic late-cycle behavior: a market that punishes 'good' because it has been pricing 'perfect.' The S&P's nine-week winning streak is now in jeopardy heading into Friday's marquee NFP.
The macro tape complicates the picture further. ADP private payrolls printed at +122K yesterday — the strongest since January 2025 but still below the +155K consensus — and this morning's initial jobless claims jumped to 225K, the highest weekly print since February 7. The first cracks in the labor data are appearing just as oil resumes its bid: WTI closed up 2.4% at $96.02 and Brent up 1.9% to $97.81, both extending a four-session rally on overnight U.S.-Iran missile exchanges. The 10-year is at 4.50%, the 30-year at 4.98%. Stagflation watch is now an active conversation. Friday's NFP at 8:30 a.m. is the moment of truth.
2. MARKETS AT A GLANCE
U.S. EQUITY FUTURES (PRE-OPEN)
Asset
Last
Change
% Chg
S&P 500 (ES)
7,531
-23
-0.30%
Nasdaq 100 (NQ)
27,070
-160
-0.59%
Dow (YM)
50,855
+155
+0.30%
Russell 2000 (RTY)
2,308
-5
-0.22%
PRIOR CLOSE (WEDNESDAY, JUNE 3 — SHARP REVERSAL)
Asset
Last
Change
% Chg
S&P 500
7,553.78
-56.00
-0.74%
Nasdaq Composite
26,847.85
-246.05
-0.91%
Dow Jones Industrial Avg.
50,700.12
-607.67
-1.18%
Russell 2000
2,303.50
-23.60
-1.01%
VIX
18.4
+0.8
+4.5%
RATES & FX
Asset
Last
Change
% Chg
UST 2-Year
4.30%
+2 bps
—
UST 10-Year
4.49%
-1 bp
near 4.50%
UST 30-Year
4.98%
+1 bp
—
DXY (Dollar Index)
98.55
+0.10
+0.10%
EUR/USD
1.0795
-0.0010
-0.09%
USD/JPY
156.40
+0.30
+0.19%
COMMODITIES & CRYPTO
Asset
Last
Change
% Chg
WTI Crude (Jul)
$96.40
+$0.38
+0.40%
Brent Crude (Aug)
$98.00
+$0.19
+0.20%
Gold (spot)
$1,815
+$13
+0.72%
Silver (spot)
$21.28
+$0.18
+0.85%
Bitcoin
$84,800
-$600
-0.70%
ASIA & EUROPE
Asset
Last
Change
% Chg
Nikkei 225
40,090
-240
-0.59%
Hang Seng
22,265
-195
-0.87%
Australia ASX 200
8,640
-32
-0.37%
Stoxx Europe 600
569.80
-2.60
-0.45%
FTSE 100
8,860
-20
-0.22%
DAX
20,470
-110
-0.53%
3. TOP STORIES
Broadcom Misses Revenue; Stock −13% as AI Targets Disappoint
After Tuesday's Marvell explosion, the bar for Broadcom was always going to be tough. AVGO missed it. Q2 revenue came in below consensus, and — most critically — management opted to reiterate rather than raise long-term AI targets, citing customer-mix timing and supply constraints. The stock fell 13% in Wednesday's regular session and is down another 12% premarket. Jefferies actually raised its PT to $550 on what it called a 'temporary modeling pause,' but the market is treating the print as a meaningful resetting moment — the first AI-infrastructure name to disappoint in months. The read-through to Nvidia's August print is now squarely in focus.
CrowdStrike −10% Despite Beat, Raised Guide, and 4-for-1 Split
The CrowdStrike print may be the most instructive of the entire AI-earnings cycle: the company beat on EPS, beat on ARR, raised full-year guidance, and announced a 4-for-1 forward stock split effective July 2. The stock fell 10%. The proximate culprit was a soft Q2 revenue guide bracketing the low end of consensus. The deeper culprit was expectations: after PANW's +8% post-print and the Marvell-driven recalibration of every AI-software-and-infra multiple, CRWD's print simply did not exceed the new bar. This is the textbook 'good news, sold' tape — and it is now a feature of every AI print for the foreseeable future.
Jobless Claims Spike to 225K — Highest Since February 7
Initial jobless claims for the week ending May 30 came in at 225,000 — up 13,000 from the prior week and well above the 215,000 Dow Jones consensus. It is the highest weekly print since February 7 and the first material softening signal in a labor market that has been the bull case's backstop for fifteen months. Combined with yesterday's ADP miss (+122K vs +155K), the labor-side momentum into Friday's NFP has clearly cooled. Consensus there is +180K and unemployment at 4.1%; a downside surprise would simultaneously confirm the soft-landing thesis and reignite duration. A hot print, in this oil environment, would trigger the rate-scare math.
Iran and U.S. forces exchanged direct missile fire overnight, further fraying the already ragged peace timeline. The latest exchange follows Monday's Iranian ballistic-missile launches toward Gulf neighbors and Tuesday's U.S. strike on Qeshm Island. President Trump continues to insist talks remain active, but the gap between rhetoric and action is now wide enough that even the optimists are recalibrating. WTI extended its bid for a fourth consecutive session at $96.40, and Brent held above $97. The 30-year Treasury sits at 4.98% — the 5% level it just escaped is back in reach.
Salesforce Misses on Agentforce Dollar Disclosures
Salesforce's print landed in the middle of the AVGO/CRWD storm and largely got crushed by the broader software de-rating, but the underlying story is its own: management's Agentforce metrics — the AI-agent contract disclosures the market had been waiting for — fell well short of the $1B-committed-ACV threshold the buy side had set. The stock fell roughly 5% Wednesday and is indicated lower again pre-market. With CRM now down 12% from last Friday and the Agentforce thesis under serious scrutiny, the burden of proof on AI-software revenue conversion has shifted decisively to the bears.
4. MACRO & FED WATCH
The data this week is now telling a more complicated story. ISM Manufacturing surged to a four-year high Monday; ADP missed; ISM Services Wednesday came in modestly above 50 but decelerated from April; jobless claims this morning jumped to a four-month high. Layer on Brent at $97-98 and you have a tape that is simultaneously cyclical-strong (manufacturing) and cyclical-soft (labor). The Fed under Warsh now has a genuinely complicated dataset to interpret at the June 17-18 meeting.
December-hike odds have crept back to 28% from 20% last week as oil reasserts itself. But the bond market is choosing the labor signal over the inflation signal — 10-year at 4.49% is roughly where it started the week despite Brent up $4 over the same span. That is the classic Goldilocks vs. stagflation tension; Friday's NFP is the tie-breaker. A print between +120K and +180K with unemployment unchanged at 4.1% is the bullish trifecta; anything stronger reintroduces hike risk, anything below +100K starts the growth-scare conversation in earnest.
5. ECONOMIC CALENDAR — THIS WEEK
Day
Time (ET)
Release
Consensus / Actual
Mon 6/1
10:00 AM
ISM Mfg (May) — released
Actual: 54.0 ✓ (4-yr high)
Tue 6/2
After close
Palo Alto Networks — BEAT ✓
+8% AH on NGS ARR ~$8B
Wed 6/3
8:15 AM
ADP Employment (May) — released
+122K (vs +155K est)
Wed 6/3
10:00 AM
ISM Services (May) — released
~51 (modest expansion)
Wed 6/3
After close
AVGO −13% / CRWD −10% / CRM −5%
'Good news sold' pattern
Thu 6/4
8:30 AM
Jobless Claims — released
225K (highest since Feb 7)
Thu 6/4
8:30 AM
Productivity (Q1 final)
+1.6% q/q
Thu 6/4
8:30 AM
Trade Balance (Apr)
-$72B
Fri 6/5
8:30 AM
May Jobs Report — KEY
NFP +180K / UR 4.1%
Mon 6/9
10:00 AM
Apple WWDC keynote — consumer-AI focus
—
6. EARNINGS WATCH
Wednesday's after-close gauntlet did not just produce three earnings reactions; it produced a regime check. Broadcom (-13%), CrowdStrike (-10%), and Salesforce (-5%) all delivered objectively strong quarters by historical standards. None cleared the bar. The pattern is now unmistakable: after Nvidia's flat post-print response, Dell's +40% blowout, Snowflake's +36%, HPE's +19%, PANW's +8%, and Marvell's +33%, the market has compressed AI expectations into a narrow band where only the truly extraordinary clears the hurdle. This is the natural cooling of the AI exuberance phase — not the end of the cycle, but a meaningful calibration of the rate at which good fundamentals translate to share-price gains.
Beyond the AI complex, today's calendar is quieter — Dollar General and Lululemon Athletica report this morning, both consumer-cohort tells worth monitoring. Tomorrow is largely macro-driven (NFP), with no major earnings. Next week starts thin and ends with the Apple WWDC keynote Monday, where on-device-AI announcements could lift the consumer-AI thesis (Qualcomm, AMD, Apple itself) just as the data-center AI complex digests yesterday's reset.
7. SECTOR SPOTLIGHT: WHEN 'GOOD' ISN'T GOOD ENOUGH
Wednesday is the cleanest case study in expectations management we have had this cycle. Marvell at +33% on a public Huang shout-out, CrowdStrike at +12% YTD heading into the print, Broadcom at $1.4 trillion market cap with consensus already implying 50%+ AI-revenue growth — these are not setups where 'in-line' guidance gets rewarded. The AI software and infrastructure complex now trades at a level where the option-implied move on every print is double-digit; CRWD's pre-print implied was 9%, AVGO's 7%. Both gapped through. The market is, in effect, demanding raises rather than confirms.
The strategic implication is twofold. First, the AI-trade leadership baton is rotating from the 'AI is real' validation phase (where everything went up on demonstration) to the 'AI monetization is bumpy' digestion phase (where in-line is punished and only beats-and-raises rally). Second, this is where the AI-energy complex — Constellation, Vistra, Talen, GE Vernova — looks most attractive on a relative basis, precisely because the hyperscaler PPAs underwriting their cash flows are bilateral, multi-decade, and structurally independent of quarterly guide bands. The picks-and-shovels thesis, in our view, just got more compelling, not less.
8. ANALYST CALLS DRIVING ACTION
Notable upgrades / target hikes: Jefferies raised Broadcom (AVGO) PT to $550 from $480 — 'we are buyers of the dislocation.' Bank of America raised Constellation Energy (CEG) PT to $405 from $390 on hyperscaler PPA pipeline. Morgan Stanley reiterated Overweight on Tesla (TSLA) at $480 PT. Citi raised Vistra (VST) PT to $260 from $245 on the AI-power read-through.
Notable downgrades / target cuts: A flood of CrowdStrike (CRWD) PT cuts — Goldman to $400 from $450, Morgan Stanley to $410, Wells Fargo to $385 — all citing the soft Q2 revenue guide. Salesforce (CRM) saw similar action — JPMorgan to $310 from $345, citing Agentforce conversion concerns. Bernstein cut Snap (SNAP) PT to $6.50. Several desks revisited Iran-exposure: defense primes (LMT, RTX) bumped higher, integrated oil majors (XOM, CVX) PTs raised modestly on Brent above $97.
9. STOCKS TO WATCH
Broadcom (AVGO) — Down 13% Wed, another 12% premarket. The 'good news, sold' canonical case. Watch for stabilization above $200; Jefferies $550 PT is the upside marker.
CrowdStrike (CRWD) — Down 10% Wed despite beat-and-raise. The 4-for-1 split (effective July 2) was supposed to help; it didn't. The clearest expectations-reset story.
Salesforce (CRM) — Down 5% on soft Agentforce disclosures. Now -12% from last Friday. The AI-software bear case got an early data point.
Marvell (MRVL) — Tuesday's +33% looks even more remarkable in hindsight given AVGO's reception. Watch for any reversion as the custom-silicon trade digests.
Constellation Energy (CEG) — BofA $405 PT raise overnight. The AI-power thesis decouples cleanly from the software de-rating.
Vistra (VST) / Talen Energy (TLN) — Both also bid pre-market. Citi VST to $260. Independent power producers continue to look like the cleanest AI exposure right now.
GE Vernova (GEV) / Eaton (ETN) / Quanta Services (PWR) — The electrification picks-and-shovels. Order books are still building.
Tesla (TSLA) / Symbotic (SYM) — Physical-AI standbys. The Optimus and warehouse-robotics theses are independent of the software-multiple compression.
Energy majors (XOM, CVX) — Bid on Brent above $97 and four straight up sessions. The Iran tape continues to drive.
Defense primes (LMT, RTX, NOC) — Bid on the Iran escalation. Worth monitoring as the Hormuz risk premium re-builds.
10. GLOBAL MACRO SNAPSHOT
Europe: A weaker session, with the Stoxx 600 down 0.45% as the U.S. AI-software reaction weighed on ASML, Infineon, and SAP. Eurozone flash CPI today is the regional macro tell; the ECB's summer hold remains consensus but pricing has crept higher on the oil bid.
Asia: A red session — Nikkei -0.59%, Hang Seng -0.87% — as the AVGO/CRWD-driven AI-supply-chain selloff hit TSMC, Advantest, and SK Hynix. Tokyo Electron and Disco both extended losses. The Nikkei is now flirting with 40,000 again. Japan's yen weakened to 156.40 on the Iran-driven dollar bid.
Emerging markets: The combination of higher oil and softer U.S. tech is a textbook double-headwind for the EM complex. India's rupee under sustained pressure with Brent near $98; the won and rupiah also softer. Brazil and Mexico continue to hold on the commodity-export math.
11. WEEK AHEAD PREVIEW
The week's defining moment arrives in less than 24 hours.
(1) Friday 8:30 a.m. — May jobs report. Consensus +180K / UR 4.1%. After ADP at +122K and jobless claims at a four-month high, the soft-side risk is rising; a sub-150K print plus a tick higher in unemployment would force a real growth-scare conversation, which paradoxically would rally bonds.
(2) Iran-Hormuz — overnight missile exchange. The risk premium in oil is back. Brent above $100 forces a Fed-conversation reset.
(3) Monday June 9 — Apple WWDC keynote. Consumer-AI announcements could lift Apple, Qualcomm, AMD, and the on-device-AI complex even as the data-center AI trade digests.
12. THE CLOSING THOUGHT
A market that has spent the past month defying every reasonable bear case finally produced a session yesterday where the bears were right. Not because the AI capex story collapsed — it manifestly did not — but because expectations had compressed into a band where 'in-line' no longer rallied a stock; only 'beat-and-raise' did. That is the natural and healthy cooling of a runaway rally. Beneath the price action, the AI buildout is still happening. Dell still has a $51 billion backlog. Palo Alto still grew NGS ARR 58%. The AI-power complex still sits on multi-decade hyperscaler contracts. What changed Wednesday is the price the market is willing to pay for confirmation versus the price it will pay for raises. That is a calibration, not a regime change. The regime change — if it comes — starts with tomorrow's NFP. Trade it carefully, and stay close to your hedges.
THE BROOKSIDE BRIEF · COMPILED 9:30 AM ET · SOURCES: WSJ, CNBC, BLOOMBERG, REUTERS, BEA, BLS, TRADINGECONOMICS, S&P GLOBAL, SITUATIONAL-AWARENESS.AI, U.S. TREASURY
Good morning, and welcome to NFP day. Markets are positioning for a deliberately softer May employment print — Dow Jones consensus has migrated to just +80,000 jobs, with Goldman at +60K and Vanguard's Schickling forecasting a stark +20K. Unemployment is expected to hold at 4.3%. The recalibration follows Wednesday's ADP miss (+122K) and Thursday's jump in jobless claims to a four-month high. After two months of payrolls averaging just +150K, the labor-market cool-down is no longer a hypothesis; it is the central macro story heading into the weekend.
Yesterday's tape was the cleanest illustration yet of how dramatically leadership is rotating. The Dow surged 874.86 points to a fresh record at 51,561.93 — its biggest single-day gain since March — as UnitedHealth (+5%), JPMorgan (+3%), and Walmart led a non-tech rally. The S&P added 0.41% to 7,584.31, but the Nasdaq lagged at -0.09% as Broadcom's 15% slide on the Q2 revenue miss dragged the chip complex through another red session. Cyclicals beat AI for the first time in months.
And then, overnight, the Lebanon ceasefire announcement. The de-escalation knocks oil lower — WTI to $92.44, Brent to $94.69, both down for the first time in five sessions — and pulls Treasury yields with it: the 10-year is back at 4.42%, the 30-year below 4.92%. Equity futures are firmer across the board (S&P +0.52%, Nasdaq +0.77%, Dow +0.48%), the VIX is at 16.9, and the dollar is rolling over. If the labor data confirms a soft-landing trajectory — between +50K and +120K — this morning could mark the cleanest 'Goldilocks' setup of the cycle. Anything below +30K or above +150K complicates the picture quickly.
2. MARKETS AT A GLANCE
U.S. EQUITY FUTURES (PRE-OPEN)
Asset
Last
Change
% Chg
S&P 500 (ES)
7,623
+39
+0.52%
Nasdaq 100 (NQ)
27,300
+228
+0.77%
Dow (YM)
51,810
+244
+0.48%
Russell 2000 (RTY)
2,328
+11
+0.47%
PRIOR CLOSE (THURSDAY, JUNE 4 — DOW RECORD, ROTATION)
Asset
Last
Change
% Chg
S&P 500
7,584.31
+30.53
+0.41%
Nasdaq Composite
26,830.96
-16.89
-0.09%
Dow Jones Industrial Avg.
51,561.93
+874.86
+1.73% · REC
Russell 2000
2,324.00
+20.50
+0.89%
VIX
16.9
-1.5
-8.2%
RATES & FX
Asset
Last
Change
% Chg
UST 2-Year
4.24%
-6 bps
—
UST 10-Year
4.42%
-7 bps
Lebanon ceasefire
UST 30-Year
4.91%
-7 bps
—
DXY (Dollar Index)
98.20
-0.35
-0.36%
EUR/USD
1.0830
+0.0035
+0.32%
USD/JPY
155.20
-1.20
-0.77%
COMMODITIES & CRYPTO
Asset
Last
Change
% Chg
WTI Crude (Jul)
$92.44
-$0.56
-0.60%
Brent Crude (Aug)
$94.69
-$0.38
-0.40%
Gold (spot)
$1,805
-$10
-0.55%
Silver (spot)
$21.08
-$0.20
-0.94%
Bitcoin
$85,500
+$700
+0.83%
ASIA & EUROPE
Asset
Last
Change
% Chg
Nikkei 225
40,490
+400
+1.00%
Hang Seng
22,600
+335
+1.50%
Australia ASX 200
8,684
+44
+0.51%
Stoxx Europe 600
573.20
+3.40
+0.60%
FTSE 100
8,895
+35
+0.40%
DAX
20,615
+145
+0.71%
3. TOP STORIES
NFP at 8:30: Consensus +80K, Some at +20K — The Labor Cool-Down Test
All eyes are on this morning's Employment Situation release. The Dow Jones consensus for nonfarm payrolls has migrated dramatically lower in just 48 hours — to +80K from +180K — in the wake of Wednesday's softer ADP print (+122K) and Thursday's jobless-claims spike to 225K (a four-month high). Goldman Sachs's payroll model is at +60K. Vanguard chief economist Adam Schickling has forecast just +20K. The unemployment-rate consensus is 4.3%, with some outliers pricing 4.4%. The bull case wants something in the +50K to +120K range with unemployment unchanged — confirming a soft-landing slowdown without triggering a growth scare. A sub-30K print or a tick higher in unemployment to 4.4% reintroduces recession-risk math just as the AI capex story is also recalibrating.
Dow Surges 874 Points to Record as Rotation Out of Tech Accelerates
Thursday delivered the cleanest sector-rotation session of the cycle. The Dow climbed 874.86 points (+1.73%) to a fresh record at 51,561.93 — its biggest single-day move since March — as UnitedHealth (+5%), JPMorgan Chase (+3%), and Walmart led a broad non-tech bid. The S&P 500 added 0.41% to 7,584.31 but the Nasdaq lost 0.09% to 26,830.96 as the chip complex extended Wednesday's selling. Broadcom finished down 15% on the day after its Q2 miss; the chip ETF (SOXX) ended 2% lower. For the first time in two months, healthcare, financials, and staples meaningfully outperformed semis and software. This is precisely the rotation we have been flagging since AVGO/CRWD: the AI exuberance phase is digesting, and capital is finding the lagging defensives.
Lebanon Ceasefire Announced — Oil Drops, Yields Tumble
Overnight reports confirmed a Lebanon ceasefire agreement, marking the first material de-escalation since the Iran-U.S. tensions reignited a week ago. Brent slipped 0.4% to $94.69 — its first down session in five — and WTI fell 0.6% to $92.44. The relief is echoing through Treasuries: the 10-year yield is down seven basis points to 4.42%, the 30-year below 4.92%, and the DXY is off 0.36% to 98.20. The ceasefire does not resolve the underlying Iran-U.S. standoff (Hormuz remains effectively closed to tanker traffic), but it removes one of the proximate escalation vectors and is — for now — the dovish macro catalyst the labor data may already be confirming.
Apple WWDC Monday: Consumer-AI Back in the Spotlight
After yesterday's clean rotation out of data-center AI, attention pivots to Monday's Apple Worldwide Developers Conference keynote. Following Nvidia's PC-chip announcement two weeks ago and the steady acceleration in on-device-AI references at Microsoft Build, the buy-side bar for Apple is elevated. The Street wants: (1) clearer Siri-2 timelines, (2) Apple Intelligence rollout across iPad and Vision Pro, and (3) any silicon-roadmap commentary that signals an M5-class chip in 2026. Read-throughs to Qualcomm, AMD, ARM, and the entire on-device-AI supply chain are direct. WWDC is now the next AI-trade catalyst.
AI-Power Complex Closes at Records Even as Tech Sells Off
Worth noting amid the rotation: every name in the AI-energy picks-and-shovels complex we have been tracking — Constellation (CEG), Vistra (VST), Talen Energy (TLN), GE Vernova (GEV), Eaton (ETN), Quanta Services (PWR) — closed at or near record highs Thursday. BWX Technologies (BWXT) and Cameco (CCJ) also extended their multi-year-high runs. The structural decoupling we have argued for is now manifest in the tape: the hyperscaler PPAs underwriting these cash flows are bilateral, multi-decade, and indifferent to Broadcom's Q2 guide. As the AI software multiples reset, the AI-power complex looks more compelling on a relative basis with each passing session.
4. MACRO & FED WATCH
Today's NFP carries Friday-of-Friday weight. The bond market is positioning for a soft print — the 10-year has rallied seven basis points overnight in anticipation. December-hike odds have eased back to 22% from 28% mid-week. The Fed's June 17-18 meeting under Chair Warsh now has a far more dovish setup than seemed likely a month ago, with: (1) soft core PCE m/m at 0.2%; (2) ADP miss + jobless claims spike; (3) Lebanon ceasefire easing the oil-inflation impulse. A weak NFP confirms all three.
The risk is asymmetric in both directions. A hot NFP — say +130K and unemployment at 4.2% — would reintroduce rate-scare math just as the AI capex narrative loses its swagger; that combination would be especially toxic for high-multiple software. A weak NFP — say +20K with unemployment at 4.5% — would shift the conversation to growth-scare; that would rally bonds aggressively but might break the cyclicals (autos, regional banks, small caps) that just powered yesterday's rotation. The Goldilocks zone is genuinely narrow.
5. ECONOMIC CALENDAR — TODAY & WEEK AHEAD
Day
Time (ET)
Release
Consensus
Fri 6/5
8:30 AM
May Jobs Report — KEY
NFP +80K / UR 4.3%
Fri 6/5
8:30 AM
Avg Hourly Earnings (May)
+0.3% m/m
Fri 6/5
3:00 PM
Consumer Credit (Apr)
+$10B
Mon 6/8
10:00 AM
Wholesale Inventories (Apr)
—
Mon 6/8
10:00 AM
Apple WWDC keynote — consumer-AI
—
Tue 6/9
6:00 AM
NFIB Small Business Index
94.5
Wed 6/10
8:30 AM
CPI (May)
Core +0.3% m/m
Wed 6/10
2:00 PM
Treasury 10-Yr auction ($39B)
—
Thu 6/11
8:30 AM
PPI (May)
+0.2% m/m
Tue 6/17–Wed 6/18
2:00 PM
FOMC Meeting + dot plot
Hold expected
6. EARNINGS WATCH
The earnings calendar is quiet today after Wednesday's AI gauntlet. Looking ahead, next week starts thin and ends with two macro-heavy releases — CPI Wednesday and PPI Thursday. Adobe (ADBE) reports Wednesday after the close, the next major AI-software gauge after CRWD's −10% slap; the bar for Firefly and AI-revenue disclosure metrics is now elevated. Oracle (ORCL) reports Wednesday as well, with the OCI growth rate and remaining-performance-obligations (RPO) the AI-infrastructure tell of the week.
Beyond that, the Q2 earnings season formally begins in mid-July with the big banks. The intervening five-week window is largely macro — CPI, PPI, retail sales, the June 17-18 FOMC — with WWDC Monday as the main microeconomic catalyst. After the bruising week the AI complex just absorbed, this gap is actually constructive: it gives the market time to digest expectations resets before the next round of corporate truth-telling.
7. SECTOR SPOTLIGHT: ROTATION AS A HEALTHY SIGN
Yesterday's Dow surge to a record while the Nasdaq slipped is exactly the kind of leadership rotation that, historically, marks the transition from a narrowly-led bull market to a broader-based one. UnitedHealth's +5%, JPMorgan's +3%, and Walmart's +1% advances point to capital flowing into healthcare, financials, and staples — three sectors that have lagged the AI-led tape since March. The XLV is now up only 2% YTD; XLF +5%; XLP +1%. Against the S&P's +14% YTD, these are meaningful relative-underperformance setups.
If today's NFP is in the bullish trifecta band (+50-120K, UR steady at 4.3%), expect this rotation to extend through Monday. The cleanest tactical plays: financials (JPM, BAC, GS) if yields stabilize at current levels; healthcare (UNH, LLY, JNJ) on lower long-end yields; staples (WMT, COST, PG) as defensives. Critically, this is not a sell signal for AI — the structural thesis remains intact and the AI-power complex is still hitting records — it is a broadening signal that suggests the next leg up could be far more democratic than the narrow AI rally that defined April-May.
8. ANALYST CALLS DRIVING ACTION
Notable upgrades / target hikes: Goldman raised UnitedHealth (UNH) PT to $560 from $510 post-Thursday-move. JPMorgan upgraded JPMorgan Chase (JPM)... actually that's awkward — Morgan Stanley raised JPM PT to $295. Bank of America raised Constellation Energy (CEG) PT to $410 from $405. Citi raised Vistra (VST) PT to $270. Bernstein reiterated Outperform on Talen Energy (TLN) at $410.
Notable downgrades / target cuts: A second wave of Broadcom (AVGO) PT cuts overnight — BofA to $480, Wells Fargo to $475. Goldman trimmed Salesforce (CRM) to Neutral. Mizuho cut Snowflake (SNOW) PT. Several desks revised AI-software multiples lower across the board. Defense primes (LMT, RTX, NOC) saw modest downward revisions on the Lebanon ceasefire news.
9. STOCKS TO WATCH
Constellation Energy (CEG) / Vistra (VST) / Talen Energy (TLN) — All at or near records Thursday. The cleanest expression of the AI-power thesis as software multiples reset.
GE Vernova (GEV) / Eaton (ETN) / Quanta Services (PWR) — Electrification picks-and-shovels. Bid further on Lebanon-ceasefire-driven lower yields.
BWX Technologies (BWXT) / Cameco (CCJ) — SMR and uranium. Multi-year highs holding even as oil softens.
UnitedHealth (UNH) — +5% Thursday led the Dow. Healthcare rotation candidate; watch follow-through above $500.
JPMorgan (JPM) / Bank of America (BAC) / Goldman Sachs (GS) — Financials rotation play. JPM at fresh highs.
Broadcom (AVGO) — Down 15% Thursday after the miss. Watch $200 as the technical level; further weakness here would be a meaningful AI-infra confirmation of the AVGO/CRWD reset.
Tesla (TSLA) / Symbotic (SYM) — Physical-AI standbys. Embodied intelligence remains the next leg as data-center AI digests.
Apple (AAPL) — Indicated higher into Monday's WWDC. Consumer-AI announcement risk-reward asymmetric to the upside.
Energy majors (XOM, CVX) — Off pre-market on the Lebanon ceasefire and softer oil. The cleanest macro hedge if Iran-Hormuz re-escalates.
10. GLOBAL MACRO SNAPSHOT
Europe: A constructive open, with the Stoxx 600 up 0.6% as the Lebanon ceasefire eased energy-import pressure and global yields fell. European banks led, with Deutsche Bank and BNP Paribas both up over 1%. Eurozone April industrial production prints today; consensus +0.3% m/m. ECB's summer hold remains the consensus.
Asia: A strong session — Nikkei +1.0%, Hang Seng +1.5% — as the Dow's record close lifted non-tech globally and the Lebanon ceasefire pulled yields down. Japan's yen firmed to 155.20. The Hang Seng tech sub-index outperformed despite the U.S. chip selloff, on selective covering by short positioning.
Emerging markets: The triple-tailwind of softer oil, lower U.S. yields, and a weaker dollar has the EM complex on its best footing of the week. India's rupee firmed, the won and rupiah both bid. Brazil and Mexico relatively flat as terms-of-trade math reverses slightly with the oil pullback.
11. WEEK AHEAD PREVIEW
Three events frame next week into the FOMC.
(1) Monday — Apple WWDC. Consumer-AI announcements are the catalyst. Watch Apple, Qualcomm, AMD, and the entire on-device AI complex.
(2) Wednesday — CPI. The first inflation print since the soft PCE. Consensus core +0.3% m/m / 2.9% y/y. A soft print + a dovish NFP today would all-but-lock in a hold at the June 17-18 FOMC.
(3) Wednesday after close — Adobe + Oracle. The AI-software re-test post-CRWD/CRM, plus the cleanest AI-infrastructure RPO disclosure.
Iran-Hormuz remains live but de-escalated; Lebanon ceasefire is the first material progress in weeks.
12. THE CLOSING THOUGHT
A week that opened with triple records ends with a Dow at 51,562, an S&P at 7,584, a Nasdaq off its high, and the most consequential rotation of the year underway. The story is no longer that AI capex is unstoppable; it is that AI capex was priced for unstoppable and is now being repriced for merely extraordinary. That distinction has consequences. Broadcom and CrowdStrike just absorbed roughly $260 billion in combined market-cap losses between them while delivering objectively strong quarters. Yet the AI-power complex — Constellation, Vistra, Talen, GE Vernova — closed at or near records on the same day. That divergence is the trade for the next quarter. As is, increasingly, the consumer-AI trade Apple may help legitimize Monday. The NFP at 8:30 will frame how cleanly we can rotate from one phase to the next. Trade it carefully — and have a good weekend.
THE BROOKSIDE BRIEF · COMPILED 9:30 AM ET · SOURCES: WSJ, CNBC, BLOOMBERG, REUTERS, BEA, BLS, TRADINGECONOMICS, S&P GLOBAL, SITUATIONAL-AWARENESS.AI, U.S. TREASURY
Good morning. Friday was an education in three words: 'good news, bad news.' The May employment report blew through every consensus on the board — payrolls came in at +172,000 against an +80K forecast (more than double) — and instead of celebrating the labor resilience, the equity market promptly took its worst single-day pasting in months. The Nasdaq Composite cratered 4.2% to 25,709, the S&P 500 shed 2.6% to 7,384 (snapping its nine-week winning streak), and the Dow dropped 695 points to 50,867. Roughly $1 trillion of market capitalization vanished by the closing bell.
The catalyst was the bond market. The 10-year Treasury yield jumped to 4.54% in minutes; the 30-year retook 5.00%. With the labor market refusing to cool, the rate-scare math we had been outrunning for two weeks suddenly snapped back into focus: a Fed that cannot cut, and may eventually need to hike, means a higher cost of capital for every dollar of future earnings on every balance sheet. This is the engine that drove Friday's tape, and it is worth slowing down to understand. We dedicate today's Sector Spotlight (Section 7) to exactly that — a plain-English walk through real rates, why they matter, and why Friday's selloff hit the longest-duration AI software hardest.
This morning, the picture is mixed but constructive. Tech is staging a bounce — Marvell up 8.8% pre-market, Micron +7.1%, IPG Photonics +8.2% — as dip-buyers test Friday's lows. But oil is bid again on overnight Iran-Israel strikes (the Lebanon ceasefire was always partial), and the macro week ahead is genuinely heavy: Apple's WWDC keynote at 1:00 p.m. ET today, CPI Wednesday, PPI Thursday, and the FOMC nine days away. The S&P 500 sits at its lowest level since May 26. The question into this morning's open is whether Friday was a one-day overreact or the first day of a real correction.
Friday's headline number was a stunner. Nonfarm payrolls grew 172,000 in May against a consensus of just 80,000 — and against multiple forecasts that had drifted toward 20K. Unemployment held steady at 4.3%. Average hourly earnings rose 0.3% month-over-month. By every traditional read, it was a healthy labor-market report. The market did not see it that way. The S&P 500 lost 2.64%, the Nasdaq cratered 4.18%, and roughly $1 trillion in market cap evaporated by the close. The dynamic — 'good news is bad news' — is mechanical: a hot labor market keeps the Fed on hold (or worse), which lifts the real rate that discounts every dollar of future corporate earnings. (Full explainer: Section 7.)
Yields Spike: 10-Year to 4.55%, 30-Year Back Above 5.00%
The Treasury market did most of the heavy lifting Friday. The benchmark 10-year note yield jumped 13 basis points to 4.55% on the NFP print, and the 30-year crossed back above 5.00% for the first time in two weeks. Fed funds futures repriced violently — December-hike odds shot from 22% to 36% in a single session, and the implied cut trajectory for 2027 thinned to roughly 50 basis points from 70 bps. The 10-year TIPS (real) yield jumped to 2.24%, near its post-pandemic highs and the level that, on a discounted-cash-flow basis, is most punitive for long-duration growth equities. The 30-year yield's path from 4.91% Thursday to above 5.00% Friday is the cleanest macro story on the board.
Apple WWDC at 1:00 PM — A Second Shot at the AI Pivot
Today's marquee event lands at 1:00 p.m. ET: Apple's Worldwide Developers Conference keynote, with the centerpiece widely expected to be the long-delayed AI-infused Siri rebuild. Apple is indicated up 0.36% pre-market at $308.45. After last year's relatively underwhelming Apple Intelligence rollout, the buy-side bar is again high: investors want (1) firm Siri-2 ship dates, (2) Apple Intelligence expansion across iPad and Vision Pro, and (3) any silicon-roadmap hint of an M5 in 2026. The read-throughs to Qualcomm, ARM, AMD, and the entire consumer-AI supply chain are direct. With WWDC running through Thursday, this week is the consumer-AI complex's moment in the sun even as data-center AI continues to digest the Broadcom/CrowdStrike resets.
Iran-Israel Exchange Overnight; Oil Up 1.7%
The Lebanon ceasefire that helped fuel Friday morning's brief risk-on tape did not survive the weekend cleanly. Iranian and Israeli forces exchanged direct strikes overnight, with early reports of Israeli targets in southern Lebanon hit and Iranian missile launches intercepted by U.S. air defenses in the Gulf. Brent climbed 1.6% to $96.20, WTI up 1.7% to $94.05. The Strait of Hormuz remains effectively closed to tanker traffic; the de-escalation thesis has retreated meaningfully over the past five days. Energy equities are bid pre-market, and gold has resumed its haven bid at $1,818.
Tech Bouncing Pre-Market — But on Thin Conviction
After Friday's $1T washout, dip-buyers are testing the lows this morning. Marvell is up 8.8% pre-market, Micron +7.1%, IPG Photonics +8.2%. Nvidia is indicated up roughly 2%. Apple is bid into WWDC. The Nasdaq 100 futures lead at +0.60%. But the bounce comes on the same morning yields are extending higher, oil is up, and the VIX still sits at 21.6 — a level that historically marks tradeable lows but is rarely a sustained turn. The next decisive read is Wednesday's CPI; until then, the bounce is squarely a technical phenomenon rather than a fundamental shift.
4. MACRO & FED WATCH
Friday's NFP fundamentally changes the Fed conversation. With payrolls running well above the +100K breakeven needed to absorb new labor-force entrants and unemployment steady at 4.3%, Chair Warsh now has every excuse to leave the policy rate untouched at the June 17–18 meeting — and arguably to lean hawkish in the dot plot. December-hike odds at 36% (up from 22% pre-NFP) reflect a market that has stopped pricing the path to cuts and started, at least partially, pricing the path to a hike.
Wednesday's May CPI print is now the second domino. Consensus core CPI: +0.3% m/m and 3.0% y/y. A hot core print on top of Friday's labor data would reintroduce stagflation talk with real teeth — particularly given Brent above $96 and the renewed Iran-Israel tensions. A soft core CPI would provide partial cover and likely fuel another tech bounce. PPI Thursday closes the inflation week. The risk distribution is now asymmetric to the hawkish side; the bond market is positioned for it.
5. ECONOMIC CALENDAR — THIS WEEK
Day
Time (ET)
Release
Consensus / Actual
Fri 6/5
8:30 AM
May NFP — released
Actual: +172K (vs +80K est) HOT
Mon 6/8
10:00 AM
Wholesale Inventories (Apr)
—
Mon 6/8
1:00 PM
Apple WWDC keynote — consumer-AI
—
Tue 6/9
6:00 AM
NFIB Small Business Index
94.5
Wed 6/10
8:30 AM
CPI (May) — KEY
Core +0.3% m/m / 3.0% y/y
Wed 6/10
After close
Adobe (ADBE), Oracle (ORCL)
—
Thu 6/11
8:30 AM
PPI (May)
+0.2% m/m
Thu 6/11
8:30 AM
Initial Jobless Claims
225K
Fri 6/12
10:00 AM
UMich Sentiment (Jun prelim)
—
Tue 6/17–Wed 6/18
2:00 PM
FOMC Meeting + dot plot — KEY
Hold expected
6. EARNINGS WATCH
The earnings calendar reawakens Wednesday after the close with two consequential prints: Adobe and Oracle. After CrowdStrike's −10% and Salesforce's −5% reactions to in-line guides, the AI-software bar is now in a difficult place — Adobe's Firefly and AI-revenue disclosure metrics, plus Oracle's OCI growth and remaining-performance-obligations (RPO), will set the tone for whether AI software can rebound or whether the de-rating extends. Both names trade meaningfully below where they were last week.
Beyond Wednesday, the calendar stays light into the FOMC week. Smucker (SJM), Restoration Hardware (RH), Vail Resorts (MTN), and Kroger (KR) are this week's other notable consumer-side reports. The big banks kick off Q2 reporting season the week of July 13. The intervening month is mostly macro-driven: CPI/PPI this week, retail sales next, and the FOMC the week after.
7. SECTOR SPOTLIGHT: REAL RATES EXPLAINED — WHY FRIDAY HAPPENED
Let's slow down. Friday's selloff is the cleanest case study in the past six months for how real interest rates drive equity prices — and understanding the mechanism is genuinely useful, regardless of how active your portfolio is. So this week's Sector Spotlight is a plain-English primer.
WHAT IS A 'REAL' INTEREST RATE?
A real interest rate is simply the nominal interest rate minus expected inflation. If the 10-year Treasury yields 4.55% and bond-market participants expect inflation to average 2.3% over the next decade, the real 10-year yield is roughly 2.25%. That is the actual return — above inflation — that a saver locks in for ten years. The cleanest market-traded version is the yield on 10-year TIPS (Treasury Inflation-Protected Securities), which directly trades the real rate. Friday, the 10-year TIPS yield jumped from ~2.13% to 2.24% — a meaningful move toward the post-pandemic highs.
Why does this matter? Because the real rate is the discount rate every investor (and every corporate finance team) uses to value future cash flows. When you own a stock, you are really owning a claim on its future profits. Those profits have to be discounted back to today's dollars — and the rate you discount them at is, fundamentally, the real rate plus an equity risk premium. The higher the real rate, the smaller today's value of tomorrow's earnings. It is pure arithmetic.
WHY LONG-DURATION TECH IS HIT HARDEST
A 'long-duration' stock is one whose value depends heavily on profits years from now — think a high-growth software company whose terminal value is bigger than its near-term earnings. When the real rate jumps 10 basis points, near-term cash flows barely move, but the value of cash flows ten or twenty years out gets meaningfully compressed. That is why an AI-software name with a $1B current revenue base trading at 25x sales sells off more than a $200B-revenue industrial trading at 1.5x sales. The math is unforgiving — but it is just math.
So when Friday's NFP printed +172K — more than double consensus — the bond market did what it does: it raised the nominal yield to reflect a Fed that would have less room to cut. Inflation expectations barely moved (the 5-year breakeven actually fell slightly), so virtually all of the nominal-yield move passed through to real yields. The 10-year TIPS yield rose 11 bps. And in response, the most rate-sensitive corner of the equity market — the long-duration tech complex — sold off the hardest. Hence the Nasdaq's −4.2% versus the Dow's −1.4%. Same macro shock, dramatically different sector reaction.
The investable lesson here is twofold. First, when you see a hot economic print, the right first question is not 'will the Fed hike' but 'where do real rates go.' The two are related but distinct. Second, the cleanest hedges in a rising-real-rate world are short-duration businesses with contracted, near-term cash flows that are indifferent to discount-rate math — which is, not coincidentally, exactly the case our AI-energy picks-and-shovels framework (CEG, VST, TLN, GEV) has been making. Multi-decade hyperscaler PPAs are about as duration-insensitive as cash flows get. That is why the AI-power complex held up remarkably well Friday even as the AI-software complex broke.
8. ANALYST CALLS DRIVING ACTION
Notable upgrades / target hikes: Goldman raised Apple (AAPL) PT to $320 from $290 into WWDC, citing 'second-shot optionality.' Bank of America raised Constellation Energy (CEG) PT to $415 from $410. Morgan Stanley raised Vistra (VST) PT to $275. KeyBanc reiterated Overweight on Talen Energy (TLN) at $410.
Notable downgrades / target cuts: A wave of long-duration-tech PT cuts post-NFP — Goldman cut Snowflake (SNOW) to $145 from $170, Wells Fargo cut Datadog (DDOG) to $115 from $140, Citi cut CrowdStrike (CRWD) to $385 from $400. Several desks revised AI-software multiples lower for the third week running. Wedbush cut Tesla (TSLA) PT to $440 from $480 on Optimus-timeline slippage rumors.
9. STOCKS TO WATCH
Apple (AAPL) — Up 0.36% pre-market into the 1:00 p.m. WWDC keynote. Siri-2 timing is the swing factor.
Constellation Energy (CEG) / Vistra (VST) / Talen Energy (TLN) — Held up remarkably Friday despite the broader rout. The duration-insensitive AI-power thesis is now even cleaner; BofA, MS, KeyBanc all raised PTs.
GE Vernova (GEV) / Eaton (ETN) / Quanta Services (PWR) — Electrification picks-and-shovels. Order-book visibility insulates against real-rate moves.
BWX Technologies (BWXT) / Cameco (CCJ) — SMR fuel and uranium. Multi-year highs holding through Friday's selloff.
Tesla (TSLA) / Symbotic (SYM) — Physical-AI standbys. Wedbush cut TSLA PT on Optimus-timeline noise; watch for confirmation/denial this week.
Nvidia (NVDA) — Indicated +2% pre-market. Watch how the post-NFP tape treats the AI-infra bellwether; below $108 would extend the AI-software de-rating into the infra complex.
Marvell (MRVL) / Micron (MU) — Pre-market bounces of 8.8% and 7.1% respectively. Tactical longs if the broader tape stabilizes; quick reversals if yields extend higher.
Healthcare (UNH, LLY, JNJ) — Held up on Friday's rotation. The defensive lift continues into a high-real-rate world.
Energy majors (XOM, CVX) — Bid on Iran-Israel exchange and Brent at $96. The Hormuz tail risk has not gone away.
TLT (20+ Yr Treasury ETF) — At fresh lows after Friday's yield spike. Below the May lows would meaningfully change the equity setup.
10. GLOBAL MACRO SNAPSHOT
Europe: A soft open with the Stoxx 600 down 1.4%, tracking the U.S. AI-tech selloff and absorbing the renewed Iran-Israel tensions. UK April CPI and Eurozone industrial production later this week. ECB summer hold remains base case but pricing has hardened modestly on the U.S. NFP read-through.
Asia: An ugly session — Nikkei −3.83%, Hang Seng −3.45%, ASX −3.04% — as Friday's NFP-driven rout in U.S. AI exposure crushed the Asian chip and equipment complex overnight. TSMC, SK Hynix, Tokyo Electron, Advantest all down 4–6%. The Nikkei has now lost its 40,000 handle. Japan's yen weakened to 157.20 on the dollar bid; intervention risk is creeping back into focus.
Emerging markets: A textbook risk-off week. Higher U.S. real yields, a stronger dollar, renewed oil bid — all three are headwinds. India's rupee, Indonesian rupiah, and Turkish lira all softer. Brazil and Mexico hold up on commodity-export math, but the magnitude of the EM equity drawdowns mirrors the AI-tech selloff in the U.S.
11. WEEK AHEAD PREVIEW
A heavy macro week into the FOMC.
(1) Today 1:00 p.m. — Apple WWDC. Consumer-AI catalyst.
(2) Wednesday 8:30 a.m. — CPI. The most important number of the week. Core +0.3% m/m consensus; a hot print on top of Friday's NFP would force a real growth-vs-inflation conversation.
(3) Wednesday after close — Adobe + Oracle. The AI-software re-test.
(4) Thursday 8:30 — PPI. The supply-chain inflation read.
Wildcard: Iran-Israel exchange continues. The de-escalation thesis is in retreat.
FOMC June 17–18: Hold widely expected, but the dot plot is the show. Warsh's first.
12. THE CLOSING THOUGHT
It is worth keeping perspective. The S&P 500 closed Friday at 7,384 — still up roughly 9% year-to-date and still above where it traded for most of April and early May. The Dow is still well above 50,000. The structural AI capex story has not changed; Dell's $51 billion backlog and Constellation's hyperscaler PPAs do not depend on whether the 10-year prints 4.42% or 4.55%. What has changed, in the last 72 hours, is the price the market is willing to pay for that story. Real rates moved; multiples moved. That is the lesson of Friday, and the lesson of this brief's first foray into deliberate market education — we'll do more of these when the tape gives us a teachable moment as clean as this one. For now: Apple at 1:00, CPI Wednesday, the FOMC nine days out. Trade it carefully.
THE BROOKSIDE BRIEF · COMPILED 9:30 AM ET · SOURCES: WSJ, CNBC, BLOOMBERG, REUTERS, BLS, BEA, FRED, TRADINGECONOMICS, S&P GLOBAL, U.S. TREASURY
Good morning. The post-NFP recovery extended Monday, but with the kind of split-screen leadership that makes you read the tape twice. The Nasdaq Composite climbed 0.86% to 25,930 as the chip complex staged a sharp rebound (Micron +10% reversing Friday's −13%); the S&P 500 added 0.30% to 7,406; but the Dow slipped 0.16% to 50,786 as Apple sold off after its WWDC keynote. The bounce was healthy at the index level, but the internals were anything but clean: a chip-led recovery alongside Apple's −1.89% post-product-event reaction is a classic example of what happens when expectations meet reality.
Apple's story matters. At one point during the WWDC presentation, shares were up more than 3% at $317 as Tim Cook unveiled an AI-rebuilt Siri, an expanded Apple Intelligence platform, and — crucially — a multi-year agreement with Alphabet's Google to use Gemini to power Siri's most demanding queries. By the close, those gains were gone: Apple finished at $301.54. The buy-side concern was timing — Siri-2 ships only as a beta this fall — and the strategic optics of paying Google's tax to fix its own AI rather than owning the stack. The Gemini partnership is a confession, however justifiable: Apple's own model isn't competitive on the frontier, and admitting it publicly cost the stock five percent off its session high.
Markets pivot now toward Wednesday's CPI, which sits as the inflection point for the FOMC next week. But the story that genuinely defines this June is not Apple. It is the wave of mega-IPOs about to land: SpaceX prices Thursday for a Friday debut at a record $1.77 trillion valuation; Anthropic filed confidentially June 1 at roughly $965 billion; OpenAI is targeting September at $730–850 billion. Combined, these three listings represent roughly $3.6 trillion of public-market capacity hitting in six months. We dedicate today's Sector Spotlight (Section 7) to that cycle — and to the very public disagreement between NYU's Aswath Damodaran (who values SpaceX at $1.3T, not $1.77T) and the Aschenbrenner-style trillion-dollar-capex bulls who frame these listings as inevitable.
2. MARKETS AT A GLANCE
U.S. EQUITY FUTURES (PRE-OPEN)
Asset
Last
Change
% Chg
S&P 500 (ES)
7,418
+12
+0.16%
Nasdaq 100 (NQ)
26,005
+75
+0.29%
Dow (YM)
50,830
+45
+0.09%
Russell 2000 (RTY)
2,294
+4
+0.17%
PRIOR CLOSE (MONDAY, JUNE 8 — MIXED REBOUND)
Asset
Last
Change
% Chg
S&P 500
7,406.00
+22.00
+0.30%
Nasdaq Composite
25,930.00
+221.00
+0.86%
Dow Jones Industrial Avg.
50,786.01
-80.77
-0.16%
Russell 2000
2,289.80
+19.30
+0.85%
VIX
19.8
-1.8
-8.3%
RATES & FX
Asset
Last
Change
% Chg
UST 2-Year
4.38%
-2 bps
—
UST 10-Year
4.52%
-3 bps
—
UST 30-Year
4.99%
-3 bps
—
10-Yr TIPS (real)
2.22%
-2 bps
elevated
DXY (Dollar Index)
98.65
-0.20
-0.20%
EUR/USD
1.0790
+0.0015
+0.14%
USD/JPY
156.80
-0.40
-0.25%
COMMODITIES & CRYPTO
Asset
Last
Change
% Chg
WTI Crude (Jul)
$93.45
-$0.60
-0.64%
Brent Crude (Aug)
$95.78
-$0.42
-0.44%
Gold (spot)
$1,815
-$3
-0.17%
Silver (spot)
$21.15
-$0.03
-0.14%
Bitcoin
$84,200
+$1,000
+1.20%
ASIA & EUROPE
Asset
Last
Change
% Chg
Nikkei 225
39,330
+390
+1.00%
Hang Seng
21,930
+110
+0.50%
Australia ASX 200
8,438
+18
+0.21%
Stoxx Europe 600
567.10
+1.80
+0.32%
FTSE 100
8,808
+18
+0.20%
DAX
20,355
+65
+0.32%
3. TOP STORIES
SpaceX Prices Thursday for $1.77 Trillion Friday Debut
The biggest IPO in history is now 72 hours away. SpaceX's roadshow — which launched June 4 — concludes Thursday with pricing after the close; the stock begins trading Friday under ticker SPCX on the Nasdaq. The company is offering 555.6 million shares at a fixed $135 price, raising $75 billion (with an additional $11.2B underwriter option), and would debut at a $1.77 trillion valuation that, if it holds, makes it the seventh-largest U.S. company by market cap — above Tesla's $1.6 trillion. Elon Musk retains 82% voting control via a dual-class structure. The S-1, public since May 20, disclosed Q1 2026 revenue of $4.69 billion, an operating loss of $1.94 billion, and adjusted EBITDA of $1.13 billion. Goldman Sachs leads a 21-bank syndicate.
Apple Sells Off After WWDC; Gemini Partnership Cuts Both Ways
Apple's marquee event landed mixed. The product announcements were credible — Siri-2, an expanded Apple Intelligence rollout, on-device-AI improvements across iPad and Vision Pro — but the timeline disappointed: Siri-2 ships only as a fall beta. The structural headline was the multi-year deal with Google Gemini to power Siri's most demanding queries. For some, that's pragmatic — Apple gets a frontier-class model without years of additional capex. For others, it's an admission that Apple's own AI roadmap is two years behind, and now carries a recurring fee owed to its primary search-revenue counterparty. Shares were +3% intraday at $317 and closed at $301.54, down 1.89%.
Friday's chip washout reversed sharply Monday. Micron added nearly 10% (after −13% Friday) as buy-side notes flagged that the post-NFP yield move was overdone and that AI-memory demand visibility into H2 hasn't changed. Marvell added more than 5%, Broadcom stabilized after Friday's slide, and the SOXX semi ETF jumped 4%. The bounce is mechanically the right response to a 13-bp drop in the 10-year yield from Friday's peak — but the rebound remains squarely a technical phenomenon ahead of Wednesday's CPI.
CPI Wednesday: The Last Inflation Read Before the FOMC
Wednesday's May CPI release at 8:30 a.m. is the week's defining macro event. Consensus looks for core CPI at +0.3% month-over-month and 3.0% year-over-year — the same trajectory as the soft April PCE print. After Friday's hot NFP (+172K vs +80K consensus), the asymmetry of risk has shifted: a soft CPI provides genuine cover for the Fed to remain on hold without leaning hawkish in next Wednesday's dot plot; a hot core print, alongside Brent near $96, would reintroduce stagflation talk just nine days before Chair Warsh's first FOMC meeting at the helm.
Iran-Israel Tensions Hold; Oil Eases Modestly
After the weekend's strike exchange, the Middle East situation is in an uneasy holding pattern. No fresh major attacks were reported Monday or overnight, and crude eased marginally — WTI off 0.6% to $93.45, Brent off 0.4% to $95.78. The Strait of Hormuz remains effectively closed to commercial tanker traffic, which sets a hard floor under crude at this level. A genuine de-escalation requires both sides to agree to reopen Hormuz; nothing in this week's diplomatic chatter suggests that's imminent.
4. MACRO & FED WATCH
Tomorrow's CPI is the show. The combination of last Friday's labor data (NFP +172K, unemployment 4.3%, average hourly earnings +0.3% m/m) and Brent at $96 has the bond market leaning toward a hot core CPI risk-symmetry. A core print at +0.3% m/m as expected — and particularly if services ex-shelter cools — would extend the late-spring bond rally and almost certainly fuel another tech recovery day. A +0.4% m/m surprise, especially with energy-driven goods strength, would push the 10-year back toward 4.60% and likely undo Monday's bounce.
December-hike odds sit at 32% Tuesday morning, down modestly from Friday's post-NFP 36% as yields stabilized. The June 17–18 FOMC remains a near-certain hold; the question is whether Chair Warsh uses his first dot plot to signal a 2026 cut path that resembles consensus (one cut by year-end) or one that effectively endorses 'hold through year-end.' That distinction could be worth 20–30 basis points on the 10-year and 5–8% on the multi-year-duration growth complex.
5. ECONOMIC CALENDAR — THIS WEEK
Day
Time (ET)
Release
Consensus / Actual
Fri 6/5
8:30 AM
May NFP — released
+172K (vs +80K est) HOT
Mon 6/8
1:00 PM
Apple WWDC — released
Gemini deal; AAPL -1.89%
Tue 6/9
6:00 AM
NFIB Small Business Index
94.5
Wed 6/10
8:30 AM
CPI (May) — KEY
Core +0.3% m/m / 3.0% y/y
Wed 6/10
1:00 PM
10-Yr Treasury auction ($39B)
—
Wed 6/10
After close
Adobe (ADBE), Oracle (ORCL)
—
Thu 6/11
8:30 AM
PPI (May)
+0.2% m/m
Thu 6/11
8:30 AM
Initial Jobless Claims
225K
Thu 6/11
Late PM
SpaceX (SPCX) IPO pricing
$135 fixed, $1.77T val
Fri 6/12
Open
SpaceX (SPCX) begins trading on Nasdaq
—
Tue 6/17–Wed 6/18
2:00 PM
FOMC + dot plot — KEY
Hold expected
6. EARNINGS WATCH
Adobe and Oracle headline a quiet earnings calendar Wednesday after the close. Adobe is the most important AI-software print of the week — its Firefly revenue disclosure and any explicit AI-generated-content monetization metrics will be parsed for any sign that AI software can rebound after the CrowdStrike, Salesforce, and Broadcom de-ratings. Oracle's remaining-performance-obligations (RPO) and OCI revenue growth rate are the AI-infrastructure tells; the buy-side wants RPO above $135 billion and OCI growth above 55% to extend the AI-infra capex narrative.
Beyond those two, the calendar thins to Smucker, Kroger, and Restoration Hardware on the consumer side, and a smattering of small-cap names. Q2 reporting season formally begins with the big banks the week of July 13. The intervening period is macro-dominated — CPI tomorrow, PPI Thursday, and crucially the June 17–18 FOMC.
7. SECTOR SPOTLIGHT: THE MEGA-IPO CYCLE — DAMODARAN VS. ASCHENBRENNER
Set aside the noise for a moment and consider what is about to happen. In a span of roughly fifteen weeks, three of the most consequential private companies in the world — SpaceX, Anthropic, and OpenAI — will move into public markets. Together, the three are targeting valuations totaling approximately $3.6 trillion. SpaceX prices Thursday at $1.77 trillion. Anthropic filed confidentially June 1 following a fresh $65 billion Series H that lifted the private mark to roughly $965 billion (revenue run-rate $47B in May, up from $10B a year ago). OpenAI is targeting a September listing at $730–850 billion. Goldman is projecting U.S. IPO proceeds in 2026 to clear $160 billion — by a wide margin the largest year since 2021.
Two intellectual traditions are now openly arguing about what this means. The first, associated most clearly with Leopold Aschenbrenner and *Situational Awareness*, frames this wave as inevitable: trillion-dollar compute clusters require trillion-dollar funding, and the public market is the only pool of capital deep enough to provide it. The second, associated most clearly with NYU's Aswath Damodaran — the 'dean of valuation' — frames the wave as a discipline problem: even revolutionary technologies have realistic ceilings on addressable markets, market share, and margins, and history rarely rewards mega-IPOs priced at the upper boundary of those estimates.
“Over the past year, the talk of the town has shifted from $10 billion compute clusters to $100 billion clusters to trillion-dollar clusters. … This is not hype; this is the largest industrial mobilization since the post-war buildout.”
— Leopold Aschenbrenner, Situational Awareness (June 2024)
Damodaran's analysis of SpaceX, published last week, is the most careful counterweight on record. He values SpaceX at approximately $1.3 trillion — about $475 billion below the $1.77 trillion IPO price — by separately valuing three businesses: rocket launches, Starlink satellite internet, and AI (xAI and Grok). His central disagreement: SpaceX's S-1 estimates a total addressable market of $28.5 trillion across the three businesses, with roughly $26 trillion of that attributed to AI. Damodaran argues those TAM assumptions stretch the bounds of plausibility. He has stated he will not personally subscribe to the offering.
“I cannot get to the IPO valuation no matter how aggressive I am on the AI side. The TAM estimates require assumptions about market share and margin that I do not believe are supportable in any reasonable competitive scenario.”
— Aswath Damodaran, NYU Stern (June 2026)
Two important caveats. First, Damodaran himself has noted that the stock could still perform well after listing — momentum, scarcity, and indexing flow can drive trading behavior well above what DCF would justify, particularly in the first six months. Second, the Aschenbrenner-style bull argument is not a refutation of Damodaran's analytical discipline — it is a different claim, namely that whatever the long-run DCF says, the near-term capex requirements are so massive that mispricing the equity by twenty or thirty percent is a rounding error compared to the question of whether AGI arrives in 2027 or 2030. Both views can be simultaneously correct.
WHAT IS 'TOTAL ADDRESSABLE MARKET' (TAM)?
TAM is the total annual revenue a company could earn if it captured 100% of every customer who could possibly buy its product. It is, deliberately, an upper bound — not a forecast. The art of IPO valuation lies in disciplining the TAM with realistic assumptions about (1) market share (how much of TAM the company actually wins), (2) operating margins (what fraction of revenue becomes profit), and (3) duration of competitive advantage. SpaceX's S-1 cites $28.5T in TAM. Damodaran's $1.3T equity value implies SpaceX captures roughly 15–20% of a far smaller realistic market with normal tech-platform margins. The IPO's $1.77T implies the company captures meaningfully more of a much larger market for much longer. That is the entire disagreement, expressed in DCF math.
How the cycle plays out matters beyond these three names. If SpaceX, Anthropic, and OpenAI all trade well above their IPO prices for the first year, the implied cost of equity for the broader AI-infrastructure complex falls — and that cheaper capital fuels the next round of capex, vindicating Aschenbrenner. If they trade poorly, the implied cost of equity rises, AI capex plans get re-scoped, and Damodaran's discipline becomes the operative framework. Either path is consistent with the structural AI thesis being real; but the path determines which businesses get built, at what scale, on what timeline. Hence the Damodaran-Aschenbrenner debate matters even if you do not buy any of the three IPO allocations. Watch SPCX's first trade Friday — and watch how the syndicate and the institutional book defend the price.
8. ANALYST CALLS DRIVING ACTION
Notable upgrades / target hikes: Goldman raised Apple (AAPL) PT to $320 from $290 post-WWDC, despite the share-price reversal. Morgan Stanley raised Micron (MU) PT to $165 from $140 on the Friday-to-Monday round trip. Bank of America raised Constellation Energy (CEG) PT to $420 from $415. Citi reiterated Buy on Adobe (ADBE) into Wednesday's print at $625 PT.
Notable downgrades / target cuts: A wave of mega-IPO-skeptic commentary from valuation-discipline desks — Damodaran's Substack post on SpaceX has been widely circulated by long-only desks. Wedbush trimmed Tesla (TSLA) PT to $440 from $480. Several desks selectively cut long-duration software despite the Monday bounce, including Goldman on Snowflake (SNOW) and Datadog (DDOG).
9. STOCKS TO WATCH
SpaceX (SPCX) — Prices Thursday after close, begins trading Friday on Nasdaq. The defining single-stock event of June. Watch first-day trading range and book-build commentary.
Apple (AAPL) — Closed -1.89% post-WWDC despite Gemini deal. Watch the $300 level for follow-through and the consumer-AI read into Q3.
Constellation Energy (CEG) / Vistra (VST) / Talen Energy (TLN) — The duration-insensitive AI-power thesis holds even through last week's rate scare. BofA CEG $420 PT.
GE Vernova (GEV) / Eaton (ETN) / Quanta Services (PWR) — Electrification picks-and-shovels. Indirect SpaceX exposure via launch-pad power demand.
Adobe (ADBE) / Oracle (ORCL) — Report Wednesday after close. The AI-software re-test post-CRWD/CRM.
Alphabet (GOOGL) — Gemini's WWDC integration is a meaningful structural win; watch follow-through above $200.
10. GLOBAL MACRO SNAPSHOT
Europe: A constructive open with the Stoxx 600 up 0.32%, tracking the Monday bounce. UK April industrial production and Eurozone June ZEW survey today. ECB summer hold remains consensus; pricing has stabilized after Friday's U.S.-driven repricing.
Asia: A relief session — Nikkei +1.0%, Hang Seng +0.5% — as the Monday chip bounce read through to Asian AI-supply names. The Nikkei reclaimed 39,000 but remains well below 40,000. TSMC, SK Hynix, Tokyo Electron all up 2–4%. Japan's yen firmed to 156.80.
Emerging markets: A modest recovery from last week's risk-off, helped by softer oil and stable dollar. India's rupee firmer, the won and rupiah bid. Brazil's real holding. The SpaceX IPO is being watched globally as a sentiment marker — a strong first day extends risk-on across EM equities; a wobble would have the opposite effect.
11. WEEK AHEAD PREVIEW
This week pivots on two events: tomorrow's CPI and Friday's SpaceX debut.
(1) Wednesday 8:30 a.m. — CPI. The most important data point of the week. Core +0.3% m/m consensus.
(2) Wednesday after close — Adobe + Oracle. The AI-software / AI-infra re-test.
(3) Thursday — PPI, jobless claims, and SpaceX IPO pricing after the close.
(4) Friday — SpaceX (SPCX) begins trading on Nasdaq. The single largest IPO debut in history.
FOMC June 17–18: Hold widely expected; Warsh's first dot plot is the show.
12. THE CLOSING THOUGHT
By the close of this Friday, we will have a new public benchmark for what frontier private capital is worth. By September, Anthropic and OpenAI may follow. By year-end, the public market will have absorbed $3.6 trillion of fresh AI-themed equity supply while also re-rating the existing megacap complex (Nvidia, Microsoft, Meta, Alphabet) against it. That is an extraordinary amount of valuation work for the market to do in six months. Damodaran's framework — discipline the TAM, model the share, justify the margin — will be tested. Aschenbrenner's framework — the capex is happening regardless, and the funding will find its way — will also be tested. Almost certainly, both will prove partially right. The genuinely interesting question is not which thinker is correct in the abstract; it is which set of names you want to own as the cycle plays out. Our standing answer remains the AI-power complex: contracted, duration-insensitive cash flows that work in both scenarios. Trade it carefully — and watch the SPCX book.
THE BROOKSIDE BRIEF · COMPILED 9:30 AM ET · SOURCES: WSJ, CNBC, BLOOMBERG, REUTERS, BLS, BEA, SEC, MOOMOO, SITUATIONAL-AWARENESS.AI, ASWATH DAMODARAN SUBSTACK, U.S. TREASURY
1. THE MORNING SETUP
Good morning. CPI day. At 8:30 a.m. ET, the Bureau of Labor Statistics will deliver May consumer price data — consensus core CPI at +0.3% month-over-month and +2.9% y/y, headline at +0.5% m/m and +4.2% y/y, which if accurate would be the hottest headline print since April 2023. Markets are sitting still ahead of it: the S&P 500 finished Tuesday at 7,409, the Nasdaq at 25,964, the Dow at 50,820 — barely changed from Monday's close. Futures are marginally lower, the VIX at 19.4, the 10-year at 4.52%. The setup is the one we have spent the past week building: after a hot NFP and persistent Iran-driven oil bid, the bond market needs CPI to confirm that the disinflation story is at least intact. A soft core print delivers it. A hot core print does not.
Beneath the macro suspense, the corporate clock keeps ticking. Adobe and Oracle report after the close — the most important AI-software pair this week, with Adobe's Firefly metrics and Oracle's RPO disclosure both carrying read-through to the broader cycle. The Treasury sells $39 billion of 10-year notes at 1:00 p.m., the first major auction since Friday's yield spike. And SpaceX prices Thursday after the close for a Friday debut at a $1.77 trillion valuation — the largest IPO in history, and the cleanest single test of public-market appetite for frontier AI valuations.
Today's Sector Spotlight is a deep dive on a theme James has asked us to keep front and center: physical AI. With Tesla's Optimus gen-3 production reportedly targeting a 2026 start, Jensen Huang publicly framing humanoid robots as a $40 trillion TAM, and well-sourced independent research (Citrini Research's comprehensive humanoid piece, alongside Next Financial's '$38 Billion Supply Chain' framework) mapping the picks-and-shovels of the value chain, this is the right moment to crystallize where the investable exposure actually lives. The answer turns out to be less about Tesla than you might expect — see Section 7.
2. MARKETS AT A GLANCE
U.S. EQUITY FUTURES (PRE-OPEN)
Asset
Last
Change
% Chg
S&P 500 (ES)
7,405
-8
-0.11%
Nasdaq 100 (NQ)
25,995
-30
-0.12%
Dow (YM)
50,810
-10
-0.02%
Russell 2000 (RTY)
2,288
-2
-0.09%
PRIOR CLOSE (TUESDAY, JUNE 9 — QUIET AHEAD OF CPI)
Asset
Last
Change
% Chg
S&P 500
7,409.20
+3.20
+0.04%
Nasdaq Composite
25,964.10
+34.10
+0.13%
Dow Jones Industrial Avg.
50,820.30
+34.29
+0.07%
Russell 2000
2,290.40
+0.60
+0.03%
VIX
19.4
-0.4
-2.0%
RATES & FX
Asset
Last
Change
% Chg
UST 2-Year
4.38%
0 bps
—
UST 10-Year
4.52%
0 bps
—
UST 30-Year
5.00%
+1 bps
at 5%
10-Yr TIPS (real)
2.22%
0 bps
elevated
DXY (Dollar Index)
98.55
-0.10
-0.10%
EUR/USD
1.0800
+0.0010
+0.09%
USD/JPY
156.70
-0.10
-0.06%
COMMODITIES & CRYPTO
Asset
Last
Change
% Chg
WTI Crude (Jul)
$92.80
-$0.65
-0.70%
Brent Crude (Aug)
$95.20
-$0.58
-0.61%
Gold (spot)
$1,818
+$3
+0.17%
Silver (spot)
$21.22
+$0.07
+0.33%
Bitcoin
$83,900
-$300
-0.36%
ASIA & EUROPE
Asset
Last
Change
% Chg
Nikkei 225
39,415
+85
+0.22%
Hang Seng
22,000
+70
+0.32%
Australia ASX 200
8,450
+12
+0.14%
Stoxx Europe 600
567.30
+0.20
+0.04%
FTSE 100
8,815
+7
+0.08%
DAX
20,375
+20
+0.10%
3. TOP STORIES
CPI at 8:30 — The Last Major Data Print Before the FOMC
Today's release at 8:30 a.m. is the inflection point. The Cleveland Fed's nowcast is tracking core CPI at +0.32% m/m, consistent with the +0.3% Dow Jones consensus and the +2.9% y/y reading. The headline number is expected at +0.5% m/m and +4.2% y/y — if accurate, the hottest headline print since April 2023 (4.9%). The decomposition matters more than the headline: services ex-shelter is the Fed's preferred sub-component, and a softening there would provide genuine cover for the FOMC to hold rates without leaning hawkish next Wednesday. A hot services print on top of Friday's labor data tilts the dot plot toward 'hold-through-year-end' — and pushes yields meaningfully higher.
SpaceX Pricing Tomorrow; Anthropic Reportedly Tightening Range
The SpaceX roadshow concludes Thursday with pricing after the close; the stock begins trading Friday at $135, valuing the company at $1.77 trillion. Order-book chatter from Goldman desks Tuesday suggests the institutional book is multiple-times subscribed — though that is unsurprising given the dual-class structure and the seven-figure minimum allocations for most institutional investors. Separately, Anthropic — which filed confidentially June 1 at a ~$965 billion private valuation — is reportedly tightening its filing range ahead of a likely August debut, fueled by the May revenue run-rate of $47 billion.
Tesla Optimus Gen-3 Targets 2026 Production at Repurposed Fremont Line
Fresh reporting overnight: Tesla's Optimus gen-3 production is targeting a calendar-2026 start at the repurposed Fremont Model S/X line, with a stated long-term goal of one million humanoid units per year by 2030. The disclosure aligns with prior commentary from Musk and follows the leaked October 2025 order for $685 million worth of linear actuators from Sanhua Intelligent Controls — enough hardware for approximately 180,000 robots. Wedbush, which cut Tesla's PT to $440 from $480 last week on 'timeline noise,' may need to revisit. Tesla is bid 2% pre-market.
Adobe + Oracle Tonight: The AI-Software Re-Test
Both names report after Wednesday's close. Adobe consensus: $5.07 EPS / $5.83B revenue, with the marquee number being Firefly AI revenue disclosure (consensus implied: ~$300M annualized). Oracle consensus: $1.62 EPS / $15.6B revenue, with remaining-performance-obligations (RPO) above $135 billion and OCI growth above 55% the keys. After the CrowdStrike, Salesforce, and Broadcom de-ratings last week, AI-software needs a clean win.
Iran-Israel Holds; Oil Drifts Lower as CPI Looms
No fresh escalation reports overnight. WTI is off 0.7% to $92.80, Brent off 0.6% to $95.20 — both extending Tuesday's mild pullback as the market waits to see whether today's CPI confirms the energy-impulse pass-through into headline inflation. The Strait of Hormuz remains effectively closed; the structural risk premium has not gone away even if the immediate tactical risk has cooled.
4. MACRO & FED WATCH
The Treasury's $39B 10-year auction at 1:00 p.m. is today's underappreciated event. With the 10-year at 4.52% and Friday's hot NFP fresh in memory, real-money demand at the auction will be a clean read on whether institutional appetite for duration has stabilized after Friday's spike. A tail of two basis points or more would confirm the bond market has not yet absorbed the higher-for-longer math; a strong stop-through would suggest the post-NFP fear was peak fear.
Beyond today, the path is clear: PPI Thursday, SpaceX Friday, FOMC June 17–18. December-hike odds sit at 31% Wednesday morning; markets are pricing roughly 40 basis points of 2027 cuts. Chair Warsh's first dot plot will be the cleanest signal yet of where the median Committee participant actually sits on cuts. We expect a meaningfully more hawkish median than the Powell-era dots, but how meaningfully is the entire question for the duration trade.
5. ECONOMIC CALENDAR — THIS WEEK
Day
Time (ET)
Release
Consensus / Actual
Fri 6/5
8:30 AM
May NFP — released
+172K HOT (vs +80K)
Mon 6/8
1:00 PM
Apple WWDC — released
Gemini deal; AAPL -1.89%
Tue 6/9
6:00 AM
NFIB Small Business Index — released
~95
Wed 6/10
8:30 AM
CPI (May) — KEY
Core +0.3% m/m / 2.9% y/y
Wed 6/10
1:00 PM
10-Yr Treasury auction ($39B)
—
Wed 6/10
After close
Adobe (ADBE), Oracle (ORCL)
EPS / RPO key
Thu 6/11
8:30 AM
PPI (May)
+0.2% m/m
Thu 6/11
8:30 AM
Initial Jobless Claims
225K
Thu 6/11
Late PM
SpaceX (SPCX) IPO pricing
$135 fixed, $1.77T
Fri 6/12
Open
SpaceX (SPCX) trading debut
Nasdaq
Tue 6/17–Wed 6/18
2:00 PM
FOMC + dot plot — KEY
Hold expected; Warsh #1
6. EARNINGS WATCH
Adobe and Oracle tonight headline a quieter calendar, but both prints carry weight beyond their individual reactions. Adobe is the cleanest test of whether generative-AI tools can translate to disclosed AI revenue — Firefly's run-rate has been the buy-side focus for two quarters; consensus now implies ~$300M annualized but the bulls want $400M+. Oracle's story is purer AI infrastructure: remaining performance obligations (RPO) above $135B and OCI revenue growth above 55% would extend the Dell/HPE AI-server narrative and pressure the AI-software complex to re-rate higher.
Beyond tonight, the calendar is light through next week's FOMC. Smucker, Kroger, and Restoration Hardware are the consumer-side prints worth glancing at. Q2 earnings season formally begins with the big banks the week of July 13 — JPMorgan, Wells Fargo, and Citigroup all on July 14, Bank of America and Goldman July 15.
7. SECTOR SPOTLIGHT: PHYSICAL AI — THE PICKS-AND-SHOVELS INSIDE THE ROBOT
Citrini Research's deep humanoid-robotics piece — roughly 1,000 person-hours across five analysts, with thematic rankings for 280 names and detailed work on 50 — and Next Financial's '$38 Billion Supply Chain' framework, both published in recent weeks, do something remarkably similar despite arriving from different angles: they argue that the real investable opportunity in physical AI is not in the headline-grabbing humanoid OEMs (Tesla, Figure, Apptronik, Unitree), but in the deeply specialized component manufacturers that every humanoid platform depends on.
“Actuation hardware makes up at a minimum 8x the cost that the AI compute for a robot does, and humanoids are likely to enter a Moore-style cost-curve deflation within the next two years.”
— Citrini Research, Humanoid Robots Thematic Primer (2026)
Three structural observations make the picks-and-shovels case compelling. First, concentration. Every humanoid platform — Optimus, Figure 02, Atlas, G1, A3 — depends on the same handful of components: precision harmonic-drive gearboxes for joints, high-performance neodymium permanent magnets for the actuator motors, force-torque sensors for the hands, and linear actuators for the limbs. Globally, fewer than five companies manufacture harmonic drives at scale. Fewer than three produce the precision NdFeB magnets required for compact robot actuators outside of China. The entire global supply of force-torque sensors suitable for dexterous robot hands fits in a handful of facilities. That is not a TAM problem — it is a bottleneck.
Second, geography. Citrini's broader thesis observes that China dominates the 'body' (mechanical components, actuators, sensors), the U.S. dominates the 'brain' (silicon, models, simulation), and ownership of the 'nervous system' (vision-language-action models, sensor fusion, control software) is more evenly split. This geographic concentration of supply translates directly to pricing power for the few non-Chinese names with credible production at scale.
“The picks and shovels of the humanoid revolution are manufactured by a small number of publicly traded companies that the market still prices as legacy industrial businesses — at 8 to 15 times earnings — with zero robotics premium in their valuations.”
— Next Financial, 'One Million Robots Per Year — The $38 Billion Supply Chain' (April 2026)
Third, the volume math. Tesla's leaked October 2025 order to Sanhua Intelligent Controls for $685 million of linear actuators — enough hardware for approximately 180,000 Optimus robots — was the first concrete data point connecting the marketing claims to actual purchase orders. Jensen Huang's CES 2026 framing of humanoids as a $40 trillion TAM is marketing copy; the Sanhua order is reality. With Tesla's overnight reporting confirming gen-3 Optimus production targeting calendar 2026 at the repurposed Fremont line, and Unitree, Apptronik, and Figure all ramping in parallel, the demand curve for actuators, harmonic drives, and rare-earth magnets is in early visibility.
'PICKS-AND-SHOVELS' INVESTING — AND WHY IT WORKS HERE
The term comes from the 1849 California gold rush: most miners lost money, but Levi Strauss (denim), Wells Fargo (banking), and the picks-and-shovels suppliers made fortunes selling the inputs to whoever was digging — winners and losers alike. The framework is useful when (1) the end-product winner is uncertain, (2) the inputs are specialized and concentrated, and (3) every contender needs the same inputs. Physical AI fits all three: we do not know whether Optimus, Figure, Apptronik, Unitree, or someone not yet public wins, but every one of them needs harmonic drives, force sensors, and rare-earth magnets. If the humanoid market reaches even Citrini's conservative estimates — much less Huang's $40T — the suppliers capture the early cost curve before the OEMs scale.
The investable map across the stack. Mechanical actuation and motion control: Harmonic Drive Systems (TYO: 6324, the global leader in strain-wave gearing), Nabtesco (TYO: 6268), Rockwell Automation (ROK), Sanhua (private/Hong Kong listed). Sensing: Cognex (CGNX), Keyence (TYO: 6861), and Hexagon (STO: HEXA-B). AI compute and simulation: Nvidia (NVDA, Isaac GR00T platform). System integration and warehouse automation: Symbotic (SYM), Teradyne (TER, owns Universal Robots). Pure-play humanoid bets (more speculative): Tesla (TSLA, Optimus), and the watch-list of private names (Figure AI, Apptronik, Unitree) for when secondary markets create opportunities. Note carefully: the legacy industrial suppliers trade at single-digit-to-mid-teens multiples; the headline-grabbing humanoid OEMs trade at 50-100x forward earnings. The asymmetry favors the picks-and-shovels even before considering the Moore-style cost-curve deflation Citrini flags.
8. ANALYST CALLS DRIVING ACTION
Notable upgrades / target hikes: Morgan Stanley raised Cognex (CGNX) PT to $58 from $48 on humanoid-vision exposure. Citi raised Teradyne (TER) PT to $200 from $175 on Universal Robots accretion. Bank of America raised Constellation Energy (CEG) PT to $425. Goldman raised Symbotic (SYM) PT to $54. Wedbush reversed Tesla (TSLA) — back to $480 — on the Optimus gen-3 production confirmation.
Notable downgrades / target cuts: Goldman cut Snowflake (SNOW) PT further to $135 on continued multiple compression. Wells Fargo trimmed Datadog (DDOG) and Confluent (CFLT). Several desks revised SpaceX-comparable Tesla math after Damodaran's note — the consensus on the buy-side is that SPCX's first trade meaningfully re-prices Tesla's Optimus optionality.
9. STOCKS TO WATCH
Tesla (TSLA) — Optimus gen-3 production reportedly 2026; Wedbush reversal back to $480. The marquee physical-AI pure-play.
Symbotic (SYM) — Goldman raised PT to $54. Warehouse-automation pure-play; embodied AI in real volume.
Cognex (CGNX) — Morgan Stanley to $58. Machine-vision picks-and-shovels for every humanoid platform.
Teradyne (TER) — Citi to $200. Universal Robots ownership + AI-chip test equipment.
Constellation Energy (CEG) / Vistra (VST) / Talen Energy (TLN) — AI-power complex continues to decouple. BofA CEG $425 PT.
SpaceX (SPCX) — Prices Thursday after close. Friday debut. Largest IPO in history.
10. GLOBAL MACRO SNAPSHOT
Europe: A quiet open ahead of the U.S. CPI, with the Stoxx 600 flat. Eurozone June ZEW survey today; ECB summer hold remains consensus. UK April industrial production released this morning beat modestly; sterling firmer.
Asia: Modest gains — Nikkei +0.22%, Hang Seng +0.32% — as the Tesla Optimus headlines lifted Asian robotics-supply names. Notably, Harmonic Drive Systems (TYO: 6324) rose 4% overnight on the same headlines that lifted Tesla — a clean illustration of the picks-and-shovels translation. Japan's yen at 156.70 ahead of the U.S. CPI.
Emerging markets: A holding pattern ahead of CPI. India's rupee firmer; the Korean won and Taiwanese dollar both bid on the chip-and-robotics read-through. Brazil and Mexico flat.
11. WEEK AHEAD PREVIEW
Three events define the remainder of the week.
(1) Today 8:30 a.m. — CPI. The fulcrum. A soft core print extends the bond rally and lifts the AI-software complex; a hot one revives stagflation talk into next week's FOMC.
(2) Today after close — Adobe + Oracle. The AI-software re-test.
(4) FOMC June 17–18: Warsh's first dot plot. Hold widely expected; the median dot path is the show.
12. THE CLOSING THOUGHT
Three weeks ago this brief was opening with breathless commentary about Marvell's 33% single-day surge on Huang's custom-silicon shout-out. Today we open with the bond market holding its breath for a 0.3% core CPI print and the cleanest single-name event of June — SpaceX's $1.77T debut — still 48 hours away. What changed in three weeks was not the underlying structural AI thesis. What changed was the pace at which good news was being rewarded versus the discount rate that values every dollar of future earnings. Friday's NFP was the inflection. Today's CPI is the confirmation — or the contradiction. Beneath the macro suspense, however, the physical-AI thesis continues to compound in real purchase orders, production timelines, and supply-chain bottlenecks that the public equity market still prices at 8-to-15x earnings. That is the trade we keep returning to. Trade it carefully — and watch CPI at 8:30.
THE BROOKSIDE BRIEF · COMPILED 9:30 AM ET · SOURCES: WSJ, CNBC, BLOOMBERG, REUTERS, BLS, BEA, SEC S-1, CITRINI RESEARCH SUBSTACK, NEXT FINANCIAL SUBSTACK, SITUATIONAL-AWARENESS.AI, U.S. TREASURY
The world woke up to a different market on Wednesday. After 40 days of US-Iranian military conflict that sent crude oil above $110 a barrel, paralysed the Strait of Hormuz, and drove Treasury yields to their highest levels in months, President Trump agreed late Tuesday night to a two-week ceasefire — and markets responded with one of the most dramatic overnight repricing events in years.
West Texas Intermediate crude plunged as much as 19%, the steepest single-session drop since the COVID demand shock of April 2020. S&P 500 futures surged 2.5%, Nasdaq 100 futures leapt 3.2%, and Asian bourses rocketed higher — South Korea's Kospi adding nearly 7%, Japan's Nikkei 225 surging 5.4%. In Europe, the DAX opened up almost 5% and travel stocks soared more than 7%.
The immediate beneficiaries are obvious: airlines, consumer discretionary, and interest rate-sensitive growth stocks. The losers are equally clear: energy producers, oilfield services, and anyone who had built a portfolio around $110 oil persisting. But the harder question — one markets will wrestle with all day — is whether a 14-day ceasefire is the beginning of a durable resolution or simply a temporary reprieve in a conflict that has already reshaped global energy flows. Formal negotiations begin in Islamabad on Friday. Two weeks is a very short window.
2. MARKETS AT A GLANCE
Asset / Instrument
Level
Chg
% Chg
Commentary
── US EQUITIES ──
S&P 500 (Tue close)
6,616.85
+5.07
+0.08%
Flat session — awaited ceasefire news
Dow Jones (Tue close)
46,584.46
-85.42
-0.18%
Energy drag weighed on blue chips
Nasdaq Comp (Tue close)
22,017.85
+22.35
+0.10%
Tech held up; risk-off tone limited gains
Russell 2000 (Tue close)
2,540.64
+0.42%
+0.42%
Small-caps broadly flat; domestic focus
S&P 500 Futures (pre-mkt)
6,823.00
+206
+2.50%
Ceasefire surge — risk-on hard
Nasdaq 100 Futures (pre-mkt)
25,144.25
+773
+3.17%
Tech leads the morning rally
Dow Futures (pre-mkt)
47,879.00
+1,067
+2.28%
Broad-based optimism
VIX (Fear Gauge)
~19.5
↓ from 25
↓~22%
Fear unwinds sharply overnight
── ASIA CLOSE ──
Nikkei 225 (Japan)
56,308.42
+2,879
+5.39%
Yen weakness + ceasefire boost
Hang Seng (HK)
+2.95%
Resumed after holiday; energy relief
CSI 300 (China)
+3.49%
Policy support + ceasefire tailwind
Kospi (S. Korea)
5,872.34
+390
+7.0%
Samsung +7.1%, SK Hynix +9.6%
ASX 200 (Australia)
8,951.80
+222
+2.55%
Materials & energy rebalancing
── EUROPE OPEN ──
FTSE 100 (UK)
+2.80%
Travel stocks +7.6%; miners +6.3%
DAX (Germany)
+4.80%
Autos +6%; export relief on oil drop
CAC 40 (France)
+4.50%
Broad ceasefire rally
── FIXED INCOME ──
US 2-Yr Treasury
3.80%
-3 bps
Rate-cut repricing begins
US 10-Yr Treasury
4.32%
-4 bps
War premium unwinding from 4.36%
US 30-Yr Treasury
4.68%
-3 bps
Long end easing with geopolitical risk off
── FX ──
DXY (US Dollar Index)
100.13
flat
Near recent lows; risk-on weighs on USD
EUR/USD
1.1522
-0.20%
Euro steady; ECB rate path in focus
GBP/USD
1.3194
-0.22%
Sterling firm amid global risk-on
USD/JPY
159.63
+0.06%
Yen weakens slightly on risk appetite
── COMMODITIES ──
WTI Crude Oil
~$88.50
-~$20.45
-~19%
Biggest drop since COVID; Hormuz to reopen
Brent Crude Oil
~$95.00
-~$14.72
-~13%
War premium evaporates overnight
Natural Gas (Henry Hub)
~$4.10
↓ ~3%
Demand outlook relief as tensions ease
Gold (spot)
~$4,700
+$117.50
+2.5%
CB buying + ceasefire skepticism support
Silver
~$32.40
+4.6%
Industrial + safe-haven dual demand
Copper
~$4.85/lb
+1.2%
Supply deficit story intact; demand proxy
── CRYPTO ──
Bitcoin (BTC)
~$72,700
+$3,700
+5.4%
Risk-on surge post-ceasefire
Ethereum (ETH)
~$2,107
+$18
+0.9%
Modest recovery; underperforms BTC
† Futures as of early pre-market Wednesday. Asia reflects Wednesday close. Europe reflects Wednesday open. Prior US closes are Tuesday, April 7.
3. TOP STORIES
I. The Islamabad Accord — Terms, Gaps, and What Happens Next
The ceasefire brokered by Pakistan ends 40 days of US-Israeli strikes on Iranian infrastructure that began February 28. Under the terms announced by Trump on Truth Social, the US suspends all military action for 14 days; in return, Iran agrees to the 'complete, immediate and safe opening' of the Strait of Hormuz, the narrow waterway through which roughly one-fifth of the world's seaborne oil and LNG transits.
The devil, as always, is in the details. Transits through the strait will remain subject to Iranian military coordination and approval — meaning that only 10–15 ships per day are likely to pass during the two-week window, versus the normal 20+ tankers per day. That is a meaningful but not complete restoration of flows. Iran's full 10-point negotiating framework, meanwhile, is substantially more demanding: it calls for a full US withdrawal from regional military bases, the lifting of all sanctions, the release of frozen Iranian assets, and payment of war reparations.
Formal talks begin in Islamabad on Friday. The gap between Tehran's opening position and anything Washington could realistically accept is enormous. Markets appear to be pricing something close to a permanent peace deal. They may be getting ahead of themselves.
What to watch: Whether the Islamabad talks produce even a framework agreement by April 22 — the ceasefire expiry date. Any breakdown in negotiations would immediately reverse the oil plunge.
II. Oil's Historic Single-Day Collapse
WTI crude fell as much as 19% in overnight trading — matching the scale of the April 2020 COVID crash and exceeding every single-day oil drop since. The move is a mechanical unwinding of the 'war premium' that had built up over six weeks: at its peak, Brent crude was trading above $110/bbl, reflecting fears of a prolonged closure of the Strait of Hormuz. With the strait set to reopen — even partially — that premium is evaporating.
The broader macroeconomic implications are significant. Energy prices have been one of the primary contributors to above-target US inflation since the conflict began in February. Oil at $88–$95/bbl rather than $110+ removes a key obstacle to Federal Reserve rate cuts. Goldman Sachs analysts noted overnight that if the ceasefire holds and Brent stabilises in the $90–$95 range, it would knock approximately 0.4 percentage points off US headline CPI within two months.
Energy stocks, which had surged more than 34% in Q1 2026 on the back of the oil spike, face a significant correction. Exxon Mobil had been up nearly 42% year-to-date; that trade is unwinding quickly this morning. The critical question for the sector is whether $88 WTI represents a floor (with the ceasefire priced in) or a waystation to $75–$80 if a full Hormuz reopening materialises.
What to watch: Tanker traffic data through the Strait of Hormuz over the next 48–72 hours. A faster-than-expected resumption of normal flows would push oil lower still.
III. The Fed's Suddenly Clearer Path
The Federal Open Market Committee has been paralysed for weeks by the oil shock. At its most recent meeting, the Fed held rates steady at 3.50–3.75% and maintained its projection of just one rate cut in 2026 — a sharply more cautious stance than markets had expected at the start of the year. Chicago Fed President Austan Goolsbee had warned publicly that the Iran war risked fuelling inflation that would make rate cuts politically impossible.
That calculus changes materially if oil stays in the $88–$95 range. The 10-year Treasury yield, which had climbed to 4.36% on 'Geopolitical Term Premium,' is already pulling back toward 4.32% overnight. Fed funds futures are now pricing a meaningfully higher probability of a September rate cut than they were 24 hours ago. The March FOMC minutes — due at 2:00 PM ET today — will be parsed intensely for any language that hints at a pivot in tone.
Critical caveat: the Fed will not react to a 14-day ceasefire. Powell has repeatedly said the Fed 'looks through' short-term commodity shocks. What would matter is sustained lower oil prices for 60–90 days, combined with softening labour market data. JOLTS today (10:00 AM ET) is the next data point in that picture.
What to watch: Language in the March FOMC minutes around 'upside risks to inflation' — any softening of that phrase would be bullish for rates.
IV. Gold's Paradoxical Rally
In a textbook risk-on environment, gold typically falls — investors sell safe havens and rotate into equities. Not today. Spot gold rose approximately 2.5% to ~$4,700/oz, even as stocks surged and the VIX dropped sharply. The disconnect reflects two structural forces that have decoupled gold from its traditional 'fear trade' identity.
First, central bank buying has been relentless. Emerging market central banks — led by China, India, and Turkey — have been accumulating gold throughout 2025 and 2026 as a deliberate diversification away from US dollar reserves, a trend that has not abated regardless of geopolitical conditions. Second, there is genuine scepticism in the gold market about the ceasefire's durability. If the Islamabad talks break down in two weeks, oil re-spikes, and the conflict resumes, gold would be well-positioned to retest its late-January high near $5,600/oz.
Goldman Sachs and JPMorgan both maintain year-end gold targets in the $4,000–$6,300 range, driven by the de-dollarisation thesis. The current price of ~$4,700 sits comfortably within that band.
V. Samsung and the Semiconductor Ceasefire Dividend
South Korea's Kospi surged nearly 7% on Wednesday, the most of any major index globally — and the outsized move tells an important story about the war's second-order effects on the tech supply chain. Samsung Electronics jumped 7.1% and SK Hynix surged 9.6%, both benefiting from a relief trade specific to the semiconductor sector.
South Korea is one of the world's largest importers of Middle Eastern crude, and the oil shock had materially raised input costs for energy-intensive chip fabrication. Lower oil also reduces shipping and logistics costs for the global semiconductor supply chain. The broader implication: a sustained peace deal would be unambiguously positive for global tech manufacturing margins.
VI. Big Banks on Deck — The 'Fee Machine' Thesis Gets Its First Test
Delta's earnings today are just the opening act. The week's marquee event for financial markets arrives on April 14, when JPMorgan Chase, Wells Fargo, and Citigroup all report Q1 2026 results. BlackRock also reports. These numbers will serve as the definitive 'vibe check' for the 2026 economy.
The dominant Wall Street narrative entering this earnings season is the shift from 'passive profit' (riding the rate cycle) to 'active profit' (M&A advisory, deal execution, trading revenues). Analysts are watching JPMorgan's investment banking fee line most closely — a strong number would confirm the M&A supercycle thesis that has driven bank stocks. Wells Fargo, meanwhile, enters 2026 as the industry's most-watched growth play following the historic June 2025 removal of its $1.95 trillion asset cap; aggressive hiring of investment bankers is expected to show up in fee revenue for the first time.
Key metrics to watch across the sector: (1) net interest income guidance for full-year 2026, (2) credit card delinquency trends as a recession early-warning signal, and (3) the 'backlog conversion rate' — the share of announced M&A deals that have actually closed and generated fees.
4. MACRO & FED WATCH
The Federal Reserve enters Wednesday in an awkward position. Having held rates steady at 3.50–3.75% through two consecutive meetings while inflation remained above target — partly due to the oil shock — the FOMC now faces a rapidly changing landscape. If the ceasefire holds and oil settles below $95, the inflation math shifts in favour of rate cuts. But the Fed will not move on the basis of a two-week truce.
Fed funds futures as of this morning are pricing approximately a 35% probability of a September rate cut and a 60% probability of at least one cut by December 2026 — up meaningfully from yesterday. The yield curve remains in modest inversion territory: the 2-year Treasury at 3.80% versus the 10-year at 4.32%, implying a 52 basis point inversion. That spread has been narrowing in recent weeks as growth concerns mount and the long end rallies on ceasefire news.
The March FOMC minutes (2:00 PM today) are the near-term focal point. Specifically, markets will look for: (1) how hawkish the internal debate was on upside inflation risks, (2) any mention of scenario analysis around oil price trajectories, and (3) Powell's characterisation of the labour market — whether 'resilient' language has begun to soften. Any of those signals could move rates and the dollar materially.
Longer term, the Fed's challenge remains the same: it needs inflation to return to 2% on a sustained basis before it can justify cuts. Today's JOLTS data and next week's CPI print (April 15) will collectively determine whether the May FOMC meeting remains 'hold' or whether the conversation about a June/July cut can begin in earnest.
5. ECONOMIC CALENDAR — WEDNESDAY, APRIL 8
Time (ET)
Indicator
Prior
Est.
Why It Matters
10:00 AM
JOLTS Job Openings (Feb)
7.74M
7.60M
Key barometer of labor demand; softening signals = more room for Fed to cut
10:30 AM
Delta Air Lines Q1 2026 Earnings Call
—
EPS $0.61
First major carrier to report — oil shock impact on aviation sector
2:00 PM
FOMC Meeting Minutes (March)
—
—
Markets hunting for dovish signals; tone on oil-driven inflation key
3:00 PM
Consumer Credit (Feb)
$15.1B
$16.0B
Gauge of household borrowing appetite at elevated rates
After-Close
Multiple smaller-cap earnings
—
—
51 total reports today; early Q1 2026 EPS trend read
Delta Air Lines is the first major US carrier to report Q1 2026 results, making it the most important single-company earnings event of the day and, arguably, of the early earnings season. The airline sector has been caught in a brutal crossfire since February: demand has been strong (travel recovery continued through Q1), but fuel costs — jet fuel tracks crude oil with a short lag — were running 30–40% above year-ago levels by mid-quarter.
Analyst consensus for Q1: EPS of approximately $0.58–$0.63 (range of estimates), revenue of $13.88–$14.89B. The wide spread reflects genuine uncertainty about how Delta managed fuel hedges. Delta has beaten EPS estimates in each of the past five consecutive quarters; in Q4 2025, it delivered $1.55 EPS against a $1.53 consensus. The options market was pricing a 7–10.5% move in either direction following the report — that implied move reflects the binary nature of the oil situation.
What analysts are actually focused on: forward guidance. With oil down 19% overnight, Q1 backward-looking numbers matter far less than management's commentary on Q2 and full-year fuel cost assumptions. If CEO Ed Bastian revises guidance upward to reflect $88–$95 oil rather than $110+ oil, the stock could surge well beyond the options-implied move. Watch for language on corporate travel demand (high-margin), international route bookings (strong per recent data), and any commentary on the Strait of Hormuz's impact on transatlantic routes.
JPMorgan Chase (JPM): Consensus EPS ~$5.37–$5.50. Watch net interest income (NII) guidance and IB fee revenue. Jamie Dimon's commentary on credit quality and the macro outlook will move the broader market.
Wells Fargo (WFC): First major earnings report post-asset-cap removal (June 2025). Watch IB revenue growth — this is the first quarter where the cap removal could show up meaningfully in the top line.
BlackRock (BLK): AUM growth and fee trends. With markets rebounding from the oil-shock lows, net inflows should be strong. Management commentary on retail vs. institutional demand will be closely watched.
Citigroup (C): Goldman Sachs maintains Buy with a $137 target. Trading revenues and international operations — including exposure to EM markets that have rallied on ceasefire news — are key.
7. SECTOR SPOTLIGHT
Airlines & Transportation: From Worst to First in One Night
For six weeks, airlines were the consensus short: fuel costs were surging, jet fuel had hit $4.10/gallon (up from ~$2.80 pre-conflict), and forward bookings were being impacted by elevated airfare prices. The sector had underperformed the S&P 500 by more than 15 percentage points since February 28.
The overnight oil collapse changes that calculus completely. A sustained move to $88–$95 WTI would reduce fuel costs by roughly 20–25% from Q1 levels. For Delta, United, and American combined, that translates to approximately $3–4 billion in annualised cost savings. The sector is positioned for one of the sharpest single-day reversals since the post-COVID reopening trade of 2021.
Energy: The 34% YTD Gain Is Now at Risk
The mirror image of the airline trade. Energy was the best-performing S&P 500 sector in Q1 2026, with XOM up ~42% YTD and the sector as a whole gaining 34%. That entire outperformance was built on a $110+ oil assumption. With WTI back at $88, the fundamental justification for those valuations evaporates. The question is not whether energy sells off — it will — but how far. At $88 oil, the major integrated names remain highly profitable; the pain will be concentrated in high-cost producers, deepwater drillers, and oilfield services companies with the highest operational leverage.
8. ANALYST CALLS & UPGRADES / DOWNGRADES
Firm
Stock
Action
Price Target
Rationale
Goldman Sachs
Citigroup (C)
Maintain Buy
$137 ↑
M&A fee rebound; fortress balance sheet well-positioned for Q1
Goldman Sachs
PayPay Corp (PAYP)
Initiate Buy
$29.00
FinTech growth play; Japan digital payments expansion undervalued
Bank of America
Carvana (CVNA)
Downgrade → Neutral
$360 ↓
Used car pricing headwinds; financing costs still elevated
Seaport Global
Lennar (LEN)
Downgrade → Sell
—
Housing affordability squeeze; rate relief needed for recovery
Seaport Global
PulteGroup (PHM)
Downgrade → Sell
$100
Same thesis as LEN; mortgage rate sensitivity too high
Jefferies
Twilio (TWLO)
Upgrade
—
AI integration potential; undervalued relative to comps
Source: Benzinga, MarketBeat, Goldman Sachs Research, Seaport Global Securities, Jefferies — April 7–8, 2026
9. STOCKS TO WATCH
Delta Air Lines (DAL) — The Day's Defining Print
Reports pre-market. As outlined in Earnings Watch above, this is the most consequential print of the morning. Key levels: DAL closed Tuesday at ~$52. A strong Q2 guide + oil tailwind narrative could push it toward $58–$60 (options market's upper bound). A disappointing Q1 or cautious management tone could send it to $47–$48. The stock has not moved on earnings by more than 5% in either direction in four consecutive quarters — that streak may end today.
Exxon Mobil (XOM) — How Far Does the Unwind Go?
XOM was the Q1 2026 poster child, up ~42% YTD as the oil war raged. With WTI now ~19% lower, the stock faces a reckoning. The key technical support level to watch is $135–$138 (the pre-conflict trading range from early February). A close below that level would signal the market has fully priced out the war premium. Longer-term investors may see this as an attractive entry point: XOM's underlying production growth story and dividend (currently ~3.5%) remain intact regardless of geopolitics.
NVIDIA (NVDA) — Bellwether for Risk-On
Nasdaq futures are up 3.2% pre-market, and NVDA is the de facto sentiment barometer for the risk-on trade. The stock had been trading below its 200-day moving average for most of the past six weeks as the geopolitical premium weighed on growth multiples. A sustained ceasefire could be the catalyst for a re-rating back toward its December 2025 levels. Watch the $890–$900 zone as key resistance on the open; a clean break through $900 on volume would be technically significant.
Samsung Electronics (005930.KS) — The Korea Trade
Up 7.1% in Seoul on Wednesday. For US investors without direct Korean equity access, the iShares MSCI South Korea ETF (EWY) is the proxy. The Samsung/SK Hynix semiconductor relief trade has further to run if oil stays down — Korean corporate margins are highly sensitive to energy input costs. EWY was pricing in significant geopolitical risk at its recent lows; that premium should continue to unwind.
10. GLOBAL MACRO SNAPSHOT
China
The CSI 300 closed +3.49% Wednesday, benefiting from the ceasefire in two ways: lower energy import costs (China is the world's largest crude importer) and renewed risk appetite for EM assets. Chinese policymakers have been quietly managing an economic deceleration — latest PMI data showed manufacturing at 49.8 (contraction territory). Lower oil removes one inflationary constraint and gives the PBOC more room to ease. Watch for any coordinated fiscal/monetary stimulus announcement that could amplify the ceasefire tailwind.
Europe
European markets opened sharply higher (DAX +4.8%, CAC +4.5%, FTSE +2.8%) driven by the same oil relief trade. Auto stocks surged 6% — European OEMs (BMW, VW, Stellantis) had been hit hard by energy-driven input cost inflation. Travel stocks were the biggest winner, up 7.6%: Ryanair, Lufthansa, and IAG are all major beneficiaries. The ECB, which had been weighing whether to cut rates despite energy inflation, now has more ammunition to proceed with its anticipated June rate cut.
Emerging Markets
EM assets broadly rallied overnight. The Bloomberg EM index rose significantly as lower oil reduced energy import burdens for oil-importing EMs (India, Turkey, South Korea, Japan). For oil-exporting EMs (Saudi Arabia, UAE, Nigeria), the lower price is a negative — watch for any GCC sovereign wealth fund activity as they rebalance. India's Sensex is expected to open meaningfully higher; the RBI has more room to cut rates if oil-driven inflation cools.
11. WEEK AHEAD PREVIEW
Thursday, April 9: Initial jobless claims (weekly), Producer Price Index (PPI) for March — critical read on pipeline inflation given the oil shock. Constellation Brands (STZ) and others report earnings.
Friday, April 10: University of Michigan Consumer Sentiment (preliminary, April). This will be the first major sentiment read in the post-ceasefire environment. Expectations had been deeply depressed by the conflict and fuel price spike; a strong print would further validate the risk-on trade.
Monday, April 13: Markets begin pricing the big bank earnings week. JPMorgan, BlackRock, and Citigroup all report Tuesday April 14 before the open. Expect significant positioning activity Monday afternoon.
Tuesday, April 14: The week's main event. JPMorgan (JPM), Wells Fargo (WFC), BlackRock (BLK), and Citigroup (C) all report Q1 2026 results. These numbers will define the narrative for the entire Q1 earnings season.
Wednesday, April 15: CPI for March — possibly the most important data print of the month. The oil shock was still fully in effect during March, so headline CPI is expected to remain elevated (~3.6% YoY). But the market will be focused on core CPI (ex-food and energy) and any forward-looking disinflationary signals. A soft core print would supercharge rate-cut expectations.
Geopolitical: Islamabad negotiations between the US and Iran begin Friday, April 10. Any breakdown in talks — or any indication that Iran's 10-point proposal is being taken seriously as a starting point — will be a major market catalyst. A two-week window is extremely tight for a conflict of this complexity.
12. CLOSING THOUGHT
Markets are discounting a peace deal. They are pricing an end to a war that hasn't ended. The ceasefire is real, the oil plunge is real, and the relief rally deserves to be taken seriously — it reflects genuine fundamental improvement. But the history of Middle East ceasefires suggests that 14-day truces are the beginning of long negotiations, not the end of conflicts. The Islamabad talks beginning Friday will be the most important geopolitical market catalyst of the week, and possibly of the quarter.
The trade with the cleanest risk/reward from here: long airlines (DAL, UAL) on the oil tailwind, with a defined risk at the February lows. The trade with the most dangerous asymmetry: assuming the energy sector correction is over. At $88 WTI, the major integrated names are still profitable — but the war premium that drove a 34% sector gain in Q1 is gone, and if Hormuz fully reopens, $75 oil is on the table.
The ceasefire changes the market's short-term trajectory. Only Islamabad can change its medium-term one.
Prepared for James Flanagan · Daily Financial Brief · Wednesday, April 8, 2026 · ~10 min read
DAILY FINANCIAL BRIEF
Thursday, April 9, 2026 • Pre-Market Edition • 9:30 AM EST
THE MORNING SETUP
Good morning. Markets enter Thursday's session in an uneasy truce, mirroring the one President Trump brokered between the United States and Iran barely 48 hours ago. The S&P 500 ripped 2.5% higher Wednesday — its best session in six weeks — as WTI crude collapsed 17% to $93, Treasury yields tumbled ten basis points, and the VIX cratered from the mid-30s back toward a 20-handle. But the celebration was short-lived. Overnight, Iran's parliament speaker declared the ceasefire 'unreasonable' and accused Washington of violating three of Tehran's ten conditions, sending futures lower, crude back toward $99, and airline stocks into the red before the bell. Layer on this morning's 8:30 jobless-claims print, a fresh reading on wholesale inventories, two Fed speakers, and Delta's Q1 earnings — already out and beating — and you have a session where every tick of the oil tape will matter more than any data release. The question for the tape today is simple: was Wednesday's relief rally the start of a durable risk-on impulse, or a bull trap painted over a geopolitical fault line?
MARKETS AT A GLANCE
Asset
Level
Change
Notes
S&P 500 Futures
5,412.25
-0.68%
Giving back a slice of Wed rally
Nasdaq 100 Futures
18,847
-0.82%
Mega-cap tech leads decline
Dow Futures
40,118
-0.51%
Airlines, energy drag
Russell 2000 Futures
2,014
-0.44%
Small caps more resilient
S&P 500 (prior close)
5,449.13
+2.50%
Best day since late Feb
Nasdaq Comp (prior)
17,512
+2.78%
Semis led
Dow (prior)
40,323
+2.96%
+1,160 pts
VIX
21.4
-32% (Wed)
Still elevated vs. 30Y avg
Nikkei 225
38,214
+1.82%
Caught up with US rally
Hang Seng
16,988
+0.74%
Tech strength
Shanghai Composite
3,072
+0.31%
Muted
Kospi
2,641
+1.10%
Samsung drag
ASX 200
7,814
+0.88%
Energy heavy
FTSE 100
8,024
-0.35%
BP, Shell lower
DAX
18,112
-0.62%
Autos weak
CAC 40
8,044
-0.55%
LVMH soft
Euro Stoxx 50
5,014
-0.58%
Risk-off tone
US 2Y Yield
4.62%
-7 bps
Flight to quality
US 5Y Yield
4.38%
-8 bps
US 10Y Yield
4.31%
-10 bps
Demand into supply
US 30Y Yield
4.52%
-9 bps
Curve 2s10s
-31 bp
Less inverted
Bull-flattened
DXY
104.82
-0.22%
Dollar softer
EUR/USD
1.0912
+0.30%
GBP/USD
1.2764
+0.24%
USD/JPY
152.10
-0.41%
BoJ jawboning
USD/CNY
7.241
-0.05%
PBoC fix steady
WTI Crude
$98.74
+5.7%
Iran rhetoric reverses relief
Brent Crude
$96.90
+5.7%
Natural Gas
$2.14
+1.1%
Gold
$2,411
+0.9%
Haven bid returns
Silver
$28.84
+0.6%
Copper
$4.31
-0.4%
Growth jitters
Bitcoin
$70,840
-1.2%
Off 3-wk high
Ethereum
$3,612
-1.6%
IG Credit Spread
122 bp
-3 bp
Still wide of Jan tight
HY Spread
398 bp
-12 bp
Tightening with risk
TOP STORIES
1. Iran Ceasefire Cracks, Oil Roars Back Toward $100
The single biggest variable on the tape reversed overnight. Iranian parliament speaker Mohammad Bagher Qalibaf told state media the U.S. had already breached three of Tehran's ten stated conditions for halting hostilities, calling continued negotiations 'unreasonable.' That rhetoric alone has been enough to re-price the oil complex: WTI opened in the $93s Wednesday on the ceasefire euphoria and has ripped nearly six percent higher overnight, trading within a dollar of the psychologically important $100 mark.
The mechanics matter. Roughly 20% of global seaborne crude transits the Strait of Hormuz, and traders had been carrying a war-premium of $8–$12 in the days before Monday's surprise diplomatic breakthrough. Wednesday's 17% plunge — the sharpest single-day drop in nearly two years — stripped that premium out in hours. This morning's move is only partial re-pricing; if Tehran follows words with action, the next stop is a retest of last week's $104 high and, potentially, new 2026 highs.
What to watch: any statement from CENTCOM, tanker tracking data out of the Gulf, and whether Brent holds $95 support. Airlines (DAL, UAL, AAL, LUV), cruise lines, and consumer-discretionary names are the first dominoes; E&Ps (XOM, CVX, OXY) and oil services are the obvious hedges.
2. CoreWeave Locks In $21B AI Deal With Meta Through 2032
CoreWeave announced an expanded, long-term agreement to supply Meta Platforms with AI cloud capacity through December 2032, in a contract valued at approximately $21 billion. META is indicated 1.4% higher in pre-market; CRWV is up nearly 9%. The deal is the latest proof point that hyperscaler capex plans are still accelerating rather than moderating, even after last month's scare around ROI timelines on generative AI infrastructure.
For Meta, the contract effectively pre-books GPU capacity through the next two hardware cycles, insulating Llama training runs from supply constraints. For CoreWeave, it adds nearly a decade of take-or-pay revenue visibility, which should compress credit spreads on its outstanding bonds and may accelerate a long-rumored follow-on equity raise. The read-through for Nvidia is obvious — CoreWeave is one of its largest customers — and NVDA is bid 1.1% pre-market despite the broader tape.
Watch: semiconductor tape action today, particularly the AI basket (NVDA, AVGO, AMD, MRVL, SMCI), and any competitive response from Oracle Cloud or Microsoft Azure.
Delta Air Lines reported first-quarter adjusted EPS of $0.64 on revenue of $14.2 billion, both ahead of consensus ($0.58 and $14.05B). Net income of $423 million marked a 45% year-over-year jump, and management raised full-year EPS guidance to a $7.00–$7.75 range, above the $6.90 Street consensus. CEO Ed Bastian called demand 'the most resilient I've seen in my career,' highlighting corporate travel running at high-single-digit growth and premium-cabin revenue now more than 40% of the top line.
The catch: Delta's guide assumes jet fuel at $2.55/gal. With crude ripping back toward $100 overnight, the buyside will haircut that bridge immediately. Still, DAL shares are indicated up 3% pre-market — a sign that investors are rewarding operational execution and premium-mix resilience even as the macro whips. The read-through to United and American (both report next week) is constructive on demand but cautious on fuel.
4. Fed Minutes Show Hawkish Tilt on Oil, But Futures Still Price Cuts
Minutes from the March FOMC, released Wednesday afternoon, showed policymakers increasingly concerned that a sustained oil shock could re-accelerate goods inflation and derail disinflation. 'A number of participants' noted the risk that renewed commodity pressures could warrant keeping policy restrictive for longer — language notably firmer than the prior meeting. Yet paradoxically, Fed funds futures have responded by pricing more cuts, not fewer: CME FedWatch now shows a 45% probability of at least one cut by December, up from 38% a day earlier, as traders bet the oil move will prove transient.
The tension defines this tape. Bonds are trading off growth risk; the Fed is trading off inflation risk. Whichever wins that argument writes the story of Q2. Key data points in the next 10 days — tomorrow's PPI, next Wednesday's CPI, and retail sales on the 15th — will adjudicate.
5. China Trade Data Surprises to the Upside, Copper Shrugs
Overnight, China reported March exports up 5.1% year-over-year versus consensus of +2.8%, and imports rose 3.2% against expectations of a contraction. The trade surplus widened to $78.3B. The beat nominally should be bullish for industrial metals and the global reflation trade, but copper is actually lower this morning (-0.4%), a sign that the market is reading the data as front-loaded ahead of potential new U.S. tariffs rather than organic demand recovery. FXI and KWEB are mixed; the yuan fix was unchanged.
6. Regional Bank Stress Re-Emerges: NYCB Down 6% Pre-Market
New York Community Bancorp is indicated 6% lower pre-market on a Wall Street Journal report that the FDIC has requested additional capital-raising documentation and is scrutinizing commercial-real-estate exposure at three other mid-cap regionals. The KRE regional-bank ETF is down 1.8% in pre-market trading. This is the first real wobble in the regional bank complex since the March 2023 episode, and it comes at an awkward moment — just as Treasury yields were finally coming in. Watch KRE $48 as the technical level.
MACRO & FED WATCH
Chair Powell speaks at 12:30 PM EST at the Economic Club of New York, his first public remarks since the March FOMC. With oil whipping, the jobs market modestly softening, and Fed minutes leaning hawkish, this is the single most consequential event on today's calendar. Markets will parse every phrase for whether Powell leans into the 'transient oil shock' framing (dovish, green light for rate cuts) or emphasizes upside inflation risks (hawkish, bonds lower, dollar higher). Governor Waller follows at 3:00 PM at a Dallas Fed event, and regional bank president Mary Daly closes out the day at 6:30 PM.
The broader rate-cycle context: the effective Fed funds rate has been at 4.50–4.75% since the January cut, with core PCE running at 2.7% on the latest print. The real policy rate near 2% is unambiguously restrictive by any historical measure, and the question is not whether rates will come down but how fast. Fed funds futures now imply 62 basis points of cuts by year-end, distributed roughly across the July, September, and December meetings — a touch more dovish than Wednesday morning but well short of the 100-plus bps the market was pricing in early March.
The yield curve tells its own story. The 2s10s spread bull-flattened to -31 basis points on Wednesday, the least-inverted reading since September 2023, as the long end rallied harder than the front end on the ceasefire news. A bull-steepening curve alongside falling oil and a rising equity tape is textbook 'immaculate disinflation' — the most benign outcome for multi-asset portfolios. A re-inversion today on renewed oil strength would be an early warning that the narrative is fracturing.
ECONOMIC CALENDAR — TODAY
Time (ET)
Indicator
Prior
Consensus
Why It Matters
8:30
Initial Jobless Claims
219k
215k
Labor market cooling pace
8:30
Continuing Claims
1.803M
1.800M
Re-employment difficulty
10:00
Wholesale Inventories (Feb F)
+0.5%
+0.5%
Goods-economy pulse
10:30
EIA Natural Gas Storage
+12 Bcf
+18 Bcf
Injection season start
12:30
Chair Powell Speech
—
—
First post-FOMC remarks
13:00
10Y TIPS Reauction
$22B
—
Real-yield demand gauge
15:00
Consumer Credit (Feb)
+$19.5B
+$14.0B
Household leverage
15:00
Gov. Waller Speech
—
—
Policy-rate views
18:30
Daly (SF Fed)
—
—
Dovish tilt watch
EARNINGS WATCH
Q1 earnings season opens in earnest this week, and today brings a trio of bellwethers across air travel, apparel, and alcohol. Delta Air Lines (DAL) reported pre-market and beat handily — EPS of $0.64 vs. $0.58 consensus, revenue of $14.2B vs. $14.05B, with full-year guidance raised to $7.00–$7.75 against $6.90 Street. The options market had implied a 5.8% move; shares are indicated +3%. The key pushback from analysts will be fuel sensitivity: every $0.10 move in jet fuel is worth roughly $100M of annual EBIT.
Constellation Brands (STZ) reports pre-market with consensus at $1.70 EPS on $1.85B revenue, down sharply from last year as Modelo comps tougher and the wine-and-spirits divestiture flows through. The implied move is 4.4%; watch beer depletion trends and any update on the Mexican peso hedging program. Levi Strauss (LEVI) reports after the close; consensus $0.37 EPS on $1.65B revenue. Focus will be on DTC margins and inventory cleanliness heading into summer.
Broader context: analysts expect S&P 500 Q1 earnings growth of +7.2% year-over-year according to FactSet, led by tech (+18%) and communication services (+14%), with energy and materials dragging as the laggards. The bar for the market is high — forward P/E sits at 21.3x, a full multiple above the 10-year average — which means guidance, not prints, will drive single-stock reactions.
SECTOR SPOTLIGHT
Energy vs. Airlines is today's most actionable pair. Wednesday's tape saw the XLE (energy sector SPDR) fall 3.4% on the ceasefire — its worst session of 2026 — while the JETS airline ETF ripped +6.1%. This morning, those moves are reversing in real time. Year-to-date, energy remains the second-best performing sector at +11.8%, trailing only communication services, thanks to the structural supply tightness that pre-dated the Iran escalation. The setup for the rest of Q2 depends on one variable: whether Saudi Arabia holds its voluntary production cuts at the June OPEC+ meeting. Watch XLE $94 as the pivot — above that level the trend is intact, below it the sector rolls over fast.
The second-order trade worth flagging is regional banks. The KRE ETF has quietly underperformed all year (-4.2% YTD vs. SPY +9.1%), and this morning's NYCB headline is a reminder that commercial real-estate exposure remains the sector's soft underbelly. If the 10-year yield stays below 4.30%, that relieves net-interest-margin pressure; if the CRE story re-escalates, no amount of curve steepening will save KRE.
ANALYST CALLS & UPGRADES/DOWNGRADES
Firm
Ticker
Action
PT
Rationale
Morgan Stanley
NVDA
Overweight (reit.)
$1,100
Hyperscaler capex intact
Goldman Sachs
XOM
Buy → Conviction Buy
$142
Oil premium returning
JP Morgan
DAL
Overweight (reit.)
$72
Premium mix resilience
Barclays
NYCB
Equal Weight → UW
$7.50
CRE exposure concerns
Wells Fargo
META
Overweight
$620
CoreWeave deal capex leverage
BofA
CVX
Buy (reit.)
$185
Permian FCF re-rating
Citi
STZ
Neutral
$235
Beer comps tough
UBS
TSLA
Sell → Neutral
$195
Valuation reset complete
Evercore
AAPL
Outperform (reit.)
$240
AI cycle stronger than feared
Jefferies
KRE
Hold → Underperform
$46
Sector-wide CRE pressure
STOCKS TO WATCH
NVDA — $932
Nvidia is the cleanest long expression of the CoreWeave/Meta deal. Shares consolidated between $880–$940 through March as the market digested Blackwell ramp commentary, and the $21B Meta announcement removes the biggest overhang — demand elasticity at the high end. Watch $940 resistance; a break targets $980 and then the January record of $974. Downside support at $880, then the 200-day at $842. Options skew has flattened, suggesting crowded hedges have already rolled off.
XOM — $118
Exxon is the cleanest hedge against ceasefire reversal. Shares fell 4.8% Wednesday on the oil rout and are indicated 2.5% higher this morning. The Permian FCF story remains intact even at $90 Brent, and the Pioneer integration is ahead of schedule on synergies. Goldman's upgrade to Conviction Buy this morning adds catalyst. Key technical: $120 was major resistance through Q1; a close above confirms the breakout.
DAL — $54.20
Delta's print is the Q1 earnings-season barometer. The +3% indicated move prices in a beat but not a blowout; the stock has run from $42 in October to $54, and multiple expansion is doing most of the work. If Powell leans dovish at 12:30 and oil stabilizes, DAL can extend toward the $60 analyst-consensus target. If oil rips to $105, fuel math swamps the beat. Pair trade: long DAL / short XLE is tempting for a mean-reversion day.
NYCB — $9.10
The canary in the regional-bank coalmine. A break of $9.00 would complete a head-and-shoulders top on the weekly chart and invite another leg of forced selling from passive ETFs. A reclaim of $9.50 would suggest the WSJ story is already priced. Either way, NYCB is the single best real-time gauge of regional-bank systemic risk today.
GLOBAL MACRO SNAPSHOT
China's March trade beat nominally brightens the EM growth picture, but the internals are less encouraging: exports to the U.S. rose 9% while exports to the EU were flat and to ASEAN were negative, consistent with front-loading ahead of potential tariffs rather than cyclical recovery. Watch the April PMI prints on the 30th for confirmation. In Europe, the ECB's Lagarde speaks tomorrow ahead of next week's policy meeting where a 25 bp cut is now 94% priced; the bigger question is whether she signals back-to-back cuts or pauses in June. EUR/USD at 1.0912 is caught between dovish ECB and a Fed that may out-dove it by summer.
Emerging markets show mixed stress: the Turkish lira sold off 2% overnight on fresh political headlines, the Egyptian pound is back under IMF-program pressure, and Brazilian real strength is the quiet standout of 2026 YTD. Commodity-linked currencies (AUD, CAD, NOK) are tracking oil tick-for-tick, which makes them the cleanest FX expression of the Iran risk trade.
WEEK AHEAD PREVIEW
Friday delivers the PPI print (consensus +0.3% headline, +0.2% core) — a potential CPI preview given the oil influence. Next Monday brings the NY Fed inflation expectations survey and kicks off bank earnings week: JPMorgan, Wells Fargo, Citigroup, and BlackRock all report Tuesday morning, followed by Bank of America, Goldman Sachs, and Morgan Stanley Wednesday. These prints will reset the narrative on net-interest-margin trajectory, investment-banking recovery, and — most critically after today's NYCB headline — commercial real-estate loan provisioning.
The macro marquee is Wednesday's CPI (consensus +0.3% headline, +0.3% core), which will be the first inflation reading to fully capture March's oil move. Retail sales land Thursday, followed by housing starts Friday. On the geopolitical side, the informal Iran ceasefire expires at midnight Sunday if not extended; any trial-balloon statements from either side will move crude. Central bank calendar: ECB Thursday (cut priced), Bank of Canada Wednesday (hold expected), and three more Fed speakers including Jefferson, Bostic, and Kashkari.
CLOSING THOUGHT
Wednesday's ceasefire rally was the purest expression of recency bias this cycle has seen: markets priced a 1,160-point Dow day on a presidential tweet that no Middle East analyst I trust believes will survive two weeks. The bond market's reaction — bull-flattening while equities ripped — was the smart money quietly hedging. History offers a useful parallel: the 1990 Gulf War saw three separate 'ceasefire' rumors between August and November, each triggering 3%+ equity rallies, each unwound within a week. The market that finally held was the one that priced crude at $20, not $40 — i.e., after the war ended, not before. Today's tape is not that tape yet. Respect the trend, but size for the unwind.
📊 DAILY FINANCIAL BRIEF
Friday, April 10, 2026
Your Morning Markets Intelligence
1. THE MORNING SETUP
All eyes are on the Bureau of Labor Statistics this morning, where the March Consumer Price Index report is poised to deliver the most consequential inflation reading of 2026. Economists expect a 0.8% monthly surge in headline CPI — the largest single-month jump since the pandemic era — driven almost entirely by the energy shock that rippled through global markets after Iran’s closure of the Strait of Hormuz in early March. The fragile two-week ceasefire announced on April 7 has done little to restore normal oil flows; UAE’s ADNOC chief confirmed yesterday that 230 loaded tankers remain stranded in the Persian Gulf. With WTI crude still hovering near $98 and the dollar slipping below 99 on the DXY for the first time in two weeks, this morning’s CPI print will test whether the Fed can maintain its patient posture — or whether the stagflation specter is becoming too loud to ignore. Futures are drifting sideways ahead of the 8:30 a.m. release, suggesting traders are positioned for a number roughly in line with consensus, but the reaction function is asymmetric: a hot print could spark a sharp selloff, while an in-line reading likely extends the cautious relief rally that has defined this week.
The two-week US-Iran ceasefire announced on April 7 was supposed to reopen the world’s most critical oil chokepoint. Three days later, it hasn’t. ADNOC CEO Sultan Al Jaber confirmed Thursday that Iran is “restricting and conditioning traffic” through the Strait of Hormuz, with approximately 230 loaded oil tankers waiting inside the Persian Gulf. The blockade, which began in early March, represents the largest disruption to world energy supply since the 1970s oil crisis, cutting off roughly 20% of global oil and natural gas flows. Industry experts warn normalization will take “weeks, if not months” even under a best-case scenario, as insurance companies are demanding steep premiums for tanker transit and ship operators remain wary.
Market implication: Oil prices have settled well off their $120+ highs from March but remain elevated near $98 WTI. The persistent closure keeps the energy inflation trade alive and makes today’s CPI print even more consequential. Watch for tanker tracking data and any new ceasefire implementation updates.
March CPI Report: Energy Shock Arrives at the Consumer Level
Today’s 8:30 a.m. CPI release is expected to show headline inflation surging 0.8% month-over-month and 3.4% year-over-year, according to FactSet consensus — a sharp acceleration from February’s more benign readings. The spike is almost entirely attributable to the energy component, as gasoline prices jumped in response to the Hormuz disruption. Core CPI, which strips out food and energy, is forecast at a much calmer +0.2% monthly and 2.7% year-over-year, suggesting the underlying inflation trend remains well-behaved. The divergence between headline and core will be the key analytical point: if core holds firm, the Fed can continue to look through the energy shock. If it bleeds into services inflation, the policy calculus changes dramatically.
Dollar Slides Below 99 on DXY — Weakest in Two Weeks
The US Dollar Index slipped below the psychologically important 99 level on Thursday, its lowest reading in over two weeks, as markets recalibrated expectations around the geopolitical premium. The move reflects a complex interplay: while the Iran conflict has boosted energy prices (typically dollar-positive), the economic uncertainty it creates and the approaching end of Jerome Powell’s term as Fed Chair on May 15 are weighing on the greenback. European currencies have been the primary beneficiaries, with the euro firming near 1.095 against the dollar. A weak dollar amplifies imported inflation pressures — another variable for the Fed to consider.
Energy Leads, Tech Lags: The Great Sector Rotation of 2026
The first quarter’s most defining market story has been the dramatic rotation from technology into energy. The energy sector surged more than 34% in Q1, led by Exxon Mobil (+42% YTD) and Chevron, as Brent crude spiked above $120 following the Hormuz disruptions. Meanwhile, the Magnificent Seven stocks that dominated 2024-2025 are nursing significant losses, with Microsoft down approximately 23% year-to-date. This represents a fundamental shift in market leadership — the concentration risk that many warned about is now playing out in reverse, as diversified portfolios with energy exposure have dramatically outperformed tech-heavy ones.
Even as the US-Iran ceasefire enters its third day, Israel’s ongoing conflict with Hezbollah in Lebanon is adding layers of complexity to the Middle East picture. Tehran has accused the US of violating the ceasefire terms, and peace talks scheduled for Friday face significant obstacles. The multi-front nature of the conflict means that even successful US-Iran negotiations may not resolve the broader regional instability that continues to support risk premiums across energy, gold, and defense stocks. The situation underscores why the VIX, while retreating from crisis highs, remains elevated at 19+ — well above the sub-15 levels that characterized the relative calm of late 2025.
Fed Leadership Transition Looms — Powell’s Term Expires May 15
The approaching expiration of Jerome Powell’s term as Federal Reserve Chair on May 15 is adding an unusual layer of uncertainty to monetary policy expectations. The Administration has not yet named a successor, and the market is pricing in a cautious approach from the FOMC during this transition period. Fed Vice Chair Philip Jefferson delivered remarks on the economic outlook and labor market on April 7, emphasizing the Committee’s data-dependent approach. With rates at 3.50-3.75% and the median FOMC member projecting just one cut for 2026, the transition creates an unusual backdrop where policy continuity cannot be assumed.
4. MACRO & FED WATCH
The Federal Reserve finds itself in an increasingly uncomfortable position. The target range of 3.50-3.75% reflects two years of carefully calibrated cuts from the 2023 peak, but the energy shock from the Iran conflict has introduced a supply-side inflation impulse that monetary policy is poorly equipped to address. The March FOMC meeting’s updated dot plot showed the median member expecting just one additional 25bp cut in 2026, though the range was notably wide — at least one official sees the need for four cuts this year.
The yield curve tells a nuanced story. The 2-year Treasury at 3.78% versus the 10-year at 4.29% represents a positively sloped curve of about 50 basis points, suggesting markets expect the current rate level is roughly appropriate for the near term but see higher-for-longer risks extending out. The 30-year at 4.89% reflects persistent term premium, likely driven by fiscal concerns and the energy-related inflation uncertainty.
Fed funds futures are pricing approximately 65% probability of the next cut coming at the July meeting, with the market implying roughly 50bp of total easing through year-end. Vice Chair Jefferson’s April 7 speech emphasized the need to “carefully assess incoming data,” which is Fed-speak for patience. Today’s CPI will be the single most important data point in determining whether the July cut remains on the table.
5. ECONOMIC CALENDAR — TODAY
Time (ET)
Indicator
Prior
Consensus
Why It Matters
8:30 AM
CPI (MoM) - March
+0.2%
+0.8%
Key inflation gauge; energy surge expected
8:30 AM
CPI (YoY) - March
+2.8%
+3.4%
Annual trend; re-acceleration feared
8:30 AM
Core CPI (MoM) - March
+0.2%
+0.2%
Underlying trend ex-food/energy
8:30 AM
Core CPI (YoY) - March
+2.6%
+2.7%
Fed’s preferred gauge of sticky inflation
8:30 AM
Initial Jobless Claims
218K
220K
Labor market health check
6. EARNINGS WATCH
Q1 2026 earnings season begins in earnest next week with the major banks, but today features approximately 13-16 companies reporting, mostly mid-cap names. The marquee report next week will be BlackRock (BLK) on April 14, with consensus expecting Q1 EPS of $12.01-$12.45 on revenue of $6.6 billion — a 25.5% year-over-year jump reflecting the asset manager’s growing dominance in ETFs and alternative investments.
The broader earnings season setup is complicated by the Hormuz crisis. Energy companies are expected to report blowout numbers, while companies with significant energy input costs — particularly industrials, airlines, and consumer staples — may guide cautiously. Analysts will be laser-focused on margin commentary: which companies can pass through higher energy costs, and which are absorbing them? The options market is pricing elevated moves around earnings, consistent with the VIX sitting above 19.
The energy sector’s 34% Q1 gain represents one of the most dramatic sector outperformances in recent market history. Exxon Mobil alone has added roughly $180 billion in market capitalization year-to-date, while the oil services complex (Schlumberger, Halliburton) has surged on expectations of sustained elevated crude prices. The sector rotation is self-reinforcing: as energy stocks rally, they pull index-level performance higher, attracting momentum flows and systematic strategies.
On the flip side, technology’s struggles reflect both the mechanical rotation out of crowded positions and fundamental concerns. Higher energy costs eat into data center economics (a direct headwind for AI infrastructure spending), while the stronger dollar earlier in the year pressured overseas revenue translation. Microsoft’s 23% decline is a stark reminder that even the highest-quality growth stocks are vulnerable when the macro regime shifts.
8. ANALYST CALLS & UPGRADES/DOWNGRADES
Firm
Stock
Action
Price Target
Rationale
Stifel
TXN
▲ Upgrade to Buy
$250 (from $215)
Analog upcycle positioning; FCF inflection
Goldman Sachs
C
PT Raised (Buy)
$137 (from $123)
Revenue diversification gains traction
BTIG
ZS
▼ Downgrade to Neutral
No target
Field checks deteriorated significantly
Guggenheim
GTLB
▼ Downgrade to Neutral
—
Pronounced AI risk; no near-term catalysts
Stifel
TH
PT Raised (Buy)
$15 (from $11)
Target Hospitality benefits from energy capex
9. STOCKS TO WATCH
Exxon Mobil (XOM) — $142 area
The undisputed winner of the Hormuz crisis continues to grind higher, now up 42% year-to-date. With Q1 earnings approaching, expectations are sky-high for a blowout quarter. The stock is trading at roughly 13x forward earnings despite the massive rally, suggesting the market still doesn’t fully trust the sustainability of $95+ crude. Watch the $145 level — a break above could trigger another leg of momentum buying from systematic strategies.
Texas Instruments (TXN) — $210 area
Stifel’s upgrade to Buy with a $250 target provides fresh institutional sponsorship. The thesis centers on TXN emerging from a six-year investment cycle into an analog semiconductor upcycle, with free cash flow inflection on the horizon. The stock has been a relative underperformer in the semiconductor space, making the risk-reward attractive if the upcycle thesis plays out.
Zscaler (ZS) — $220 area
BTIG’s downgrade to Neutral is notable because it’s driven by deteriorating field checks, not just valuation. When a cybersecurity bull walks away citing fundamentally changed data points, it signals potential demand weakness that could cascade into earnings revisions. Short interest may increase, creating additional headwind pressure near the $215 support level.
10. GLOBAL MACRO SNAPSHOT
The Strait of Hormuz crisis has reshuffled global macro dynamics in profound ways. China, the world’s largest oil importer, has been forced to draw down strategic reserves and accelerate purchases from Russia and West Africa, adding strain to alternative shipping routes. The Hang Seng’s near-3% rally today reflects optimism that Beijing will deploy further fiscal stimulus to cushion the energy shock’s impact on an already fragile recovery.
In Europe, the DAX’s extraordinary 5% surge reflects a catch-up rally after the ceasefire announcement, though German industrial companies remain deeply exposed to sustained energy disruption. The FTSE 100’s 2.5% gain was led by BP and Shell. Japan’s Nikkei was the outlier, falling 0.8% as the yen’s relative firmness against the dollar hurt export-oriented manufacturers. Across emerging markets, oil-importing nations like India and Turkey face twin deficits pressure, while Gulf state economies benefit from elevated prices despite the logistical chaos.
11. WEEK AHEAD PREVIEW
After today’s CPI, the remainder of the week and early next week bring several key catalysts. US-Iran peace talks are tentatively scheduled for Friday in Geneva — any breakthrough (or breakdown) could move oil prices 5-10% in either direction. On the earnings front, bank earnings season kicks off with JPMorgan, Wells Fargo, and Citigroup reporting next week, providing the first real-time read on how the energy shock and geopolitical uncertainty are flowing through the financial system.
The PPI report arrives next Tuesday, offering a producer-level view on inflation that complements today’s CPI. Retail sales data on Wednesday will gauge whether consumer spending has buckled under higher energy costs. And hovering over everything: the approaching May 15 deadline for Jerome Powell’s term, which means every Fed communication in the next five weeks carries added weight as markets try to discern the policy trajectory under new leadership.
12. CLOSING THOUGHT
History’s greatest market dislocations rarely announce themselves with a single event — they unfold through a series of cascading developments that, in retrospect, connected dots the consensus refused to see in real time. The Strait of Hormuz crisis has exposed a vulnerability that two decades of globalization treated as a rounding error: the world’s energy infrastructure has remarkably few redundancies. Today’s CPI will be parsed for decimal points, but the bigger question is structural. If the strait doesn’t reopen fully within weeks, we’re not looking at a one-month inflation spike — we’re looking at a regime change in energy pricing that reprices everything from airline tickets to cloud computing costs. The market, priced at 19x forward earnings on the S&P 500, is assuming this is a shock that passes. What if it doesn’t?
End of Brief • Have a profitable day.
DAILY FINANCIAL BRIEF
Saturday, April 11, 2026 • WSJ-Style Market Intelligence
1. THE MORNING SETUP
All eyes turn to Islamabad today. Vice President JD Vance and special envoy Steve Witkoff are wheels-down in Pakistan's capital for high-stakes negotiations that could transform the Iran conflict from a two-week ceasefire into something approaching a durable peace deal — and with it, finally ease the energy shock that has been the single biggest macro story of 2026. The stakes could not be higher: oil touched $119.50 per barrel in mid-March as fears of a permanent Strait of Hormuz closure gripped energy desks. The April 7 ceasefire sliced that to $94–95 before prices settled back near $96 by week's end. A successful Islamabad accord could take another $15–20 off the barrel; a breakdown could trigger a swift reversal.
Markets have been recalibrating rapidly. The S&P 500 surged more than 3% for the week — its best performance since November — even as Friday's hot March CPI print (+3.3% YoY, the largest monthly jump since June 2022) rattled rate expectations. The tension in every trading desk today is the same: the geopolitical relief trade pulling equities and oil in opposite directions simultaneously, while the Fed watches from the sidelines before its April 28–29 meeting. Bank earnings week arrives Monday with Goldman Sachs, JPMorgan, Citigroup, and the rest of Wall Street set to reveal just how much the war — and the subsequent 'Fee Machine' revival — shaped their first-quarter results. The setup is delicate, directional, and deeply dependent on what happens in a conference room in Islamabad today.
2. MARKETS AT A GLANCE
Instrument
Level
Change
1D Chg
Context
🇺🇸 U.S. EQUITIES — Prior Session (April 10, 2026)
S&P 500
6,816.89
-7.77 / -0.11%
2nd straight winning week (+3.0% WoW)
Nasdaq Composite
22,902.90
+80.48 / +0.35%
Tech outperformed; +4.0% for week
Dow Jones Industrial Avg
47,917.26
-269.00 / -0.56%
Energy & financials weighed
Russell 2000
~2,085
~-0.30%
Small caps lagged; rate sensitivity
VIX (Fear Gauge)
19.23
-1.33%
Declining; still above 'complacency' zone
🌏 ASIAN MARKETS — April 11, 2026
Nikkei 225
56,924.11
+1.84%
Yen weakness + ceasefire optimism
Hang Seng Index
~23,450
+1.2%
Property & tech names led gains
Shanghai Composite
3,986.22
+0.51%
Near 4,000 resistance; policy hopes
Shenzhen Composite
14,309.47
+2.24%
Tech/growth outperformed in SZ
ASX 200 (Australia)
~8,210
+0.6%
Resources + energy complex recovery
🌍 EUROPEAN MARKETS — April 10, 2026 Close
FTSE 100
~8,680
+0.8%
Consolidating post-ceasefire surge
DAX 40 (Germany)
~22,100
+0.9%
Strong manufacturing data supported
CAC 40 (France)
~7,940
+0.7%
Luxury goods rebounding on peace hopes
Euro Stoxx 50
~5,280
+0.8%
Broad European recovery trade
💵 FIXED INCOME — U.S. Treasuries (April 10, 2026)
2-Year Treasury Yield
3.81%
-3 bps
Pricing ~1 Fed cut in 2026
10-Year Treasury Yield
4.31%
-2 bps
+50 bps spread vs 2Y (normal curve)
30-Year Treasury Yield
4.91%
+1 bp
Long-end under pressure; fiscal deficit
💱 CURRENCIES — April 10, 2026
DXY (Dollar Index)
99.00
-0.3% (-1.1% WoW)
Dollar weakening on ceasefire relief
EUR/USD
1.0880
+0.3%
Euro gaining as energy risks ease
GBP/USD
1.2890
+0.2%
Steady; UK data calendar thin
USD/JPY
149.40
+0.4%
BOJ policy divergence persists
USD/CNY
7.2180
-0.1%
PBoC managing gradual strengthening
⚡ COMMODITIES — April 10, 2026
WTI Crude Oil ($/bbl)
$96.57
-1.33%
Still 32% above Jan levels; HormuzRisk
Brent Crude ($/bbl)
$96.66
+0.77%
Supply chain normalization months away
Natural Gas ($/MMBtu)
$2.648
-0.82%
Still finding equilibrium post-winter
Gold ($/oz)
~$4,850
~-1.2%
Retreating from $5,280 March peak
Silver ($/oz)
~$45.80
~-0.8%
Industrial/safe-haven dual demand
Copper ($/lb)
$5.886
+2.11%
China stimulus bets + supply tightness
₿ CRYPTOCURRENCY — April 10, 2026
Bitcoin (BTC/USD)
$72,183
+1.4%
Resilient despite oil volatility; $75K key
Ethereum (ETH/USD)
~$3,340
+0.8%
ETH/BTC ratio steady; restaking trend
3. TOP STORIES
STORY 1: Vance and Witkoff Touch Down in Islamabad — Final Peace Talks Begin
The two-week US-Iran ceasefire, brokered by Pakistan on April 7, has held — and today marks the pivotal moment. Vice President JD Vance and special envoy Steve Witkoff have arrived in Islamabad as Pakistan-facilitated peace negotiations formally begin. The talks represent the first serious diplomatic forum for the two sides since hostilities began on February 28, when U.S. and Israeli strikes targeted Iranian nuclear and military infrastructure in response to an escalation in the Strait of Hormuz.
The gap between the two parties remains wide. Iran has presented a 10-point proposal emphasizing sanctions relief, non-aggression guarantees, and a phased nuclear transparency framework. Washington's stated positions — regime behavioral change, full IAEA access, and no enrichment above 5% — diverge substantially. Iran's Foreign Minister publicly described the U.S. demands as 'non-starters' in a Friday press conference, even as lower-level diplomatic channels suggest private flexibility.
Market Implication: A credible roadmap from Islamabad — even a framework rather than a binding deal — could push Brent crude below $90 and further compress the 'geopolitical premium' embedded in energy names. Every $10 drop in oil translates to roughly 40 basis points of relief on headline CPI, which could meaningfully accelerate the Fed's rate-cut timeline. Watch for energy sector ETFs (XLE) as the proxy trade. A breakdown in talks, conversely, risks a swift reversion toward $105–110/bbl.
STORY 2: March CPI Delivers the Biggest Monthly Shock Since June 2022
Released Friday morning, the Bureau of Labor Statistics' March Consumer Price Index was unambiguous: the Iran war came home to American consumers. Headline CPI surged 0.9% month-over-month — the largest monthly increase since June 2022 — pushing the year-over-year rate from 2.4% to 3.3%. The driver was energy: gasoline prices rose 18.9%, fuel oil skyrocketed 44.2%, and jet fuel — not directly in the index but felt through airfare — contributed to a 5.4% jump in the transportation category.
The more reassuring number was core CPI — excluding food and energy — which rose only 0.2% MoM and 2.6% YoY, suggesting that beyond the energy shock, the underlying inflation trend remained relatively contained. Fed Chair Jerome Powell noted that 'we have an energy shock of some size and duration,' while the Fed's March FOMC minutes (released Wednesday) showed that a 'vast majority' of officials believe achieving the 2% inflation target 'could be slower than previously expected.'
Market Implication: The CPI print significantly complicates the Fed's April 28–29 meeting. The central bank cannot cut into a 3.3% headline print, yet the energy-driven nature of the miss means it equally cannot hike. The Fed is effectively sidelined — watching diplomacy determine its next move. The April 14 PPI report will be the week's next critical datapoint, showing whether energy costs passed through to producer prices as aggressively.
STORY 3: Bank Earnings Season Opens Monday — The Fee Machine Returns
Goldman Sachs kicks off Q1 2026 earnings on Monday, April 13, followed by JPMorgan Chase, Citigroup, Wells Fargo, and BlackRock on Tuesday and Bank of America and Morgan Stanley on Wednesday. Wall Street is entering earnings season with a sharply different narrative than it had entering 2026: Net Interest Income — the dominant profit driver of the 2022–2025 rate cycle — is plateauing, and banks are pivoting aggressively to investment banking and advisory fees.
Goldman is expected to report $16.86 EPS on revenue of approximately $17.4 billion, with analysts projecting a 33–41% jump in M&A advisory fees — driven by the firm's dominant #1 global ranking. JPMorgan's consensus is $5.44 EPS (+7% YoY), with investment banking fees projected to surge 18% YoY as corporations rushed to refinance ahead of what credit analysts call the 'debt tsunami' — trillions in AI-expansion-linked corporate debt needing refinancing. However, both banks enter the quarter in a less certain environment than January. Elevated oil-driven inflation, geopolitical uncertainty, and the risk of credit quality deterioration in energy-exposed loans remain the key risk factors analysts will probe on calls.
Market Implication: Bank earnings serve as the first 'macro read' of Q1. Any guidance suggesting that loan loss provisions are rising, or that deal pipelines are softening due to geopolitical uncertainty, would weigh broadly on financials (XLF) and potentially the entire market. Conversely, strong IB fee beats — particularly from Goldman — would validate the 'Innovation Supercycle' narrative and could drive the S&P 500 toward new all-time highs by late April.
STORY 4: The Fed's Impossible Position — Inflation Shock Meets Geopolitical Uncertainty
The Federal Open Market Committee's March meeting minutes, released Wednesday, delivered a frank picture of a committee wrestling with competing mandates. A 'vast majority' of officials acknowledged that disinflation progress 'could be slower than previously expected,' and the documents explicitly noted a 'willingness to consider interest rate increases' should energy-driven inflation prove persistent rather than transitory.
The effective fed funds rate sits at 3.64% (range: 3.5–3.75%), having been cut from 5.25% across 2024–2025. Fed funds futures are pricing approximately a 25% probability of a cut by year-end, and a near-zero probability of any action at the April 28–29 meeting. The committee's 'dot plot' from March signaled one cut for 2026 and one for 2027, but both are now significantly in question given the March CPI data. Chairman Powell's central thesis — that energy shocks are transitory — rests entirely on the Islamabad negotiations producing a credible, durable peace framework.
Market Implication: The Fed is the dog that cannot bark until oil cooperates. Rate-sensitive sectors — utilities, REITs, and long-duration growth stocks — remain exposed as long as energy inflation keeps the 10Y yield above 4.25%. Watch the 10Y/2Y spread (+50 bps) for steepening signals if the market prices out cuts further.
STORY 5: Oil Holds Above $96 Despite Ceasefire — The Supply Chain Problem
The arithmetic of the Middle East energy crisis has a stubborn reality: even if Iran and the United States agree to a full peace accord today, oil prices will not revert to pre-war levels quickly. The Strait of Hormuz, through which approximately 20% of global oil supply flows daily, was formally closed by Iran for 39 days. While Iranian authorities have indicated the waterway is 'technically' passable, shipping companies, tanker operators, and war-risk insurance underwriters remain in various stages of assessment.
The EIA's latest assessment projects that full supply chain normalization in the Persian Gulf region could take 60–90 days minimum — and up to six months under adverse conditions. Tanker spot rates remain approximately 3x their pre-war levels. Saudi Arabia, the UAE, and other Gulf producers that rerouted cargoes during the crisis are now managing inventory imbalances. WTI at $96.57 represents a 32% premium over January's $73/barrel level, suggesting the market is pricing an approximate $20–25 'risk premium' on top of fundamentals.
Market Implication: The structural floor for oil in the near term is likely $80–85, even in a best-case diplomatic scenario, owing to the months-long supply normalization process. Energy sector earnings (XLE, XOM, CVX) for Q1 will be exceptional due to the oil price spike. Refining margins are particularly elevated. Airlines, trucking, and consumer discretionary remain the sectors most structurally exposed to sticky energy costs.
STORY 6: Wall Street's 'Innovation Supercycle' — Goldman and JPMorgan Pivot to M&A
With NII plateauing as the rate cycle approaches a holding pattern, Goldman Sachs and JPMorgan Chase are betting their Q1 2026 narratives — and their investor days in May — on what internal strategists are calling the 'Innovation Supercycle': a multi-year wave of M&A, IPOs, and debt issuance driven by artificial intelligence infrastructure investment, energy transition financing, and defense-sector consolidation.
JPMorgan's investment banking division has reportedly accumulated the strongest deal pipeline in six years, with over $340 billion in live M&A mandates as of late March. Goldman dominates the tech and AI subsectors, advising on three of the five largest AI infrastructure deals announced in Q1. The 'debt tsunami' — corporations refinancing pandemic-era low-rate debt at current market rates — provides a durable, multi-year fee engine that doesn't depend on new deal activity.
Market Implication: If the big banks deliver on fee revenue expectations this week, it will validate a rotation out of rate-sensitive bank stocks and into capital-markets-heavy franchises. Watch GS, MS, and BlackRock's fee-based AUM metrics as the new scorecards for 2026 bank performance.
4. MACRO & FED WATCH
Fed Funds Rate: 3.50–3.75% (effective rate: 3.64%). No change expected April 28–29 FOMC.
The March FOMC minutes released Wednesday delivered the clearest signal yet that the Federal Reserve has shifted from a 'cutting bias' to a 'watch and wait' posture — and in the most hawkish scenario, a 'consider hiking' posture. The key phrase that rattled bond traders: a 'vast majority' of officials said bringing inflation down could be 'slower than previously anticipated,' while noting heightened risks that inflation runs 'persistently above' 2%.
The March projections penciled in one cut for 2026 and one for 2027. Both are in serious doubt. PCE and Core PCE inflation are now expected at 2.7% for the full year — well above target. The critical variable is whether the March CPI spike (driven by gasoline and fuel oil) is sustained or reverses as Middle East tensions ease. If Islamabad produces a credible peace framework and oil falls toward $80–85, the 'transitory' argument reasserts itself and the single 2026 cut becomes possible by Q4. If talks collapse and oil spikes, the Fed may be forced into hawkish signaling as early as May.
Yield Curve: The 10Y–2Y spread stands at +50 basis points (10Y: 4.31%, 2Y: 3.81%) — a normalization from the inverted curve that persisted through most of 2023–2024. The 30Y at 4.91% reflects persistent deficit concerns and term premium rebuilding. A steepening trade — long the 2Y, short the 30Y — is the dominant fixed income positioning among macro hedge funds heading into next week.
5. ECONOMIC CALENDAR — THIS WEEK
Date
Time (ET)
Indicator
Prior
Why It Matters
Apr 11
—
No major U.S. economic releases (Saturday)
—
Markets closed; peace talks in Islamabad ongoing
Apr 13
10:00 AM
Existing Home Sales (March)
4.26M
Housing demand signal; rate sensitivity barometer
Apr 14
8:30 AM
Producer Price Index (March, Final Demand)
+3.4% YoY
Pipeline inflation early warning; energy pass-through
Apr 14
8:30 AM
PPI ex-Food & Energy (Core PPI, March)
+3.1% YoY
Fed watches core PPI to gauge non-energy pressures
Apr 15
8:30 AM
Retail Sales (March) — Advance Est.
+0.2% MoM
Consumer spending health under energy shock
Apr 15
8:30 AM
Empire State Manufacturing Index (April)
-8.1
NY regional factory activity; early April read
Apr 15
10:00 AM
NAHB Housing Market Index (April)
39
Builder confidence; forward indicator for housing
Apr 16
8:30 AM
Housing Starts & Building Permits (March)
1.36M
Supply side of housing; construction activity
Apr 16
8:30 AM
Philadelphia Fed Manufacturing (April)
-12.5
Mid-Atlantic factory activity; national proxy
Apr 16
10:00 AM
University of Michigan Consumer Sentiment (Prelim)
52.2
Inflation expectations component; Fed-critical
6. EARNINGS WATCH
Goldman Sachs (GS) — Monday, April 13 Pre-Market
Consensus: EPS of $16.86 | Revenue ~$17.4B. Last quarter (Q4 2025): GS beat on IB fees and FICC trading. Analysts are most focused on M&A advisory revenue — Goldman holds the #1 global ranking and is projected to report a 33–41% jump in advisory fees. The options market is pricing an approximately ±4.5% move on earnings. Management commentary on deal pipeline outlook, credit quality in energy-exposed loan books, and the macro outlook for M&A activity post-ceasefire will dominate the call. Goldman's Q1 will set the tone for the entire bank reporting season.
JPMorgan Chase (JPM) — Tuesday, April 14 Pre-Market
Consensus: EPS of $5.44 (+7% YoY) | Revenue ~$44B. IB fees expected up 18% YoY driven by debt capital markets dominance as companies rush to refinance. Key watch items: loan loss provisions (any material increase in energy sector or consumer credit losses would be a red flag), NII guidance for the remainder of 2026, and CEO Jamie Dimon's macro commentary — his quarterly letter is read globally as a market-moving document. Options imply ±3.8% move.
Citi's turnaround story under CEO Jane Fraser enters a critical quarter: analyst focus is on international consumer banking margins and whether the 'Transformation' cost discipline is holding. WFC is the most interest-rate-sensitive major bank and thus the most exposed to the current 'rate plateau' environment — NII guidance will be closely watched. Both report pre-market Tuesday alongside BlackRock and Johnson & Johnson. S&P 500 earnings growth for Q1 is estimated at 13.2%, which would mark the sixth consecutive quarter of double-digit growth.
7. SECTOR SPOTLIGHT
Energy (XLE): Recalibrating a 6-Month Shock
The energy sector remains the epicenter of every macro conversation in 2026. XLE surged approximately 35% from January through mid-March as oil moved from $73 to $119/barrel, then gave back roughly 12% on the ceasefire rally. The sector is now in a bifurcated state: integrated majors (ExxonMobil, Chevron) with diversified global production are benefiting from elevated realized prices while maintaining downstream refining margins that remain historically wide. Meanwhile, mid-cap exploration companies with Persian Gulf exposure are seeing risk discounts on their reserve valuations.
Financials (XLF): The 'Fee Machine' Rotation
The financial sector's thesis has fundamentally shifted. As NII peaks and the rate plateau removes the traditional rate-spread earnings driver, the market is rewarding banks with strong capital-markets franchises over traditional commercial lenders. Goldman Sachs, Morgan Stanley, and BlackRock — the capital markets and asset management heavyweights — are trading at premium multiples relative to regional and commercial-heavy peers. The M&A revival and the 'debt tsunami' create a multi-year visibility into fee revenue that more than compensates for NII moderation. Watch the XLF vs. KRE (Regional Banks) divergence widening as a key sector signal this week.
The most-watched earnings report of the week. GS's stock has surged ~28% YTD, pricing in a significant fee-revenue acceleration. The options market implies a ±4.5% move. The key level to watch on a beat is $560 (resistance from early March highs); on a miss, $515 (200-day moving average). CEO David Solomon's commentary on the Islamabad talks' impact on deal certainty will be closely scrutinized — many live M&A mandates are contingent on geopolitical stabilization.
ExxonMobil (XOM) — ~$118 | Catalyst: Oil Price Direction
XOM is the clearest proxy for the Islamabad trade. If talks produce a credible framework, oil falls and XOM retraces toward $108–110. If talks collapse and oil spikes back toward $105+, XOM could test $130+. The stock is sitting precisely at the $118 level where the ceasefire rally stalled, making it a binary setup today. Q1 earnings (late April) are expected to show record upstream revenue. Refining margins remain wide — downstream will surprise to the upside regardless of the diplomatic outcome.
Netflix (NFLX) — ~$960 | Catalyst: Goldman Upgrade to Buy
Goldman upgraded NFLX to Buy (PT: $1,200 - see correction: earlier data listed $120 but consensus PT is ~$1,200 post-split adjusted) on April 6, citing ad-tier subscriber momentum and a live sports rights catalyst. NFLX has been a relative safe haven during the geopolitical volatility — consumers binge more content during uncertain times. The stock reports April 22; this week's Goldman upgrade refresh could attract momentum buyers testing the $1,000 psychological level.
Alcoa (AA) — ~$68 | Catalyst: Morgan Stanley Upgrade
Morgan Stanley upgraded AA to Overweight with a $80 PT, citing tightening aluminum supply conditions and accelerating green energy demand. Copper's 2.11% Friday surge — a global growth and energy transition proxy — validates the broader base metals thesis. If the Iran ceasefire holds, the reopening of shipping lanes reduces the geopolitical cost premium on aluminum inputs, and AA becomes a dual-play on both peace dividend and electrification demand.
10. GLOBAL MACRO SNAPSHOT
China: The People's Bank of China has been notably active this month, injecting liquidity and guiding short-term rates lower in a targeted effort to offset the deflationary drag from slowing exports and real estate sector weakness. The Shanghai Composite approaching 4,000 reflects policy optimism more than fundamental improvement — exports have been hurt by both the Iran conflict (shipping disruption) and ongoing trade friction with the U.S. Copper's Friday surge suggests the market may be front-running a stimulus announcement that Beijing has been telegraphing. Watch for the April PBOC reserve requirement ratio (RRR) cut decision due this month.
Europe: The European energy crisis embedded within the Iran war is arguably worse than the U.S. experience, given Europe's greater reliance on LNG imports and proximity to Middle East supply chains. The ceasefire relief has been pronounced in European equity markets: the DAX surged 5.06% on April 8 (its best day since March 2022). The ECB faces a mirror-image dilemma to the Fed — elevated energy-driven inflation preventing cuts even as underlying growth weakens. ECB's April meeting is April 17.
Emerging Markets: Pakistan's mediation role has elevated its geopolitical standing and its equity market has surged ~8% this week. India — the world's third-largest oil importer — stands to benefit dramatically from any durable peace deal lowering crude. The Sensex has outperformed Asian peers YTD on expectations of continued foreign investment inflows. Gulf sovereign wealth funds (Saudi PIF, ADIA, QIA) are actively deploying capital into U.S. and European assets as their petrodollar surpluses reach multi-year highs.
11. WEEK AHEAD PREVIEW
Monday, April 13: Goldman Sachs pre-market earnings; Existing Home Sales (10am). Islamabad peace talks day 2. The market's direction for the week will be set early.
Tuesday, April 14: The most data-heavy day of the week. JPMorgan, Citigroup, Wells Fargo, BlackRock, and Johnson & Johnson all report pre-market. PPI data at 8:30am. A 'banker's Monday' on steroids — a broad read on the U.S. economy and corporate health will crystallize.
Wednesday, April 15: Bank of America and Morgan Stanley pre-market. Retail Sales and Empire State Manufacturing at 8:30am — the first April activity data. NAHB Housing Index at 10am.
Thursday, April 16: Housing Starts and Philly Fed Manufacturing at 8:30am. UMich Consumer Sentiment prelim (April) at 10am — inflation expectations component will be the single most market-moving number of the day given CPI context.
Friday, April 17 (Good Friday — US Bond Markets Closed): U.S. equity markets may trade on abbreviated liquidity. Any final communique from the Islamabad peace talks would likely come this week — the two-week ceasefire clock has 11 days remaining.
The Big Picture: This is potentially the most consequential single week for markets in 2026. Bank earnings, CPI follow-through (PPI), Iran peace talks, and retail data land simultaneously. The S&P 500's year-to-date performance hangs in the balance — a successful diplomatic week plus strong bank beats could propel the index to new all-time highs; a diplomatic failure or weak IB revenue could trigger a sharp reversal.
12. CLOSING THOUGHT
The market risk that no one is adequately pricing is not a breakdown of the Islamabad talks — that scenario is well-modeled by oil desks. The deeper risk is the scenario where the ceasefire holds, a partial peace framework is announced, and oil falls to $82–85... and inflation still doesn't cooperate. Core CPI at 2.6% is not an emergency, but it's also not 2%. If energy relief removes the headline spike but core inflation proves sticky — driven by housing, services, and wages in a still-tight labor market — then the Fed faces a scenario where rate cuts remain off the table well into 2027, not for geopolitical reasons, but for fundamental ones.
In that world, the equity market's implicit bet — that peace in the Middle East equals a green light for the Fed to cut, which sustains elevated valuations — would prove wrong. The S&P 500 trades at roughly 22x forward earnings with the 10-year at 4.31%. A world where the 10Y stays north of 4.25% for the next 12 months, with no cut in sight, is a world where that multiple compresses. Diplomacy is today's catalyst. But fundamentals will be next month's reckoning.
Watch the 10-year, not the oil price. The oil price tells you what happened in Islamabad. The 10-year tells you what happens next.
Data sourced from: BLS (CPI), Federal Reserve, EIA, CNBC Markets, Trading Economics, FinancialContent, Benzinga Analyst Ratings, Quiver Quantitative. This brief is for informational purposes only and does not constitute investment advice.
1. THE MORNING SETUP
Markets enter the new trading week with one foot on the gas and one eye on the Middle East. The S&P 500 closed out a remarkable seven-day winning streak Friday -- its best weekly run since November -- as a fragile U.S.-Iran ceasefire brought oil prices crashing down from multi-year highs and reignited risk appetite across asset classes. Yet the relief may prove temporary: the Strait of Hormuz remains only partially reopened, oil still trades nearly 35% above pre-conflict levels, and a hot March CPI print (+3.3% YoY, +0.9% MoM) released Friday morning served as a sobering reminder that the inflation fight is far from over. The Dow surrendered 269 points on Friday alone as euphoria faded, leaving investors to reckon with a complex tableau: a Fed locked in 'wait and see' mode ahead of its April 28-29 meeting, a Q1 earnings season that kicks off in earnest this week with the major banks, and geopolitical risk that remains one diplomatic miscalculation away from rekindling. All eyes this morning turn to Goldman Sachs, JPMorgan, Wells Fargo, and Citigroup -- who collectively hold the power to either validate or complicate the market's fragile optimism.
2. MARKETS AT A GLANCE
All data as of Friday, April 11, 2026 close. *Approximate estimate for Sunday reference.
U.S. Equities
INDEX
LAST
1-DAY
WEEK
YTD
S&P 500
5,282
-0.31%
+3.1%
-1.0%
Nasdaq 100
18,421
-0.22%
+4.2%
-3.8%
Dow Jones
47,917
-0.56%
+2.9%
+0.2%
Russell 2000
2,048
-0.44%
+2.7%
-6.2%
VIX (Fear Gauge)
22.4
+1.8%
-18.4%
+34%
Asia-Pacific Closes (Friday)
INDEX
LEVEL
1-DAY CHG
WEEK CHG
Nikkei 225 (Japan)
36,581
-0.4%
+2.1%
Hang Seng (Hong Kong)
21,943
+0.6%
+1.8%
Shanghai Composite (China)
3,312
+0.3%
+0.9%
Kospi (South Korea)
2,489
-0.2%
+1.4%
ASX 200 (Australia)
7,721
+0.5%
+1.6%
Europe (Friday Close)
INDEX
LEVEL
1-DAY CHG
WEEK CHG
FTSE 100 (UK)
8,492
-0.3%
+1.9%
DAX (Germany)
21,834
-0.5%
+2.4%
CAC 40 (France)
7,618
-0.4%
+2.1%
Euro Stoxx 50
5,021
-0.4%
+2.2%
Fixed Income & FX
INSTRUMENT
LEVEL
CHG
DIRECTION
NOTE
US 2Y Treasury
3.81%
-2 bps
Falling
Rate cuts remain priced in
US 5Y Treasury
4.08%
+1 bp
Steady
US 10Y Treasury
4.31%
+3 bps
Rising
Curve un-inverted; inflation premium
US 30Y Treasury
4.58%
+4 bps
Rising
Long end pricing sticky inflation
DXY (US Dollar Index)
98.9
-0.2%
Weak
Below 99 key support level
EUR/USD
1.0921
+0.1%
USD weak
ECB rate cut path clearer than Fed
GBP/USD
1.3045
+0.2%
Firming
UK inflation resilient
USD/JPY
148.3
-0.3%
Yen gaining
Safe-haven flows; BOJ normalization
USD/CNY
7.241
+0.1%
Stable
PBOC anchoring near 7.24
Commodities & Crypto
ASSET
PRICE
1-DAY CHG
YTD CHG
WTI Crude Oil
$95.50 / bbl
-1.3%
+37%
Brent Crude
$96.10 / bbl
-0.8%
+35%
Natural Gas (Henry Hub)
$4.21 / MMBtu
+0.5%
+22%
Gold (Spot)
$4,712 / oz
+0.4%
+28%
Silver (Spot)
$34.80 / oz
+0.6%
+18%
Copper (LME)
$4.62 / lb
+0.3%
+9%
Bitcoin (BTC)
$72,140
+0.5%
-8.4%
Ethereum (ETH)
$2,198
+0.3%
-22%
3. TOP STORIES
The Ceasefire That Isn't Quite a Ceasefire
Iran and the United States agreed to a two-week ceasefire last week -- but markets ended the week with a distinctly cautious tone after Iran reportedly re-closed the Strait of Hormuz within 24 hours of agreeing to safe passage, citing Israel's continued operations in Lebanon as a violation of the truce's terms. The situation remains extraordinarily fluid. The ceasefire, brokered by Pakistan with help from Qatar, had sent oil prices plunging more than 16% on a single day -- WTI dropped from above $112/barrel to around $94, the largest one-day decline since 2020 -- and ignited a multi-day stock market rally. The Dow posted its best single session in over a year.
The deeper problem is structural: even if the Strait reopens fully, energy markets have been permanently repriced by the crisis. Global inventories were drawn down aggressively during the blockade, and governments from Europe to Japan are actively rebuilding strategic reserves. JPMorgan's commodity desk has flagged that the oil risk premium may not fully unwind unless a lasting diplomatic framework emerges -- a prospect that feels distant given the involvement of multiple actors (Iran, the U.S., Israel, Hezbollah proxies, and regional Arab states). For markets, the calculus is: a ceasefire is priced in, but a re-escalation is not. That asymmetry makes energy-exposed names and broader risk assets vulnerable to event-driven dislocations.
What to Watch: Saturday's talks in Pakistan between U.S. and Iranian delegations. If a second-phase agreement is announced, expect a leg lower in oil and a rally in risk assets. If talks collapse, the Strait risk premium returns with force -- and so does the inflation fear trade.
March CPI: The Inflation Genie Is Not Back in the Bottle
Friday's Consumer Price Index report for March delivered an uncomfortable reminder that the Federal Reserve's job remains unfinished. Headline CPI rose 0.9% month-over-month -- the largest monthly gain since June 2022 -- driven almost entirely by a 21.2% surge in gasoline prices as the Iran conflict roiled energy markets. On a year-over-year basis, CPI rose to 3.3%, a sharp jump from February's 2.4% reading. Core CPI, which strips out food and energy, rose a more contained 2.6% annually -- but that figure will offer little comfort to Fed officials who understand that energy price shocks have a nasty habit of embedding themselves in broader inflation expectations over a 3-6 month lag.
The timing is particularly fraught. The Fed was already navigating a narrow corridor: growth softening, inflation sticky, and the geopolitical wildcard of Middle East energy disruption. Now, with March CPI re-accelerating sharply, the probability of any rate cut before year-end has dimmed considerably. Prediction markets are now pricing a roughly 40% chance the Fed makes zero cuts in 2026 -- up from under 20% before the Iran conflict began. Wells Fargo formally withdrew its forecast for any 2026 cuts this week, while Bank of America holds firm on two cuts, and Goldman Sachs has pushed its first cut to September at the earliest.
What to Watch: Tuesday's PPI release for March will give the next data point. Analysts expect wholesale inflation also jumped sharply. If PPI confirms the energy-driven surge, it further narrows the Fed's path to cuts and could push the long end of the Treasury curve -- already creeping toward 4.5% -- even higher.
Bank Earnings Season: The Economy's Report Card Begins
The most consequential week of the Q1 2026 earnings season begins Monday, as Goldman Sachs, JPMorgan Chase, Wells Fargo, and Citigroup all report results against the backdrop of geopolitical tumult, elevated rates, and a consumer whose resilience is being tested by $4/gallon+ gasoline. Goldman Sachs is expected to lead the pack -- analysts project revenues of $16.9 billion, up 12% YoY, driven by a surge in equities trading and ECM activity, even as M&A remains subdued. EPS estimates range from $16.14 to $16.48. The firm's trading desks have been primary beneficiaries of volatility -- the Iran conflict generated massive flows across oil, gold, and rates derivatives.
JPMorgan (EPS est: $5.41, Revenue: $48.2B) is the market's bellwether. CEO Jamie Dimon's commentary will be parsed for signals on consumer credit health, commercial real estate stress, and loan growth trajectory. Analysts are watching how JPMorgan accounts for the recently acquired Apple Card portfolio and whether the bank books additional reserves against an economic slowdown. Wells Fargo (EPS: $1.58, Revenue: $21.79B) and Citigroup (EPS: $2.63, Revenue: $23.6B) complete the Monday-Tuesday sweep, with Bank of America (EPS: $1.01) reporting Wednesday. The Finance sector is collectively expected to post 19.6% earnings growth in Q1 -- the strongest of any S&P 500 sector.
What to Watch: Reserve builds or releases will signal how each management team views economic trajectory. Any commentary on corporate loan demand will be closely read as a proxy for business confidence amid the Iran-driven uncertainty.
Gold at $4,700: The Safe-Haven Premium Entrenches
Gold has surged over 28% year-to-date to a record high near $4,712/oz -- a move that reflects not just geopolitical fear but a broader re-assessment of the monetary order. The rally began in earnest as the Iran conflict escalated in mid-March, pushing energy prices to multi-year highs and re-igniting inflation fears globally. But the depth and persistence of gold's move suggests something more structural: central banks -- particularly those in emerging markets -- have been aggressively adding to reserves as de-dollarization themes accelerate. The People's Bank of China and several Middle Eastern sovereign wealth funds are reported to be among the most active buyers.
JPMorgan's commodity research team has set a year-end target of $5,000/oz, while more bullish projections circulating at hedge funds see a path to $6,000 if the Iran conflict broadens or if U.S. fiscal deterioration accelerates the dollar's structural decline. The DXY has slipped below 99, a psychologically important level, and real yields remain suppressed by geopolitical risk premium. Silver (+18% YTD) and copper (+9% YTD) are following gold's lead, with copper -- the quintessential global growth proxy -- holding up better than its risk-sensitive reputation might suggest, buoyed by structural demand from electrification and AI infrastructure investment.
What to Watch: Any definitive Hormuz reopening that brings oil sharply lower would test gold's bid at current levels. A drop below $4,500/oz would signal the geopolitical risk premium is unwinding rapidly.
Dollar Weakens as Safe-Haven Calculus Shifts
The U.S. dollar (DXY: 98.9) has entered a quiet but meaningful decline that deserves attention. Six months ago, the dollar index sat comfortably above 109; it is now below 99. The proximate cause: geopolitical safe-haven flows have split between gold, yen, and Swiss franc rather than flowing purely to the dollar; inflation data is complicating the Fed's narrative; and the ballooning U.S. fiscal deficit -- running at roughly $2.1 trillion annually -- is weighing on long-term confidence in dollar-denominated assets. The yen (USD/JPY: 148.3) has strengthened as Bank of Japan policy normalization continues, while the euro has benefited from upgraded ECB growth forecasts.
For equity markets, a weaker dollar is generally a tailwind for S&P 500 multinationals -- companies like Apple, Microsoft, and Alphabet generate 40-60% of revenues outside the U.S. and see an earnings boost when the dollar softens. But if dollar weakness accelerates into a disorderly decline, it could force the Fed's hand toward more hawkish action regardless of the economic data, undermining the equity support it currently provides.
S&P 500 Sector Rotation: Energy's Dominance vs. Tech's Potential
The year's most striking sector divergence continues: Energy stocks have surged over 30% year-to-date on oil price tailwinds from the Iran conflict, leading every other S&P 500 sector by a dramatic margin. Materials (+9.3%) and Utilities (+7.5%) round out the top performers. Meanwhile, Technology (-9.3% in Q1) and Consumer Discretionary have been the major laggards, with the former weighed down by export control fears, valuation compression from rising rates, and -- ironically -- the same geopolitical environment that is boosting the commodity-heavy end of the market. Friday's session was instructive: while the Dow fell 0.56% and Verizon, Salesforce, and Nike all declined 3%+, Nvidia rose 2.58% and Amazon gained 2.05% -- suggesting selective tech recovery may be underway.
4. MACRO & FED WATCH
The Federal Reserve is caught between two deeply uncomfortable realities as it approaches its April 28-29 FOMC meeting: inflation is re-accelerating due to an energy shock the Fed cannot control, and growth is showing signs of softening due to that same shock. It is a scenario policymakers have long dreaded -- a potential return of stagflationary dynamics not seen since the 1970s, though most economists are careful not to overstate the parallel.
Chair Jerome Powell's public posture has been deliberately non-committal. In recent remarks, he has emphasized the Fed's ability to be 'patient' and 'data-dependent' -- language that functions as a holding pattern while policymakers wait to see whether the energy spike is transitory (ceasefire holds, oil drops back toward $75-80) or persistent (conflict re-escalates, prices re-test $120+). The Fed's own March projections called for two rate cuts in 2026 -- but those projections were made before the Iran conflict exploded oil prices by 60%+ and before March CPI printed at 3.3%.
The yield curve has formally un-inverted, with the 2Y/10Y spread now at +50 basis points (2Y: 3.81%, 10Y: 4.31%). This is typically a positive signal for economic normalization -- but in the current context, the un-inversion is largely driven by the long end rising on inflation fears rather than the short end falling on rate cut expectations. The 30-year Treasury at 4.58% reflects a market pricing in a scenario where inflation remains sticky and the Fed cannot cut as aggressively as hoped. Fed funds futures are now pricing approximately 1.2 rate cuts for all of 2026, down from 2.5 cuts priced at the start of the year.
Key Fed Events This Week: No major scheduled Fed speakers Sunday. Watch throughout the week for any comments that signal whether Powell is leaning toward skipping the first cut entirely. The April 28-29 FOMC decision will be the next major policy catalyst. Rate futures currently price a near-100% probability of no change at that meeting.
5. ECONOMIC CALENDAR -- WEEK OF APRIL 13-17, 2026
DATE
TIME ET
INDICATOR
PRIOR
CONSENSUS
WHY IT MATTERS
Mon 4/14
8:30 AM
PPI Final Demand (March)
+0.7%
~+0.9% est.
First wholesale inflation read post-Iran shock; leads PCE forecast
Mon 4/14
Pre-Mkt
GS, JPM, WFC, C Earnings
Q4 2025
See Sec. 6
Largest single earnings event of Q1; sets risk tone for week
Tue 4/15
8:30 AM
Empire State Mfg. (April)
-14.1
-10.0 est.
First April regional survey; proxy for national ISM manufacturing
Tue 4/15
Pre-Mkt
Bank of America Earnings
Q4 2025
See Sec. 6
Consumer banking bellwether; duration risk and deposit trends key
Wed 4/16
8:30 AM
Housing Starts (March)
1.42M
1.38M est.
Housing affordability stressed by high mortgage rates; builder confidence declining
Wed 4/16
4:00 PM
Netflix Earnings (NFLX)
Q4 2025
See Sec. 6
Ad-supported tier and password-sharing impact in focus; 8% implied move
Thu 4/17
8:30 AM
Weekly Jobless Claims
221K
218K est.
Leading labor indicator; any uptick above 240K would shift Fed calculus
Thu 4/17
9:15 AM
Industrial Production (March)
+0.1%
-0.2% est.
Factory output; energy disruption may have depressed March production sharply
Fri 4/18
--
Good Friday (Mkt Closed)
--
--
US equity and bond markets closed; creates gap-open risk for Monday 4/21
6. EARNINGS WATCH
Q1 2026 earnings season launches this week with the major U.S. banks -- the traditional first act of any earnings season and historically its most market-sensitive. Analysts expect S&P 500 aggregate earnings growth of 8-10% YoY for Q1, though the range of outcomes is unusually wide given geopolitical disruption. The Finance sector leads with +19.6% expected growth. The week's lineup represents a comprehensive economic stress test across consumer banking, capital markets, investment banking, and streaming media.
Monday, April 14 -- Pre-Market
Goldman Sachs (GS) | EPS Est: $16.31 | Revenue Est: $16.9B | Implied Move: +/-4.2%
Goldman enters earnings week as the season's early standard-bearer. The firm's trading desks have been in overdrive -- the Iran conflict created historic volatility across oil futures, credit markets, and interest rate derivatives, all of which are Goldman's native habitat. The equities trading desk is expected to post one of its strongest quarters in recent memory, while investment banking fees remain constrained by M&A activity largely frozen amid geopolitical uncertainty. The key question: whether Goldman's pipeline of deals -- reportedly exceeding $400B in pending transactions -- begins to clear in Q2, or whether instability extends the freeze into H2.
JPMorgan Chase (JPM) | EPS Est: $5.41 | Revenue Est: $48.2B | Implied Move: +/-3.1%
The most watched print of the week. JPMorgan's Q1 will be dissected as a proxy for the entire U.S. economy. Key focal points: (1) net interest income trajectory as the yield curve steepens; (2) credit quality in the newly acquired Apple Card portfolio, adding $2.2B in reserve-building risk; (3) commercial real estate exposure in a market still digesting the office vacancy crisis; and (4) Jamie Dimon's economic outlook commentary, which carries outsized market weight. Any miss would send shockwaves through the financial sector and the broader market.
Wells Fargo (WFC) | EPS Est: $1.58 | Revenue Est: $21.79B | Implied Move: +/-3.5%
Wells continues its multi-year rehabilitation under CEO Charlie Scharf. Key metric this quarter: whether net interest income is stabilizing as deposit repricing slows. Wells is more consumer-exposed than JPMorgan, making its results a cleaner read on Main Street financial health. Analysts will also watch the firm's noninterest expense trajectory and the Fed's ongoing asset cap -- still in place despite progress -- which limits balance sheet growth.
Citigroup (C) | EPS Est: $2.63 | Revenue Est: $23.6B | Implied Move: +/-3.8%
Citigroup is emerging from a years-long transformation under CEO Jane Fraser. The Q1 results will be tested against a backdrop of strong international operations (Citi has unique exposure to EM markets) and the continued simplification of the firm's business model. The 34% YoY EPS growth estimate makes it one of the most aggressive beats-or-miss scenarios of bank earnings week.
Tuesday, April 15 -- Pre-Market
Bank of America (BAC) | EPS Est: $1.01 | Revenue Est: $27.4B | Implied Move: +/-3.3%
Bank of America's Q1 will be most closely watched for its enormous duration risk -- the bank holds a massive portfolio of long-duration bonds accumulated during the low-rate era, which has generated unrealized losses in a rising rate environment. As rates at the long end have ticked back up on inflation concerns, investors will scrutinize whether those paper losses have widened and what it means for BofA's capital position. The bank's consumer division, with 67 million+ clients, will offer a real-time read on U.S. household financial health -- spending patterns, delinquency trends, and savings behavior in an era of $4+ gas prices.
Thursday, April 16 -- After Close
Netflix (NFLX) | EPS Est: $0.76 | Revenue Est: $12.16B (+15.3% YoY) | Implied Move: +/-7.8%
Netflix's first-quarter report is the week's tech-sector centerpiece. The company has guided for strong full-year revenue growth, and analysts are focused on three pivots: (1) advertising-supported tier monetization -- ad revenue more than doubled in 2025 and management has guided for another significant increase in 2026; (2) subscriber growth confirmation above the 325M paid membership mark; and (3) the impact of recently implemented price increases on churn rates in price-sensitive markets. Goldman Sachs upgraded the stock to Buy ahead of earnings with a $120 price target, implying roughly 20% upside. Options imply a near-8% move; bullish flow is modestly dominant heading into the print.
7. SECTOR SPOTLIGHT
Energy: The Year's Undisputed Leader -- But Cracks Are Forming
The Energy sector has been 2026's defining market story -- up over 30% year-to-date, lapping every other sector by a wide margin. Oil majors like ExxonMobil, Chevron, and ConocoPhillips have posted extraordinary returns as WTI crude surged from roughly $70/barrel pre-conflict to a peak above $120 before the ceasefire brought partial relief. But the easy money may be running out. The ceasefire, however fragile, already erased 16% of the oil price gain in a single session. If a lasting diplomatic resolution emerges, the sector's risk premium could unwind violently. Traders are beginning to position for this reversion: energy sector implied volatility has spiked, and short interest in crude oil ETFs has risen sharply. Morgan Stanley's downgrade of ExxonMobil this week to Equal Weight signals the street is beginning to rotate out. Watch for a potential energy-to-financials sector rotation if bank earnings disappoint the bears.
Financials: The Pivot Point Sector
Financials lagged in Q1 -- down alongside tech and consumer discretionary as rate uncertainty, credit concerns, and geopolitical risk weighed on sentiment. But the sector stands at an inflection point. If this week's bank earnings confirm that net interest income is stabilizing, credit quality remains manageable, and capital markets activity is recovering, Financials could rotate from laggard to leader in Q2. The sector currently trades at approximately 12.5x forward earnings -- a meaningful discount to the S&P 500's 19x multiple -- suggesting genuine value if the macro backdrop stabilizes. The answer to whether that discount is justified or an opportunity will become clearer by Tuesday evening.
The week's most important single stock. JPMorgan reports Monday pre-market against a backdrop of a steepening yield curve (bullish for net interest income), volatile capital markets (bullish for trading), and geopolitical uncertainty (cautious for deal pipelines). The stock sits 8% below its 52-week high -- historically, shares rally 3-5% on strong earnings beats in favorable macro environments. The risk-reward is asymmetric: a strong print with bullish Dimon commentary could re-rate the entire financial sector. Key technical level: $230, which would represent a breakout above the 200-day moving average. Options are pricing a +/-3.1% move; historical average earnings move is +/-2.6%, with slight skew toward upside in recent options flow.
Exxon Mobil (XOM) -- $119.40
Exxon is caught between two gravitational forces: elevated oil prices (bullish) and a fading geopolitical risk premium (bearish). The stock is up 28% YTD but faces its first meaningful valuation test as the ceasefire introduces downside oil scenarios. Morgan Stanley's downgrade this week signals the street is beginning to rotate out of the easy energy trade. Watch for any update on XOM's Guyana production ramp, which is becoming the company's most important growth driver independent of the Middle East situation. Key risk: if WTI drops toward $80 on a lasting ceasefire, EPS estimates for 2026 fall approximately 18%, and the stock likely re-tests $105.
Netflix (NFLX) -- $604.20
The setup is compelling: Goldman upgrade, strong subscriber momentum, advertising business scaling faster than projected, and a stock that has lagged the streaming peer group year-to-date. The company's shift away from reporting subscriber numbers (starting Q1 2025) means investors are partly flying blind on the legacy growth metric -- but that pivot has forced a healthy re-focus on revenue per user and operating margin expansion. The $120 Goldman price target implies roughly 20% upside from current levels. Options imply a near-8% move; bullish flow is modestly dominant heading into the print.
Nvidia (NVDA) -- $863.50
Nvidia did not report last week, but it was Friday's biggest winner (+2.58%) even as the broader market sold off -- a reminder that the AI capex cycle is alive and supported. The stock remains the market's single best read on AI infrastructure demand, and earnings from major cloud providers (Microsoft, Amazon, Alphabet) in the weeks ahead will offer indirect validation. Key concern: AMD's JPMorgan downgrade on AI chip supply glut fears. If that narrative gains traction, it could briefly pressure NVDA even without company-specific negative news. Technical support sits at $840; a break below that would be meaningful and potentially signal a broader tech sector retest.
10. GLOBAL MACRO SNAPSHOT
China
Beijing continues to walk a delicate line between supporting growth and managing financial stability risks. Q1 GDP data (expected April 16) is forecast near 4.8% -- below the government's 5% target, which will likely prompt additional stimulus measures in the form of infrastructure spending and targeted credit easing. The PBOC has kept the yuan anchored near 7.24, resisting depreciation pressure despite a weaker U.S. dollar environment, signaling that currency stability remains a top policy priority. Chinese equities (Hang Seng: +1.8% WTD, Shanghai: +0.9% WTD) have outperformed U.S. tech meaningfully year-to-date, benefiting from domestic stimulus and the geopolitical repositioning -- some of Iran's oil is reportedly reaching Chinese refineries through alternative channels at discounted prices.
Europe
European equities finished the week with modest gains despite Friday softness, supported by better-than-expected German industrial production data and a more dovish ECB tone than expected. The Eurozone is navigating its own energy shock -- EU member states have been competing for LNG cargoes diverted from Middle East routes, and energy prices across the continent remain roughly 40% above pre-conflict levels. The ECB has guided for a rate cut in June, which markets are pricing at approximately 85% probability. The euro has firmed against the dollar (EUR/USD: 1.0921), partly reflecting relative confidence that the ECB's path to easing is clearer than the Fed's -- a meaningful divergence that could drive continued EUR/USD appreciation.
Emerging Markets & Rest of World
Pakistan's role as ceasefire broker has elevated its geopolitical profile but complicated its own economic situation, with capital flows somewhat erratic. India (Sensex near record highs) has been a relative outperformer in Asia -- less directly exposed to Hormuz disruption and benefiting from technology sector strength and robust domestic consumption. Brazil's real has weakened modestly as commodity prices retreat from peaks. Turkey continues to grapple with high inflation despite aggressive rate hikes. The broader EM story for 2026 remains a tale of commodity exporters (beneficiaries: Saudi Arabia, Iraq, UAE, Nigeria, Brazil) vs. commodity importers (stressed: India, Japan, South Korea, much of Southeast Asia) -- with the Iran conflict dramatically accentuating that divide.
11. WEEK AHEAD PREVIEW
Monday is the week's primary event risk: four major banks report simultaneously in the pre-market hours, PPI drops at 8:30 AM, and markets open having digested the weekend's diplomatic developments from Pakistan. The tone of bank CEOs -- particularly Dimon at JPMorgan -- will set the emotional backdrop for the rest of the week.
Tuesday brings Bank of America and the Empire State Manufacturing Survey, the first April read on factory activity. This data will be important given Iran-driven supply chain disruptions affecting manufacturing inputs from petrochemicals to plastics. Federal Reserve speakers may begin to characterize the PPI and CPI data publicly.
Wednesday features Netflix after the close -- the week's lone major tech print. Housing Starts for March will also be released, providing a read on residential construction activity amid elevated mortgage rates (currently near 7.1% for a 30-year fixed).
Thursday brings weekly jobless claims, arguably the most important real-time economic indicator in the current environment, followed by March Industrial Production. Any sign of labor market cracking -- claims rising materially above 230K -- would immediately shift the Fed narrative back toward cuts and could provide the equity market with an unexpected tailwind.
Friday, April 18 is Good Friday -- U.S. equity markets are closed. This creates gap-open risk for Monday, April 21 on any weekend geopolitical developments. Bond markets may see limited activity.
Looking further ahead: April 28-29 FOMC meeting (no rate change expected, but tone critical); Big Tech earnings from Microsoft (April 28), Meta (April 29), Amazon (April 30); Q1 GDP advance estimate (April 30); and the April jobs report (May 1) -- together forming the most consequential five-day stretch of the quarter.
12. CLOSING THOUGHT
The Risk the Market Is Underpricing: Stagflation Isn't Just a Tail Risk Anymore
There is a quiet assumption embedded in current market pricing that deserves scrutiny: that the Iran conflict is a temporary shock, the ceasefire will eventually hold, oil will normalize back toward $80, and the Fed will cut rates by September. Each of those assumptions might be individually reasonable -- but their conjunction feels fragile. What if the ceasefire collapses permanently? What if March CPI's 3.3% proves to be not a peak but a floor? What if the Fed is forced to hike rather than cut? The historical parallel worth considering is 1973-74: an oil shock originating from Middle East conflict, a central bank unwilling to fully accept the inflationary consequences, and an S&P 500 that ultimately fell 48% as stagflation took hold over 18 months. We are not there today -- the economy is stronger, the banking system more resilient, and the Fed's inflation-fighting credibility vastly higher than in the Volcker era. But the directional rhyme is real. Don't let one week's relief rally obscure the fact that the structural regime -- higher energy prices, stickier inflation, a constrained Fed -- has not changed. Trade accordingly.
-- End of Daily Financial Brief | April 12, 2026 --
Sources: BLS.gov, Federal Reserve, CNBC, Bloomberg, Yahoo Finance, NPR, Fox Business, AlphaStreet, TipRanks, Fortune, IndexBox, Intellectia.ai, 24/7 Wall St.
DAILY FINANCIAL BRIEF
Monday, April 13, 2026 | Published 9:30 AM ET
1. THE MORNING SETUP
The world woke up to a changed energy landscape. After 21 hours of marathon negotiations in Islamabad collapsed late Sunday without a deal, President Trump announced the U.S. Navy will blockade all maritime traffic entering and exiting Iranian ports, starting at 10 a.m. ET Monday. The decision — coming after Iran refused Washington's red lines on nuclear enrichment — has sent WTI crude surging above $104 and Brent past $102, their highest levels since the war began in late February. The Strait of Hormuz, through which roughly 20% of global oil supply flows, is now a flashpoint for what could become the most severe energy shock since 2022.
For markets, the calculus is ugly and simple: higher oil equals higher inflation, a more hawkish Fed, and squeezed corporate margins at the exact moment Q1 earnings season kicks off. S&P 500 futures are down nearly 0.5% heading into the open, Europe is broadly lower, and airline stocks are among the worst performers globally. Yet buried inside this grim setup is a critical counterpoint: Goldman Sachs delivered blowout Q1 results before the bell, with investment banking revenues up 48% and record equities trading — a reminder that even war has its winners on Wall Street. This week will define whether Q1 earnings can hold the market's floor against geopolitical gravity.
2. MARKETS AT A GLANCE
All data as of 9:30 AM ET, Monday April 13, 2026. Changes reflect 1-day performance unless noted.
INSTRUMENT
LEVEL
1D CHG
NOTE
US EQUITY FUTURES (Premarket, 9:30 AM ET)
S&P 500 Futures
6,823
▼ -0.47%
Iran blockade fears
Nasdaq 100 Futures
25,166
▼ -0.46%
Tech selling pressure
Dow Futures
~43,150
▼ -0.88%
-423 pts; energy drag
Russell 2000 Futures
~2,150
▼ -0.55%
Small-caps underperform
PRIOR CLOSE (Fri Apr 11 — S&P up ~3% on the week after ceasefire hope)
S&P 500
~6,855
▲ +0.7% wk
Rally on Iran ceasefire hopes
Nasdaq 100
~25,280
▲ +0.9% wk
Tech led recovery
VIX
19.49
→ Moderate
Elevated vs. 2025 avg ~15
EUROPE (April 13 Open — Markets react to talk collapse)
FTSE 100
~8,350
▼ -0.42%
Airlines, energy drag
DAX (Germany)
~21,800
▼ -0.94%
Exporters hit on energy costs
CAC 40 (France)
~7,950
▼ -1.02%
Worst European decliner
Euro Stoxx 600
~530
▼ -0.70%
Broad-based selling
US TREASURIES
2-Year Yield
3.81%
→ Flat
Markets price ~1 cut 2026
10-Year Yield
4.31%
▲ Rising
+50bps over 2Y; curve steepening
30-Year Yield
~4.65%
▲ Rising
Inflation premium expanding
CURRENCIES & CRYPTO
DXY (Dollar Index)
~105.2
▲ +0.3%
Flight-to-safety bid
EUR/USD
1.0780
▼ -0.3%
Euro pressure on energy costs
GBP/USD
1.2640
▼ -0.2%
UK inflation watch
USD/JPY
151.80
▲ +0.4%
Yen weakens on risk-off
Bitcoin (BTC)
~$87,500
▼ -1.2%
Risk-off dampens crypto
Ethereum (ETH)
~$3,900
▼ -1.5%
Following BTC lower
COMMODITIES
WTI Crude
$104.80
▲ +7.8%
Hormuz blockade shock
Brent Crude
$102.00
▲ +7.0%
Supply shock premium
Natural Gas
$2.70/MMBtu
▲ +2.0%
LNG rerouting premium
Gold
$4,723.63
▼ -0.59%
Real rates headwind
Silver
~$48.50
▼ -0.8%
Industrial demand cautious
Copper
$5.73/lb
▼ -0.5%
LME inventories 8-yr high
3. TOP STORIES
STORY 1: The Strait Gambit — U.S. Blockades Iranian Ports After Peace Talks Collapse
After 21 hours of negotiations in Islamabad facilitated by Pakistani mediators, U.S. Vice President JD Vance announced Sunday evening that Iran had refused to accept Washington's core demands: the complete cessation of uranium enrichment, dismantling of major enrichment facilities, and removal of Iran's stockpile of highly enriched uranium. Iran's Parliament Speaker Mohammad-Baqer Qalibaf accused the U.S. of "failing to gain the trust" of the Iranian delegation. The talks, which had briefly raised hopes after a two-week ceasefire brokered in late March, have now collapsed entirely.
The U.S. Central Command announced the blockade would begin at 10 a.m. ET Monday, targeting all maritime traffic into and out of Iranian ports — not merely the Strait of Hormuz but Iran's full maritime access. The strategic implications are staggering. Roughly 17-20 million barrels per day of oil normally transits through the Strait of Hormuz, serving the energy needs of Japan, South Korea, China, and India. WTI is now up more than 50% since the war began; Brent is up over 40% in the same period.
Market implication: Energy equities are the lone bright spot in early trading. Airlines, shipping companies, and petrochemical manufacturers face a significant margin squeeze. Watch for emergency OPEC+ communication and whether Gulf states — particularly Saudi Arabia and the UAE — can meaningfully reroute supply. The Fed's inflation calculus has just gotten significantly more complicated. What to watch next: Congressional reaction, emergency IEA strategic reserve releases, and any communication from Riyadh.
STORY 2: Goldman Sachs Blows Out Q1 Estimates — Banking Season Opens With a Bang
Goldman Sachs reported first-quarter 2026 results that exceeded analyst expectations by a substantial margin: revenues of $17.23 billion (up 14% year-over-year), net earnings of $5.63 billion, and diluted EPS of $17.55 — compared to the consensus estimate of approximately $14.50. Return on equity hit 19.8%, which management characterized as a validation of their years-long strategic transformation away from consumer banking and toward institutional markets.
The standout was the Global Banking & Markets division, which generated $12.74 billion in net revenues. Investment banking fees surged 48%, reflecting a recovery in M&A and equity issuance that began in Q4 2025 and accelerated as CEOs rushed to complete deals before potential tariff disruptions. Equities revenues hit a record, driven by volatility-related client activity. Asset & Wealth Management contributed $4.08 billion, with the firm returning a massive $6.38 billion to shareholders — $5 billion in buybacks and $1.38 billion in dividends.
Market implication: GS results set an optimistic tone for the broader financial sector, suggesting that capital markets activity — rather than traditional lending — is where the big money is right now. However, it also raises the bar for JPMorgan, Citigroup, and Wells Fargo reporting Tuesday. Will their investment banking numbers match Goldman's pace, or does this reflect a Goldman-specific franchise advantage? What to watch: NII guidance from JPM, which is the most sensitive bellwether for the rate environment.
STORY 3: CPI Shock Complicates the Fed's Path — 3.3% Inflation Hits Five-Quarter High
March's Consumer Price Index came in hotter than expected, rising 0.9% month-over-month — the largest monthly gain since June 2022 — pushing the annual rate to 3.3%, the highest reading since May 2024. The March FOMC minutes, released last Wednesday, showed Fed officials attributing "core goods price inflation" largely to the effects of higher tariffs. Several participants expressed concern that inflation could prove "more persistent" than the staff's base case, particularly given the compounding effects of tariff policy and now, sharply higher energy prices.
The Fed's own dot plot, as of March, still projects one rate cut in 2026. But with CPI printing above 3%, oil now threatening $105+, and TIPS-implied inflation expectations rising steadily since the Iran war began, that projection looks increasingly aspirational. Fed funds futures are now pricing approximately a 25% probability of any rate cut by year-end — sharply lower than the two-to-three cuts markets were pricing in January. In effect, the bond market has already tightened conditions considerably; the Fed just hasn't had to do the work.
Market implication: Every basis point of upside inflation surprise delays easing and pressures equity multiples. The 10-year yield at 4.31% with a 50 bps spread over the 2-year represents a meaningful shift from the inverted curve of 2024 — the curve has re-steepened, but for the wrong reasons. Watch the PPI print Tuesday morning (8:30 AM ET) for the first read on whether upstream oil prices have already flowed through to producer costs.
STORY 4: Oil Shock Anatomy — Which Sectors Win, Which Bleed
With WTI above $104 and Brent north of $102, markets are stress-testing an energy shock scenario that most sector models hadn't fully priced. The winners are straightforward: integrated majors (Exxon, Chevron, Shell), oilfield services (SLB, HAL), and energy infrastructure. Goldman Sachs reiterated its Buy rating on XOM with a $135 target, citing the Permian Basin's ability to partially offset Hormuz supply disruptions with domestic production.
The losers are more diffuse but arguably more impactful. Airlines face a brutal structural hit: jet fuel now comprises nearly 30% of total operating costs, and with most carriers having hedged only 40-50% of their Q2 exposure, the remainder will be marked to market at prevailing spot prices. United Airlines was downgraded to Neutral by Bank of America Monday morning. Cruise lines, trucking companies, and chemical manufacturers face analogous pressures. Perhaps most underappreciated: the second-order effect on consumer spending. Each $10 per barrel increase in oil roughly equates to $100-120 billion in additional annual U.S. fuel costs — a meaningful drag on the One Big Beautiful Bill Act's $127 billion estimated consumer stimulus.
Market implication: Energy sector weighting in the S&P 500 is likely to rise as the index reweights to reflect the new reality. Sector rotation is underway: money is moving from Consumer Discretionary and Industrials toward Energy and — somewhat paradoxically — into large-cap banks, where trading revenues benefit from volatility.
STORY 5: Tariff Pressure + Energy Shock = Stagflation Warning Flags
The confluence of sustained tariff-driven goods inflation and now an oil-supply shock is producing what several strategists are beginning to call a "stagflation fingerprint" — the toxic combination of rising prices and slowing growth that characterized the 1970s and early 1980s. While the current situation lacks the breadth of those episodes, the dynamics are concerning: CPI above 3%, Fed on hold, oil above $100, yield curve steepening, and corporate guidance likely to deteriorate.
The macro backdrop entering Q1 earnings season was already complicated by tariff uncertainty. The One Big Beautiful Bill, while providing a fiscal boost, also extended deficits at a moment when the Treasury market is demanding higher term premiums. The 30-year yield pushing toward 4.65% is a warning signal — bond vigilantes are reasserting themselves. The dollar (DXY ~105.2) is holding firm, but that itself creates a different set of pressures for multinational earnings via FX translation headwinds.
Market implication: Bulls need earnings to prove that corporate America is resilient enough to offset macro headwinds. The Q1 reporting season that kicks off this week is, in that context, genuinely consequential — not just for individual stocks, but for the market's entire valuation thesis. What to watch: Any downward revision to full-year EPS guidance from Q1 reporters.
STORY 6: Gold Pulls Back Despite Geopolitical Chaos — What the Dip Tells Us
Gold fell to $4,723.63 on Monday, down 0.59%, despite the Strait of Hormuz blockade dominating headlines. This counterintuitive move is deeply instructive. The metal, which had surged more than 70% over the past 18 months driven by central bank buying, inflation hedging, and safe-haven flows, is now running into a specific headwind: if the oil shock delays rate cuts (or triggers hikes), real yields rise — and real yields are gold's kryptonite. A 10-year real yield moving back above 2.0% would historically justify a meaningful correction in bullion.
Gold is also technically extended at these levels; State Street's monthly gold monitor notes the metal remains well above its 200-day moving average and most institutional valuation models. The Goldman Sachs year-end target of $4,900/oz and Bank of America's $5,000 forecast remain intact as directional calls, but the near-term path is murkier than it was two weeks ago. Notably, gold has underperformed oil by roughly 10-15 percentage points since the Iran conflict began — suggesting that markets see this as an energy shock first and a geopolitical/inflation shock second.
Market implication: Gold's dip may be a tactical entry point if the Iran situation escalates further, but it's also a signal that the market is recalibrating the Fed path higher. Watch TIPS breakevens: if 10-year inflation expectations move above 2.8%, gold likely rebounds sharply.
4. MACRO & FED WATCH
The Federal Reserve enters this week with its hands increasingly tied. The March FOMC minutes — released last Wednesday, April 9 — revealed a committee acutely aware of the competing risks: an economy still growing modestly, tariff-driven goods inflation persisting longer than expected, and an oil shock potentially adding another 30-50 basis points to headline CPI by mid-year. The minutes' most striking phrase, flagged by The Motley Fool as a possible harbinger: "the pace and timing at which [tariff] effects would fade had become more uncertain since the time of the January meeting."
The Fed's own dot plot (March) still pencils in one 25 bps cut for 2026 — most likely in Q4 — with one additional cut in 2027. But markets have moved sharply away from that view: Fed funds futures now price only approximately a 25% probability of any cut by year-end, down from nearly 80% probability in January. The effective tightening through higher long rates has done some of the Fed's work for it, but at the cost of financial conditions volatility.
The yield curve shape tells an important story. The 10-year/2-year spread has widened to approximately +50 bps — a bear steepening dynamic driven by the back end rising faster than the front. This is the bond market pricing in persistent inflation rather than growth optimism; historically, bear steepeners are associated with below-average equity returns over the following 12 months. No Fed speakers are currently scheduled for Monday. Governor Christopher Waller and President Austan Goolsbee are both expected to speak later this week, with markets watching for any acknowledgment of the oil shock's implications for the rate path.
5. ECONOMIC CALENDAR — WEEK OF APRIL 13
All times Eastern. Consensus estimates from Bloomberg/Reuters where available.
TIME (ET)
INDICATOR
PRIOR
EST.
WHY IT MATTERS
MONDAY, APRIL 13
10:00 AM
Existing Home Sales (Mar)
4.26M
4.15M
Housing activity gauge; tariff uncertainty may weigh on demand
TUESDAY, APRIL 14
8:30 AM
Producer Price Index (Mar)
+0.7% MoM
+0.5%
Upstream inflation signal; tariffs may push goods PPI higher
8:30 AM
PPI ex-Food & Energy (Core, Mar)
+0.3% MoM
+0.3%
Cleaner read on underlying wholesale price trends
WEDNESDAY, APRIL 15
8:30 AM
Retail Sales (Mar)
+0.2%
+0.5%
Consumer spending health; key input for GDP tracking estimates
9:15 AM
Industrial Production (Mar)
-0.1%
+0.2%
Manufacturing output; any oil-related production disruptions here
10:00 AM
NAHB Housing Market Index (Apr)
39
38
Builder sentiment; high rates and energy costs a headwind
THURSDAY, APRIL 17
8:30 AM
Initial Jobless Claims
223K
220K
Weekly labor pulse; resilience here keeps Fed on hold
8:30 AM
Housing Starts (Mar)
1.49M
1.47M
Construction activity; lumber and labor costs the x-factor
8:30 AM
Building Permits (Mar)
1.46M
1.44M
Forward-looking housing signal; watch for permit pullbacks
6. EARNINGS WATCH
Q1 2026 earnings season kicks off in earnest this week, with the financial sector taking center stage. Goldman Sachs already reported Monday pre-market with blowout results (see Top Stories), setting a high bar for the rest of the major banks.
Goldman Sachs (GS) — Already Reported
Actual EPS: $17.55 vs. consensus ~$14.50. Revenue: $17.23B (+14% YoY). Investment banking fees up 48%. Record equities revenues. ROE: 19.8%. Capital return: $6.38B. The print is a genuine beat on every major line, driven by IB deal revival and trading desk performance. GS shares were modestly lower in premarket on the broader geopolitical selloff — a sign that even excellent earnings can be overwhelmed by macro headwinds.
Tuesday, April 14 — The Big Day
JPMorgan Chase (JPM): Consensus EPS $5.41, revenue $48.2B (+6.4% YoY). Watch: Full-year NII guidance, IB fee growth, consumer credit quality in a higher-rate environment. JPM is the most important single earnings report of the quarter — its NII guidance effectively sets the tone for rate expectations across the banking sector.
Citigroup (C): Consensus EPS $2.63, revenue $23.6B (+9% YoY). Watch: Progress on Jane Fraser's transformation plan, international markets revenue, credit loss provisions. Citi trades at a discount to book — any evidence of accelerating transformation could re-rate the stock.
Wells Fargo (WFC): Consensus EPS $1.58, revenue $21.79B (+8% YoY). Watch: Mortgage origination trends (particularly sensitive to the rate environment), any update on the Federal Reserve's asset cap — removal has been a catalyst thesis for the stock.
BlackRock (BLK): Also reports Tuesday. Watch: AUM flows (particularly into fixed income ETFs), iShares market share, fee rate compression. BlackRock's results are a proxy for the health of the ETF industry.
Wednesday, April 15
Bank of America (BAC): Consensus EPS $1.01 (+12.2% YoY). Bank of America has the most rate-sensitive deposit franchise among large banks; rising long rates are a double-edged sword — beneficial for NII but potentially compressing unrealized bond portfolio values. Morgan Stanley (MS): Reporting alongside BAC; watch wealth management fee revenues, which have benefited from record assets under management.
Earnings Season Context: S&P 500 Q1 2026 earnings growth is currently estimated at approximately 8-10% YoY. The energy sector is expected to be the standout outperformer; Consumer Discretionary and Industrials face the most guidance risk given oil prices and tariff uncertainty. Options markets are implying roughly 3-4% moves around major bank earnings — elevated relative to historical norms, reflecting genuine macro uncertainty.
7. SECTOR SPOTLIGHT
Energy: The War Premium Reshapes the Sector Landscape
Energy is the undeniable sector of the moment. With WTI above $104, the Energy sector ETF (XLE) is one of the few bright spots in today's early trading, up approximately 2.5-3%. Integrated majors — Exxon Mobil, Chevron, ConocoPhillips — are posting gains, while oilfield services names like SLB and Halliburton are seeing increased interest as the market prices in sustained elevated activity in non-Hormuz basins (Permian, North Sea, Gulf of Mexico). The rotation into energy is structural, not speculative: institutional investors are increasing energy weightings as a natural hedge against the inflation shock embedded in $100+ oil.
Financials: A Tale of Two Franchises
The financial sector is splitting in real time between capital markets-heavy firms (Goldman, Morgan Stanley) and traditional banks (WFC, BAC). The Goldman blowout reinforces the thesis that deal-making and trading volatility are powerful revenue engines, even as traditional NII businesses face uncertainty. The key question this week: can JPMorgan's universal bank model — the best of both worlds — deliver results that justify its premium valuation? Any disappointment on NII guidance from Dimon & Co. would send rates-sensitive financials broadly lower.
8. ANALYST CALLS & UPGRADES/DOWNGRADES
Notable analyst actions from the past 24-48 hours:
Valuation reset; recovery in clear aligner demand expected
Morgan Stanley
LMND
Upgrade to OW
$42
Tesla partnership marks new distribution channel inflection
HSBC
LLY
Downgrade to Hold
$780
Obesity drug price compression; GLP-1 competition intensifying
Argus
DKNG
Downgrade to Hold
—
Rising state tax rates, customer acquisition costs unsustainable
Goldman Sachs
XOM
Buy reiterated
$135
Hormuz premium; Permian output a hedge against supply disruption
Bank of America
UAL
Downgrade to Neutral
$62
Jet fuel cost spike from $104 oil wipes out margin expansion
9. STOCKS TO WATCH
Exxon Mobil (XOM) — The Hormuz Beneficiary
With WTI above $104, XOM is the cleanest direct play on the oil shock. The company's Permian Basin operations — with production capacity of approximately 1.2 million barrels per day — position it as a potential beneficiary of any rerouting away from Hormuz-dependent supply chains. Goldman's Buy reiteration with a $135 target is timely. Key levels: $120 support, $135 Goldman target, $140 as a breakout level last touched in 2023. Options market is implying a 2-3% move this week. Watch for any guidance upgrade at Tuesday's analyst day.
JPMorgan Chase (JPM) — The Week's Most Important Earnings Report
JPM reports Tuesday at 7 AM ET. Consensus: EPS $5.41, revenue $48.2B. The key variable isn't the quarter itself but Jamie Dimon's full-year NII guidance and any commentary on the economic outlook. In Q4 2025, Dimon flagged tariff uncertainty as a risk; his updated view in the context of an oil shock and 3.3% CPI will move markets. Options imply roughly a 4% move. Key support: $210. Prior quarter beat was followed by a 3.5% single-day gain.
United Airlines (UAL) — The Canary in the Airline Coal Mine
Bank of America's downgrade to Neutral Monday morning reflects the brutal math of $104 oil for the airline sector. UAL has hedged approximately 45% of its Q2 fuel exposure — the unhedged portion is now marked at roughly $95/barrel above its planning assumptions. The company reports Q1 earnings next week; analysts will be hunting for any guidance withdrawal or material adverse commentary. Key support: $58 (200-day moving average). A break below opens path to $50.
iShares 20+ Year Treasury ETF (TLT) — The Rate Trade's Pulse
TLT is not a stock, but it may be the most important price in markets right now. With the 30-year yield pushing toward 4.65% and the oil shock adding to inflation expectations, TLT (which moves inversely to long rates) is under pressure. A break below the $88 level would signal a meaningful repricing of the long end and could trigger forced selling across rate-sensitive equity sectors (REITs, utilities, high-dividend stocks). Watch this one as a leading indicator for any broader equity de-rating.
10. GLOBAL MACRO SNAPSHOT
China finds itself in a paradoxical position: as a major buyer of Iranian oil (China had been importing roughly 1.5 million barrels per day at discounted prices via back-channels), the Hormuz blockade directly threatens one of Beijing's most important energy supply lines. Chinese state media was silent on the development overnight, but the USD/CNY is under pressure and Chinese energy companies are scrambling to identify alternative suppliers from Russia, Angola, and Brazil. The People's Bank of China may need to inject liquidity if energy import costs spike import inflation beyond manageable levels.
In Europe, the picture is straightforwardly grim. The Continent had just begun to stabilize its energy supply picture after the 2022-23 gas crisis; oil above $100 reignites inflation that the ECB has been fighting for three years. The euro fell 0.3% against the dollar Monday. European airlines — already thin-margin businesses — are among the worst performers, with Lufthansa down 3.9%, EasyJet off 3.8%, and Wizz Air declining 6.9% at the open. The ECB's next meeting is May 5; a hold is now the overwhelming base case.
In emerging markets, oil importers (India, Turkey, South Korea, Thailand) face significant current account deterioration. South Korea's Kospi, which has heavy representation in petrochemical and shipping sectors, is particularly vulnerable. India's fuel subsidies — already strained — may require emergency budget adjustments. The EM carry trade is under pressure as dollar strength and energy import costs squeeze current accounts simultaneously.
11. WEEK AHEAD PREVIEW
Monday, April 13: Goldman Sachs earnings (pre-market). Existing Home Sales at 10 AM ET. Watch for any emergency diplomatic communications on Iran.
Tuesday, April 14: The most important single day of the week. JPMorgan Chase, Citigroup, Wells Fargo, and BlackRock all report before the open. PPI for March at 8:30 AM ET — critically important given the oil price spike.
Wednesday, April 15: Bank of America and Morgan Stanley report before the open. Retail Sales and Industrial Production at 8:30 AM ET and 9:15 AM ET, respectively. NAHB Housing Market Index at 10 AM. Netflix (NFLX) reports after the close — the first major Tech name this earnings season.
Thursday, April 17: Initial Jobless Claims at 8:30 AM ET. Housing Starts and Building Permits also at 8:30 AM. Taiwan Semiconductor (TSM) reports — a critical bellwether for global semiconductor demand and AI capex.
Geopolitical wildcard: Any development in the U.S.-Iran situation — whether resumed talks, Iranian military response, or international diplomatic pressure — could instantaneously override all other market signals. Keep geopolitical monitoring active 24 hours. OPEC+ may call an emergency meeting to discuss supply implications; watch for any statement from Saudi Arabia.
12. CLOSING THOUGHT
Here's the risk the market may be underpricing: this isn't primarily an oil story. It's a monetary policy story. Every $10 increase in oil adds roughly 20-25 basis points to headline CPI on a lagged basis. The Fed is already dealing with tariff-driven inflation above 3%. If oil stays above $100 through Q2 — which the blockade makes plausible — the Fed cannot cut in 2026. It may even face pressure to hike. Bond markets are sniffing this out: the 10-year yield hasn't collapsed on geopolitical fear (the traditional flight-to-quality trade) because inflation expectations are overwhelming the safe-haven bid.
In 1973, the Arab oil embargo caught markets flatfooted because no one believed OPEC would actually pull the trigger. Today, the Strait of Hormuz blockade is Trump's equivalent gambit — a maximum-pressure move that markets had partially priced but never fully believed would materialize. They have to believe it now. The question isn't whether this damages the economy. It will. The question is whether the damage arrives slowly enough — through corporate guidance cuts in May, in consumer spending data in June — that the market can gradually adjust, or whether something breaks first. History suggests the former is more likely than the latter. But history also has a way of lying at precisely the wrong moment.
Trade what you see. Risk what you can afford to lose.
— Daily Financial Brief | Monday, April 13, 2026
THE DAILY FINANCIAL BRIEF
Tuesday, April 14, 2026 · 9:30 AM EST
Your premium markets intelligence — WSJ style
1. THE MORNING SETUP
Markets are breathing a cautious sigh of relief this Tuesday morning as oil prices slide sharply and risk appetite returns to global equities — all on the slimmest of threads: the possibility that Washington and Tehran might find their way back to the negotiating table. U.S. equity futures are pointing modestly higher, with the S&P 500 edging up 0.2% and the Nasdaq 100 outperforming, up 0.5%, as Brent crude falls nearly 3.5% and WTI plunges over 5%. The single most important dynamic playing out in financial markets right now is not inflation, not Fed policy, not even earnings — it is the US-Iran standoff and the fragile ceasefire that has defined global risk pricing for the past several weeks.
Against this backdrop, bank earnings season is delivering its opening salvo: JPMorgan posted its highest-ever quarterly trading revenue, Citigroup beat decisively, and Wells Fargo stumbled on net interest income. The PPI report for March came in dramatically cooler than expected — a direct challenge to the inflation hawks — while the dollar continues its losing streak, now seven sessions deep. For investors, today's session is a test of whether geopolitical optimism can outlast hard economic reality.
2. MARKETS AT A GLANCE
Data as of pre-market, Tuesday April 14, 2026. All levels approximate unless noted.
INSTRUMENT
LEVEL / PRICE
CHG / %
── US FUTURES ──
S&P 500 Futures (ES)
5,712 est.
+0.20%
Nasdaq 100 Futures (NQ)
QQQ $620.63
+0.51%
Dow Futures (YM)
~42,200 est.
+0.15%
Russell 2000 Futures
~1,980 est.
+0.10%
── ASIA CLOSE ──
Nikkei 225 (Japan)
57,877
+2.43%
Hang Seng (Hong Kong)
~22,180 est.
+0.88%
Shanghai Composite
~3,328 est.
+0.55%
CSI 300 (China)
4,701
+1.19%
── EUROPE OPEN ──
FTSE 100 (UK)
~8,640 est.
Flat
DAX (Germany)
~22,480 est.
+0.90%
CAC 40 (France)
~7,820 est.
+0.60%
Euro Stoxx 600
~540 est.
+0.60%
── VOLATILITY ──
VIX (Fear Gauge)
~22.4 est.
Declining
── US TREASURIES ──
2-Year Yield
~4.05%
Steady
5-Year Yield
~4.18%
Steady
10-Year Yield
4.31%
-7 bps wk.
30-Year Yield
~4.75%
Steady
── FX / DOLLAR ──
DXY (Dollar Index)
98.3
-7th consec. session
EUR/USD
~1.088 est.
EUR strength
GBP/USD
~1.295 est.
GBP strength
USD/JPY
~147.5 est.
JPY strength
── COMMODITIES ──
WTI Crude Oil
~$91.50/bbl est.
-5.62%
Brent Crude Oil
~$95.30/bbl est.
-3.48%
Natural Gas
~$3.42/MMBtu
Steady
Gold
$4,760/oz
+0.8%
Silver
~$32.40/oz est.
+1.2%
Copper
~$4.65/lb est.
+0.5%
── CRYPTO ──
Bitcoin (BTC)
$75,859
4-Week High
Ethereum (ETH)
~$3,840 est.
+8.42%
3. TOP STORIES
Story 1: The Iran-U.S. Standoff — A Market Defined by Diplomacy
The defining narrative of the past three weeks has been the escalating, de-escalating, and re-escalating tension between Washington and Tehran. After a fragile two-week ceasefire agreed in late March, the Islamabad peace talks collapsed over the weekend — 21 hours of negotiations ending with neither side moving off its core demands. The U.S. insisted on full nuclear weapons dismantlement; Iran demanded security guarantees it did not trust Washington to deliver. In response, the Pentagon began implementing a naval blockade of Iranian ports on Monday.
The market impact was swift and severe. WTI crude surged above $104 on Monday as the blockade went into effect, triggering a broad equity selloff that briefly wiped out several weeks of gains. The S&P 500 erased its Iran war losses in a single session Monday as Vice President JD Vance suggested a deal was still "within reach" — provided Tehran crosses Washington's red lines on nuclear enrichment. Today, WTI is collapsing again by more than 5% on renewed hopes that talks could resume.
The market implication is significant: oil is now the primary real-time geopolitical indicator. A $10 move in WTI in either direction represents the market pricing in or out a diplomatic breakthrough. The Strait of Hormuz, through which roughly one-fifth of global oil trade passes, remains the Achilles heel of the global energy system. Watch for any official statements from Tehran's foreign ministry or the U.S. State Department this week.
Story 2: Bank Earnings Deliver — But With Important Asterisks
Q1 2026 bank earnings season opened with a bang on Monday and Tuesday. JPMorgan Chase posted its highest-ever quarterly trading revenue: $11.6 billion, a stunning 20% year-over-year surge as market volatility driven by the Iran conflict generated outsized client flow and positioning profits. CEO Jamie Dimon was candid on the call about recession risks, AI disruption, and the dangers of over-reliance on private credit markets — a rare moment of CEOs speaking plainly about systemic risk.
Citigroup was the standout surprise: net income surged 42% year-over-year to $5.8 billion, with EPS of $3.06 crushing the $2.63 consensus estimate by a wide margin. The bank's ongoing turnaround under its restructuring program appears to be gaining real traction — a detail analysts had underpriced. Wells Fargo told a more complicated story: EPS of $1.60 narrowly beat the $1.59 estimate, but revenue of $21.45 billion fell $320 million short of expectations, and net interest income disappointed, sending shares down more than 6% in pre-market trading.
The sector context matters: the S&P 500 Financials sector has been pricing in earnings growth of roughly 12% for Q1 2026, driven largely by trading and investment banking fee normalization. Goldman Sachs, which reported Monday, is estimated to have pulled in roughly $16.9 billion in revenue — a 12% YoY jump — on surging equities trading. What to watch: Morgan Stanley reports Thursday. Any cracks in wealth management or advisory fees could reset sector expectations.
Story 3: PPI Surprise — Disinflation Signal or Statistical Noise?
The Bureau of Labor Statistics released the March Producer Price Index this morning, and the headline number was a genuine surprise to the downside. Final demand PPI rose just 0.5% month-over-month, compared to a Dow Jones consensus estimate of 1.1% — less than half of what Wall Street expected. More striking: core PPI, which strips out food and energy, rose only 0.1% against a 0.5% consensus. This is the kind of reading that, in a geopolitically normal environment, would immediately revive rate-cut expectations.
But the annual picture is more complicated. On a year-over-year basis, PPI surged 4.0% — the fastest 12-month pace since February 2023, and largely attributable to a 15.7% spike in gasoline prices and an 8.5% rise in energy goods broadly. This is classic "conflict inflation" — not driven by domestic demand or wage pressures, but by commodity disruption from the Middle East standoff. The Fed is acutely aware of the distinction.
The market implication: if the Iran situation de-escalates and energy prices normalize, the underlying disinflation trend visible in core PPI could give the Fed the cover it needs to cut once in late 2026 as its projections suggest. For bond markets, the 10-year yield at 4.31% is already down from its recent 4.38% peak — today's soft core number could pull it further.
Story 4: Dollar Under Sustained Pressure — Seven Sessions of Losses
The U.S. Dollar Index (DXY) has now fallen for seven consecutive sessions, touching its lowest level since late February — before the Iran conflict began — at roughly 98.3. The decline has been driven by a confluence of forces: market optimism about eventual Iran diplomacy reducing safe-haven demand, the prospect of a single Fed rate cut later this year, and a rotation toward risk assets in both equities and crypto.
The dollar's weakness has meaningful cross-asset implications. A softer DXY is typically bullish for gold, commodities priced in dollars, and emerging market assets. Gold is trading near $4,760 per ounce — still below its conflict-era peaks but sharply rebounding. The euro and pound are gaining ground. Perhaps most notable is the signal: institutional positioning on the dollar has reached 14-year record bear levels, suggesting that the market's consensus view is that dollar dominance may be structurally eroding.
For equity investors, dollar weakness is a tailwind for U.S. multinationals reporting in the weeks ahead. Companies with significant overseas revenue — technology giants, industrials, consumer staples multinationals — will see favorable translation effects in their Q1 reports.
Story 5: China's Export Machine Hits a Headwind
China's March trade data, released alongside the Asian market session, showed export growth losing momentum as manufacturers face rising commodity and energy costs linked to Middle East supply disruptions. While imports posted their fastest expansion in more than four years — a bullish signal for domestic demand — the export picture suggests that China's manufacturers are absorbing higher input costs that are increasingly difficult to pass through to customers.
The CSI 300 rose 1.19% and the Nikkei surged 2.43%, both aided by Iran optimism and a weaker dollar rather than the Chinese trade data itself. Beijing's policy response — if any — will be the variable to watch. Any stimulus announcement or yuan depreciation move could shift the emerging market narrative quickly.
Story 6: Bitcoin Hits 4-Week High on Peace Hopes and Dollar Weakness
Bitcoin touched $75,859 on Tuesday, its highest level in four weeks, as the crypto market rallied alongside equities on Iran deal optimism. Trading volume surged 88% to $58.97 billion — a sign of genuine institutional participation, not just retail enthusiasm. Ethereum added 8.42%, outperforming Bitcoin on a percentage basis and signaling that risk appetite has broadened beyond the flagship asset. XRP gained 2.96%.
The correlation between crypto and geopolitics has never been cleaner: the April 7 ceasefire trade showed how quickly Bitcoin repriced when conflict risk faded. The same dynamic is playing out today. Analysts note that the combination of a weaker dollar, falling oil prices, and geopolitical de-escalation creates a near-perfect environment for crypto to run. Watch the $80,000 level as the next key psychological resistance on BTC.
4. MACRO & FED WATCH
The Federal Reserve remains on hold, and with good reason. At its March 17-18 meeting, the FOMC voted 11-1 to maintain the federal funds rate at the 3.5%–3.75% target range — a second consecutive hold as policymakers navigate a dual-threat environment of still-elevated inflation and an economy facing headwinds from geopolitical disruption. Governor Stephen Miran was the lone dissenter, voting for a quarter-point cut.
The inflation picture remains murky but improving on the margin. PCE inflation stands at approximately 3.3% year-over-year, with core PCE at 2.7% — both above the Fed's 2% target. However, today's soft core PPI reading (+0.1% MoM) suggests that the pipeline of goods price inflation is weakening, which typically feeds into PCE with a 2-3 month lag. If the Iran situation resolves and energy prices normalize, the Fed could find itself looking at meaningfully lower inflation numbers by summer.
Rate expectations are anchored firmly. Fed funds futures are pricing a 97%+ probability that the April 28 FOMC meeting results in no change. The first real chance of a cut is being priced for September 2026, with futures implying roughly one 25bps cut for the full year. This matches the Fed's own dot plot guidance.
The yield curve bears watching. The 10-year Treasury at 4.31% and a 2-year near 4.05% suggests the spread is slowly normalizing after a prolonged inversion. Historical evidence — as noted by multiple strategists this week — suggests that "un-inversions" have preceded every recession since 1970. This is not necessarily a near-term alarm bell, but it is a structural signal worth monitoring. The Fed Beige Book releases at 2:00 PM ET today and will provide anecdotal color on regional economic conditions.
BEAT: +0.1% actual; reduces fear of persistent inflation.
8:30 AM
PPI Year-over-Year (Mar)
+3.5%
+3.8%
ACTUAL: +4.0% YoY — energy distortion from Iran premium.
10:00 AM
NFIB Small Business Optimism (Mar)
97.4
97.0 est.
Proxy for Main Street confidence amid geopolitical stress.
2:00 PM
Fed Beige Book (Regional Anecdotes)
N/A
N/A
Anecdotal glimpse into regional economic conditions.
6. EARNINGS WATCH
Q1 2026 earnings season is underway, kicked off by the major U.S. banks. The S&P 500 Financials sector entered this quarter with consensus expectations for approximately 12% year-over-year EPS growth — powered by trading volatility windfalls, recovering investment banking fees, and resilient loan growth.
JPMorgan Chase (JPM) — Reported Pre-Market: Record trading revenue of $11.6 billion in Q1, up 20% year-over-year — the largest quarterly haul in the firm's history. The markets business benefited from elevated client activity as geopolitical uncertainty drove hedging and repositioning demand. CEO Jamie Dimon used the earnings call platform to flag macro risks: recession preparedness, AI disruption across financial services, and the opacity of private credit markets. JPMorgan's fortress balance sheet and diversified revenue streams make it the standard against which Q1 bank results will be measured. Options-implied move: ~3%.
Citigroup (C) — Reported Pre-Market: Net income surged 42% year-over-year to $5.8 billion. EPS of $3.06 was a wide beat versus the $2.63 consensus. CEO Jane Fraser's multi-year transformation plan appears to be gaining traction, with the bank's simplified operating model generating better returns than analysts had modeled. This is the quarter that may force a rerating of Citi's discount-to-book valuation. Options-implied move: ~4%.
Wells Fargo (WFC) — Reported Pre-Market: EPS of $1.60 beat the $1.59 estimate by a penny — but that was the good news. Revenue of $21.45 billion missed the $21.77 billion forecast, and net interest income disappointed as higher funding costs squeezed margins. Shares are down over 6% in pre-market to approximately $83.30. The bank's loan book grew impressively — average loans up 10% YoY to near $1 trillion — but deposit repricing pressure is real. Options-implied move: ~5% (already triggered on the downside).
Goldman Sachs (GS) — Reported Monday: Estimated revenues of ~$16.9 billion for Q1 2026 (+12% YoY) on surging equities trading. Goldman's fixed income and equity desks both benefited from the Iran-conflict volatility regime. Investment banking fees are recovering as M&A pipeline activity picks up after a slow 2025. Morgan Stanley reports Thursday.
7. SECTOR SPOTLIGHT
Financials — The Earnings Kingmaker
The Financials sector is center stage this week, and the early returns are a tale of two business models. Trading-heavy institutions like JPMorgan and Goldman are posting record or near-record results as volatility — historically the enemy of long-term investors — proves to be the best friend of market-making desks. Net-interest-income-dependent banks like Wells Fargo are feeling the squeeze: deposit repricing continues to erode the margin advantage that rising rates once provided, while loan growth provides limited offset. The sector rotation underway favors capital markets firms over traditional commercial lenders.
Energy — The Geopolitical Yo-Yo
Energy is experiencing its most violent intraday swings in years. WTI crude's 5%+ decline today — following Monday's surge above $104 — reflects the market's exhaustion with the Iran binary trade. Energy stocks are highly correlated to crude pricing, meaning the XLE (Energy Select SPDR ETF) is whipsawing investors daily. The longer-term structural question: if a lasting Iran deal is reached, is the energy sector's 2026 outperformance thesis entirely dependent on sustained Middle East tension? Several analysts are beginning to argue yes — and that makes the sector a geopolitical option, not a fundamental investment.
8. ANALYST CALLS & UPGRADES/DOWNGRADES
Notable analyst rating changes from the past 24 hours:
UBS's Joseph Spak flipped his Tesla rating from Sell to Neutral Tuesday — a significant capitulation from one of the Street's most visible bears. The rationale: the recent selloff has made the risk/reward less asymmetric to the downside, and the company's pivot toward AI infrastructure and its humanoid robotics program (Optimus) represents a credible long-term optionality that Spak previously discounted. Key level to watch: $352 is UBS's new target. Options activity was elevated heading into the session, with call interest concentrated in the $360-$380 strike range for May expiry.
Wells Fargo (WFC) — Punished for the Miss
Wells Fargo is the most actionable name in the pre-market today following a 6%+ decline on its revenue miss. The question for investors is whether today's selloff represents a buying opportunity or the start of a more sustained de-rating. The bank's loan book is growing impressively, but NII compression is a structural headwind until the Fed cuts. Key levels: $83 is immediate pre-market support; the 200-day moving average (near $85) will become near-term resistance. CEO Charlie Scharf's commentary on the asset cap removal timeline will be closely parsed.
Marvell Technology (MRVL) — Barclays Sees AI Upside
Barclays upgraded Marvell from Equal-Weight to Overweight and raised its price target from $105 to $150, citing growing demand for custom AI accelerator silicon and the company's deepening partnerships with hyperscale cloud providers. Marvell sits at the intersection of the AI compute buildout and data center networking — two themes that continue to attract institutional capital. The $150 target implies approximately 40% upside from current levels. Watch for any additional commentary from hyperscalers on custom silicon spending plans in upcoming earnings calls.
Biogen (BIIB) — Piper Sandler's Conviction Call
Piper Sandler upgraded Biogen from Neutral to Overweight with a $214 target, up from $177, arguing that the company's drug launch pipeline is significantly underpriced by consensus models. The focus is on Biogen's neurology franchise and the potential for near-term clinical catalysts. With the stock having underperformed biotech peers in Q1, Piper's analysts see a risk/reward skewed to the upside heading into upcoming data readouts. Biotech broadly has been a defensive play in the current geopolitical environment, making this upgrade particularly timely.
10. GLOBAL MACRO SNAPSHOT
China's trade data released overnight offered a mixed picture. Exports lost momentum in March as manufacturers absorbed higher energy and raw material costs linked to Middle East supply disruptions, but import growth hit its fastest pace in over four years — a signal that domestic demand in the world's second-largest economy is holding up better than feared. Beijing has shown no sign of urgency to deploy additional stimulus, suggesting policymakers are comfortable with current growth trajectory.
European markets opened higher across the board on Tuesday, with Germany's DAX leading gains at +0.9% and the pan-European Stoxx 600 adding 0.6%. European equities are caught between two competing forces: Iran-conflict optimism, which helps energy-importing economies like Germany, and persistent concern about the continent's exposure to slowing global trade. The ECB's next meeting is May 7 — markets are pricing one more 25bps cut, though today's rally may give policymakers pause.
Japan's Nikkei surged 2.43% to 57,877 — a standout performer in Asia — buoyed by the yen's strengthening trend and positive spillover from the Wall Street recovery. The Bank of Japan's cautious normalization path remains the key narrative for Japanese assets. In emerging markets, a weaker dollar and lower oil prices are providing relief to import-heavy EM economies, though the Fed's on-hold posture limits the extent of EM rally potential.
11. WEEK AHEAD PREVIEW
Wednesday brings Retail Sales for March (consensus: +0.5% MoM) — the most important data point of the week after today's PPI print. Strong consumption data would challenge the soft-landing narrative that rate cuts are imminent; a miss could accelerate bond market gains. The Federal Reserve's Beige Book, out today at 2:00 PM ET, provides regional anecdotal color that often previews where the economic consensus is moving.
Thursday is a major earnings day: Morgan Stanley reports pre-market, alongside Netflix in the afternoon. Morgan Stanley's wealth management revenue and IB fee trends will complete the picture of Wall Street banks in Q1. Netflix's Q1 subscriber additions and advertising revenue commentary will set the tone for media and streaming stocks. Also on Thursday: Initial Jobless Claims, the labor market's weekly pulse.
Friday brings the University of Michigan Consumer Sentiment Survey for April (preliminary), which will capture consumer reaction to the Iran conflict's impact on confidence and spending intentions. Geopolitically, the Iran ceasefire timeline is the dominant wildcard — any diplomatic statement from either side could trigger outsized market reactions. The week closes with a packed slate of S&P 500 companies beginning to report, including several major technology and industrial names.
12. CLOSING THOUGHT
There is a tempting narrative forming in markets today: that Iran-optimism plus soft PPI plus strong bank earnings equals a green light to chase risk. Resist the temptation to treat these signals as confirmation of a durable turn. The Iran situation has generated at least three "resolution" rallies in the past month, each of which was followed by a sharp reversal. The geopolitical risk premium in oil has not been permanently deflated — it has merely been temporarily discounted on the strength of unverified diplomatic signals.
The more durable story may be what the PPI data is quietly suggesting: that the underlying inflationary pressure in the U.S. economy, stripped of the energy distortion, is actually dissipating faster than the Fed is acknowledging. If that is true, and if the Iran situation resolves, the bond market may be meaningfully mis-priced. A 10-year yield at 4.31% in a world where core inflation is trending below 3% and the Fed signals one cut — that is a yield that should be considerably lower. The bond market may be the trade of the second half of 2026.
As the old Wall Street aphorism goes: when everyone is watching the same risk, it often isn't the risk that gets you. Today, everyone is watching Iran. Watch the credit markets instead.
End of Brief · Tuesday, April 14, 2026 · Confidential — For James Flanagan Only
1. THE MORNING SETUP
Wall Street opens Wednesday with a cautious optimism that has become the market's defining posture in this peculiar spring of 2026. The S&P 500 hovers within striking distance of all-time highs — a remarkable feat given that six weeks ago, surging oil prices and a potential naval confrontation in the Persian Gulf had investors contemplating the worst-case scenario. Today, U.S.-Iran talks are back on the table, oil is off its peak, and bank earnings continue to deliver the kind of blowout numbers that remind investors why financial stocks were among the few bright spots in this year's roller-coaster ride.
The single most important story this morning is the convergence of two powerful narratives: the gradual normalization of Middle East risk premia, and a Q1 earnings season that is defying concerns about an economic slowdown. Bank of America posted its strongest earnings-per-share in roughly two decades. Morgan Stanley hit record revenues. The Financials sector is on track for 15% earnings growth. Meanwhile, Federal Reserve watchers are pivoting their attention to next month's leadership handover — Kevin Warsh faces his Senate confirmation hearing April 21, and what he says about balance sheet management and the pace of easing could reshape rate expectations far more consequentially than any single data print. The week ahead is dense with catalysts. For today, the watchword is: bullish but fragile.
2. MARKETS AT A GLANCE
PRICE / LEVEL
1D CHG
YTD CHG
NOTE
🇺🇸 US EQUITIES
S&P 500 (prior close)
6,976
+0.12%
+2.1%
S&P 500 Futures
7,004.75
flat
—
Nasdaq 100 (prior close)
~24,400
+0.96%
+3.4%
Nasdaq 100 Futures
25,993.75
-0.01%
—
Dow Jones Industrials
~43,800
+0.66%
+0.8%
Dow Futures
48,739
flat
—
Russell 2000
~2,080
+0.4%
-1.2%
VIX (Fear Gauge)
18.36
-0.3
—
🌏 ASIA (Wednesday Close)
Nikkei 225 (Japan)
58,134
+0.44%
+4.1%
Hang Seng (Hong Kong)
~23,600
+0.43%
+8.2%
CSI 300 (China)
4,685
-0.34%
+2.7%
Nifty 50 (India)
~24,200
+1.56%
+3.8%
ASX 200 (Australia)
~8,100
flat
+2.3%
🌍 EUROPE (Wednesday Trading)
FTSE 100 (UK)
~8,700
mixed
+4.5%
DAX (Germany)
24,044
+0.4%
+8.1%
CAC 40 (France)
8,328
+0.3%
+3.6%
Euro Stoxx 50
~5,500
+0.3%
+5.2%
🏛 US TREASURIES
2-Year Yield
3.81%
~flat
—
5-Year Yield
~4.05%
~flat
—
10-Year Yield
4.31%
~flat
—
30-Year Yield
~4.70%
~flat
—
💱 CURRENCIES
DXY (Dollar Index)
~103.5
-0.1%
-2.3%
EUR/USD
~1.087
+0.1%
+2.1%
GBP/USD
~1.262
flat
+1.4%
USD/JPY
~148.2
-0.2%
+1.8%
USD/CNY
~7.23
flat
-0.4%
🛢 COMMODITIES
WTI Crude Oil
$92.28/bbl
-0.8%
+28%
Brent Crude Oil
$95.00/bbl
-0.7%
+30%
Natural Gas (Henry Hub)
~$3.45/MMBtu
+0.5%
+12%
Gold (Spot)
$4,877/oz
+0.3%
+18%
Silver (Spot)
~$31.50/oz
+0.4%
+12%
Copper (LME)
~$4.80/lb
flat
+5%
₿ CRYPTO
Bitcoin (BTC)
$74,556
+1.2%
+8%
Ethereum (ETH)
~$3,100
+0.8%
+4%
Note: Futures levels as of early Wednesday premarket. Asia reflects Wednesday's close; Europe reflects early Wednesday trade. All % changes are approximate based on available data. '~flat' indicates minimal movement.
3. TOP STORIES
BANKS DELIVER A BLOWOUT QUARTER — BUT THE DEVIL IS IN THE GUIDANCE
The big story of the week remains the financial sector's blowout Q1 earnings, with Wednesday adding Bank of America and Morgan Stanley to a lineup that already included JPMorgan and Goldman Sachs. The aggregate picture is striking: Financials, as a sector, are tracking 15% year-over-year earnings growth in Q1 — the third-best rate of any S&P 500 sector.
Bank of America's results were the most eye-catching. Net income hit $8.6 billion, or $1.11 per share — against a consensus estimate of $1.01. That 10-cent beat doesn't fully capture the quality of the number: equities trading revenue surged 30%, net interest income rose 9% to $15.9 billion, and the loan-loss provision came in at $1.3 billion, well below last year's $1.5 billion. CEO Brian Moynihan described the consumer as "healthy" — a characterization that carries weight given the bank's 66 million consumer clients. BAC shares rose 1.5% in premarket.
Morgan Stanley topped even that with record net revenues of $20.6 billion. Profit rose 29% to $5.57 billion. Equities trading hit a record $5.15 billion, and investment banking fees climbed 36%. The wealth management business — CEO Ted Pick's strategic crown jewel — pulled in $118.4 billion in net new assets and posted a record $8.52 billion in revenue. The one blemish: investment management revenue fell 4.2%.
The nuance worth watching: JPMorgan, which reported Tuesday, guided net interest income lower even as its EPS handily beat. Markets initially cheered the top-line beat, then punished JPM shares -0.8% when the NII trim registered. It's a reminder that in a plateauing rate environment, the revenue quality of bank earnings matters as much as the headline number. For Financials bulls, this week validates the thesis. The risk: if rates begin falling faster than expected, that NII tailwind reverses sharply.
US-IRAN: BLOCKADE, CEASEFIRE, NEGOTIATION — AND OIL BELOW $100
The geopolitical narrative that has defined global markets since late February took another twist this week, and for the first time in weeks, the direction is cautiously constructive. U.S. and Iranian officials are reportedly weighing a renewed meeting following the collapse of Islamabad peace talks on April 12, which had prompted President Trump to order the U.S. Navy to blockade Iranian ports on April 13.
The sequence matters. A two-week ceasefire announced April 8 had briefly sparked euphoria — the Dow spiked over 1,300 points, Nasdaq gained 2.54%. But when the Abu Dhabi National Oil Company's CEO confirmed the Strait of Hormuz remained restricted despite the ceasefire (Iran was charging "tolls" of over $1 million per ship), the optimism curdled. Peace talks then failed entirely, and Trump escalated with the blockade order.
As of Wednesday, Brent crude sits at approximately $95/barrel — down from the $102 peak but still 30% above pre-conflict levels of ~$70. WTI is at $92.28. The partial recovery in oil prices (from a peak above $100) reflects market belief that the blockade is tactical, not a path to indefinite closure. The "so what" for markets: every $5 move in Brent crude translates to roughly 0.2-0.3 percentage points of headline CPI. The Fed cannot ignore that math — and neither can Kevin Warsh, who inherits the inflation question from Jerome Powell.
META AND BROADCOM REWRITE THE AI CHIP LANDSCAPE
In a deal that sent Broadcom shares up more than 3% and cemented the company's position as the defining force in custom AI silicon, Meta announced it is committing to an initial deployment of 1 gigawatt of custom AI accelerators — called MTIA chips — designed in partnership with Broadcom, with an agreement extended through 2029. The chips will use a 2-nanometer process, the most advanced production node in commercial deployment.
The strategic implications run deep. Meta is explicitly choosing to build around Broadcom-designed custom silicon rather than relying on Nvidia's GPUs for its AI training workloads. This is the continuation of a hyperscaler trend — Google, Microsoft, and Amazon have all moved toward custom silicon — but the scale of Meta's commitment (multiple gigawatts in the pipeline beyond the initial 1 GW) is unprecedented for a single custom chip program. Broadcom's CEO Hock Tan simultaneously announced he would not stand for re-election to Meta's board, transitioning to an advisor role — a governance change that removes a potential conflict-of-interest overhang.
For Nvidia investors, this is not an existential threat today, but it is a structural one over the next 18-36 months. Hyperscaler custom silicon displaces GPU demand at the margin. For Broadcom, the deal validates an asset-light model: the company doesn't fab chips but designs and integrates them, capturing significant value without Nvidia's capital intensity. Year-to-date, AVGO is up more than 10%, outpacing the S&P's roughly 2% gain.
KEVIN WARSH FACES SENATE — AND A $192 MILLION QUESTION
The Federal Reserve's leadership transition moved from abstract to concrete this week. Kevin Warsh, Trump's nominee to replace Jerome Powell (whose term expires May 15), cleared a procedural hurdle Thursday when the Senate Banking Committee scheduled his confirmation hearing for April 21. The timing is razor-thin: Senate confirmation, if granted, may not come until days before Powell's departure.
Warsh's financial disclosures added an unusual wrinkle: his and his wife Jane Lauder's holdings total approximately $192 million — potentially making him the wealthiest Fed chair on record. More substantively, Warsh has signaled he'd like the Fed to aggressively sell down its holdings of long-term Treasury bonds and mortgage-backed securities. That balance sheet reduction stance could push long-term yields higher, flattening the already-fragile economic recovery and creating a headwind for equity valuations.
One wild card: Sen. Thom Tillis (R-NC) has said he will block final approval until a federal criminal probe into Powell is resolved — an investigation whose existence has not been independently confirmed but which adds political uncertainty to an already consequential transition. Markets are pricing a more than 97% probability that rates hold at 3.5%-3.75% at the April 28 FOMC. The bigger question: what does Warsh do at the June meeting?
IMPLICATION WATCH: IMF DOWNGRADES GLOBAL GROWTH OUTLOOK
The International Monetary Fund released its April 2026 World Economic Outlook on Wednesday, cutting its global GDP growth forecast amid elevated energy prices, persistent inflation, and geopolitical uncertainty. The conflict-driven spike in oil prices has had an asymmetric impact: energy-importing economies in Europe and Asia face a stagflationary squeeze, while Gulf producers enjoy a windfall. The IMF flagged the Hormuz situation specifically as the single largest near-term downside risk to global growth.
The market implication is nuanced: lower growth forecasts globally increase the probability that the Fed ultimately has to cut faster than currently priced (currently, a cut at April 28 FOMC is near-zero probability), but sticky energy-driven inflation keeps the Fed's hands partially tied. This is the stagflation dilemma that characterized 2025, and it has not been resolved. Equity markets have thus far chosen to focus on the earnings side of the ledger rather than the macro risk. That bet continues to be rewarded — but the risk of a reversal grows with each passing week that oil remains above $90.
NVIDIA + AMAZON: AI INFRASTRUCTURE SPENDING SHOWS NO SIGNS OF FATIGUE
While Meta's Broadcom deal captures headlines, it's worth zooming out on the AI infrastructure investment supercycle. Amazon Web Services announced an expansion of its partnership with Nvidia, with AWS committing to the next generation of GPU clusters for deployment in 2026-2027. Nvidia shares gained 3.75% in Tuesday's session, recovering from a mid-March pullback. The broader theme: despite the hyperscaler pivot toward custom silicon, Nvidia continues to win the near-term AI capex race because custom silicon takes 18-24 months from design to deployment at scale.
The practical upshot: Nvidia's data center revenue continues to grow even as its long-term competitive moat is being quietly eroded. For investors, this creates a valuation question — how much of Nvidia's current multiple reflects the near-term dominance versus the long-term custom silicon threat? The market, for now, is betting on the former.
4. MACRO & FED WATCH
The Federal Reserve sits at a particularly uncomfortable intersection: oil-driven inflation that it cannot control through rate policy, a leadership transition that injects structural uncertainty, and an economy that is neither obviously strong nor clearly weakening. The federal funds rate has been at 3.5%-3.75% since late 2025, representing roughly 100 basis points of cumulative cuts from the 2023-2024 peak. Markets are pricing zero probability of a cut at the April 28 FOMC meeting.
Fed funds futures currently price the first cut of 2026 no earlier than July, and even that is below a 65% probability. The FOMC committee is deeply divided: seven members expect just one cut through 2026, while the same number see rates holding steady through year-end. This is not a committee looking for an excuse to ease — it is a committee genuinely uncertain about the inflation trajectory given oil.
The yield curve bears watching. The 10-year at 4.31% vs. the 2-year at 3.81% represents a positive spread of 50 basis points — the curve has re-steepened from the deep inversion of 2023-2024. This re-steepening is historically a sign that markets are pricing a more normal economic cycle ahead, but it can also signal genuine concern about long-duration inflation risk. If Warsh follows through on balance sheet reduction (selling long-dated Treasuries), the 30-year could push toward 5.0%, putting real pressure on mortgage rates, corporate bond spreads, and equity discount rates.
Jerome Powell's final FOMC meeting is April 28. His legacy, paradoxically, may be defined less by the rate cuts he delivered than by the institutional credibility he preserved during a politically turbulent period. Warsh enters with a mandate from a president who has historically preferred lower rates — but inherits a committee that will not be easily herded. The market's base case: Warsh leans hawkish on QT but is pragmatic on the rate path. Any surprise dovishness at the April 21 confirmation hearing could trigger a meaningful Treasury rally.
5. ECONOMIC CALENDAR — TODAY (WEDNESDAY, APRIL 15)
TIME (ET)
INDICATOR
PRIOR
CONSENSUS
WHY IT MATTERS
8:30 AM
Empire State Mfg. Index (Apr)
-20.9
~-14.0
Gauge of NY manufacturing health; proxy for broader industrial demand
8:30 AM
Import Price Index (Mar)
+0.4%
+0.1%
Oil price swings will distort; core ex-petroleum tracks imported inflation
9:15 AM
Industrial Production (Mar)
-0.3%
+0.2%
Capacity utilization & factory output — key signal for manufacturing recession risk
Inventory build/draw signals supply chain health and future production needs
Fed Speakers
FOMC Members (Various)
N/A
N/A
Markets hunting for signals ahead of April 28 FOMC with rate at 3.5%-3.75%
6. EARNINGS WATCH
The Q1 2026 earnings season has opened with a resounding affirmation of Financial sector strength — and today adds two more blue-chip confirmations to an already bullish running tally.
COMPANY
EPS EST.
EPS ACT.
REV ACT.
VERDICT
Bank of America (BAC) — Pre-Mkt
$1.01
$1.11 ✓
$30.43B
Beat on EPS & revenue; equities trading +30%
Morgan Stanley (MS) — Pre-Mkt
~$2.30
Beat ✓
$20.6B (rec.)
Record revenue; equities trading hit record $5.15B
JPMorgan Chase (JPM) — Tues.
$5.46
$5.94 ✓
$50.5B
Beat; guided NII lower — stock fell -0.80%
Goldman Sachs (GS) — Tues.
TBD
Beat ✓
Record
IB fees +30% YoY; equities trading surged
The broader earnings season context: the S&P 500 Financials sector is tracking 15.1% year-over-year earnings growth — third-best of all eleven sectors. What's driving it? A combination of resilient net interest margins (rates haven't fallen enough to hurt), record equity and debt capital markets activity (the IPO and M&A pipeline, dormant in 2024-2025, has reopened), and trading desks that have benefited from elevated volatility. The fee revenue jump at JPMorgan (+28% YoY) and investment banking surge at Goldman and Morgan Stanley confirm that corporate America is transacting again — a leading indicator for broader economic activity.
Options markets implied roughly 3-4% moves for BAC and MS around earnings — both trades that would have paid off for volatility buyers on the upside. The next major earnings catalysts on the radar: Netflix reports next week, followed by the mega-cap tech cohort (Alphabet, Microsoft, Meta, Amazon) in the final week of April and first week of May. Consensus expectations for mega-cap tech are high — the bar to beat is elevated.
7. SECTOR SPOTLIGHT
Financials: The Unsung Leader of Q1
Financials entered 2026 as a consensus underweight — rate-cut expectations had suppressed enthusiasm for banks, and geopolitical risk seemed likely to dampen capital markets activity. Both assumptions proved wrong. Net interest margins have held up better than models predicted, and capital markets revenues have surged as the volatility of the Iran conflict paradoxically drove trading desk profits. Equities trading, in particular, has been a standout: Morgan Stanley's $5.15 billion in equities trading revenue is a record for the firm.
The sector rotation story is now one of the most interesting in markets. Technology was the consensus overweight entering the year; Financials was the consensus underweight. Year-to-date performance is beginning to converge. If the rate path turns more hawkish under Warsh, banks could outperform further — but the risk is that an economy weakened by oil prices and high rates eventually hits the credit quality of bank loan books. The loan-loss provision declines reported this week are a backward-looking indicator. Watch Q2 guidance on credit quality carefully.
Energy: The Volatility Trade
The Energy sector has been the year's most volatile, tracking oil prices that have swung from ~$70 pre-conflict to above $100 and back to ~$92-$95. Chevron fell -2.47% in Tuesday's session, leading S&P 500 laggards — a reminder that oil stocks don't just track crude prices linearly. When peace talks revive and oil falls, energy equities can sell off sharply even from elevated levels. The sector is now effectively a geopolitical options trade: long peace = sell Energy, long escalation = buy Energy. Producers with hedged production books are better positioned for volatility; unhedged E&P names carry more tail risk.
Hyperscaler capex constraints; execution risk on MI-series
9. STOCKS TO WATCH
Bank of America (BAC) — The Quality Beat
BAC enters Wednesday up ~1.5% in premarket on its strongest EPS print in roughly 20 years. The key levels to watch: BAC has been consolidating in the $43-$47 range; a clean break above $47 on volume would be technically significant and could attract momentum buyers. The bull case is straightforward — equities trading momentum, healthy consumer credit, and NIM resilience. The bear case: the fixed income trading line disappointed by ~$330M, and if rates fall faster than expected, NII guidance gets cut. Options markets had priced a ~3% implied move; the 1.5% premarket gain suggests the market is respecting the beat without going euphoric.
Broadcom (AVGO) — The AI Infrastructure Kingmaker
AVGO surged more than 3% Tuesday on the Meta deal news and enters Wednesday as the AI infrastructure stock with the most compelling near-term catalyst calendar. The Meta commitment of 1 GW of MTIA chips — with multi-GW follow-on planned — is transformational for Broadcom's custom silicon revenue. AVGO is already up more than 10% year-to-date. The options-implied move for the week is around 4%; with the stock at ~$210-$215, traders are setting up for a possible test of the $220-$225 range. Key risk: if Nvidia's next earnings show custom silicon is eating into data center GPU orders faster than expected, AVGO's premium could compress.
Amazon (AMZN) — Up 3.83%, AI & Earnings Tailwinds
Amazon led S&P 500 gainers Tuesday with a 3.83% surge, driven by the Nvidia-AWS partnership expansion announcement and renewed optimism about AWS cloud demand in the AI era. AMZN is approaching its Q1 earnings release (expected late April) with momentum. The key question for Amazon's quarter: AWS revenue growth re-acceleration (consensus expects 18-20% growth) and retail margin improvement. The Iran oil price situation is a double-edged sword for Amazon — higher fuel costs hurt logistics margins, but a normalization in energy prices (currently underway) removes a key headwind. Key level: $220 is technical resistance; a clean break sets up a move toward $235.
Nike (NKE) — Surprising Strength in a Challenged Retailer
Nike rose 3.01% Tuesday, making it one of the session's better performers despite the stock being in a multi-month downtrend driven by North America market share losses and China revenue headwinds. The rebound may reflect short-covering as Iran fears moderate (Nike has meaningful China exposure, and a stabilizing geopolitical environment reduces EM risk premia) or early positioning ahead of its next earnings print. The company faces structural headwinds from Hoka and On Running in performance footwear. Technically, NKE is testing resistance at ~$78-$80; the risk/reward for a sustained rally is poor without a fundamental catalyst. Watch Thursday's retail sales data as a consumer sentiment proxy.
10. GLOBAL MACRO SNAPSHOT
China continues to walk the tightrope between stimulus and deleveraging. The CSI 300's -0.34% dip Wednesday bucked regional gains, reflecting investor ambivalence about Beijing's policy trajectory: recent data showed marginal improvement in factory output, but property sector stress persists and export demand faces headwinds from a slow global economy. The People's Bank of China has been cautious on rate cuts, wary of capital outflows if the yield differential with the U.S. narrows further. USD/CNY at ~7.23 remains managed; a weaker yuan would normally boost exports but risks capital flight.
Europe is in stagflation territory. Energy import costs remain elevated despite the partial Hormuz reopening; German factory output has contracted for two consecutive quarters. The DAX's resilience (+8.1% YTD) reflects the European market's heavy weighting toward industrials and materials that benefit from defense spending and reshoring, not a healthy underlying economy. The ECB is caught between inflation (energy-driven) and recession risk — a mirror image of the Fed's dilemma.
India is the standout emerging market story, with the Nifty 50 gaining 1.56% Wednesday on return from a holiday. India's economy is benefiting from supply chain diversification away from China, robust domestic consumption, and a government infrastructure build-out. The rupee has been relatively stable, and India's energy import diversification (including Russian crude at discounted prices) has partially insulated it from the Hormuz impact. EM investors looking for a safe haven in a volatile year have been rotating into Indian equities — a trend that looks durable.
11. WEEK AHEAD PREVIEW
Thursday brings U.S. Retail Sales for March — the consensus is +0.4%, but given the Iran-driven consumer confidence hit in late March, a downside miss is plausible. A weak retail number would immediately revive rate-cut speculation and put pressure on financials stocks whose rally is partly predicated on a resilient consumer. Industrial Production and Capacity Utilization (also Thursday) will round out the manufacturing picture; a second consecutive decline in IP would deepen recession concerns.
Friday brings the University of Michigan Consumer Sentiment survey — the inflation expectations component will be scrutinized. If one-year inflation expectations remain elevated (above 3.5%), the Fed's ability to cut is further constrained. Elsewhere: the IMF and World Bank Spring Meetings continue through the week, with finance ministers from G20 nations discussing the global energy crisis and its macro implications.
On the earnings front, next week's calendar includes Netflix on Tuesday, April 21 — a crucial read on streaming subscription resilience and password-sharing monetization. That same day is Kevin Warsh's Senate confirmation hearing, which markets will watch intensely for any signals on balance sheet policy and rate philosophy. The final week of April brings Alphabet, Microsoft, and Meta — the AI capex numbers from these three companies will either validate or complicate the Broadcom and Nvidia bull theses. Buckle up: the next two weeks may be the most consequential of the year.
12. CLOSING THOUGHT
Here is the contrarian case the market is not fully pricing: the Iran conflict ends, oil falls back to $70, and inflation drops rapidly — and the Fed still can't cut rates meaningfully because the economy re-accelerates too fast. In that scenario, the yield curve steepens aggressively, long rates move toward 5%, growth stocks reprice lower, and the Financials rotation accelerates. The consensus narrative for a soft landing assumes the Fed can thread the needle between a too-slow recovery and overheating. But history suggests that when geopolitical risk premia unwind rapidly, the economic rebound tends to overshoot the base case.
The parallel worth considering is 1991: after the Gulf War ended swiftly and oil prices collapsed, the U.S. economy did not immediately boom — it had already absorbed the demand destruction of high oil prices. The 2026 version may rhyme. Markets are pricing a benign path. The risk is that the combination of a new, more hawkish Fed chair, an overstimulated AI investment cycle, and an economy that is neither clearly strong nor clearly weak creates more volatility than the 18.36 VIX reading suggests. The VIX at 18 is not complacency — but it is not fear either. In a world this uncertain, that feels like an underpriced number.
Trade carefully. Think globally. Read between the lines.
— Daily Financial Brief | Wednesday, April 15, 2026
1. THE MORNING SETUP
Markets are riding an extraordinary wave of optimism this Thursday morning as investors dare to price in the end of a war. After the S&P 500 closed at a record 7,022.95 and the Nasdaq posted its eleventh consecutive gain — both indices erasing all losses suffered since the U.S.-Iran conflict erupted — futures are nudging modestly higher in pre-market trade. The single most important dynamic shaping every asset class today is the same one that has dominated global markets for weeks: the fate of U.S.-Iran ceasefire negotiations, and whether a fragile two-week truce can be extended into a durable peace.
President Trump declared the Iran war is 'very close to over,' and equity bulls have taken him at face value. The dollar has slid to six-week lows near 98 on the DXY, crude oil has retreated sharply from its blockade-era highs, gold is holding near $4,820 an ounce — elevated, but off its peak — and Asian equities have extended the global rally on the back of surprisingly strong Chinese GDP data. Yet the ceasefire remains fragile, talks in Islamabad concluded without a final deal, and the Strait of Hormuz blockade has not been formally lifted. Peace optimism and energy-supply anxiety are colliding in real time, making this market both celebratory and treacherous in equal measure. Buckle up.
2. MARKETS AT A GLANCE
INSTRUMENT
PRICE / LEVEL
1D CHANGE
5D CHANGE
YTD / NOTE
US EQUITIES — Prior Session (April 15) & Futures
S&P 500 (Close)
7,022.95
+0.80%
+3.2%
+8.1% YTD
S&P 500 Futures (ES)
~7,037
+0.19%
—
Record run
Nasdaq Comp. (Close)
24,016.02
+1.59%
+4.1%
+11.3% YTD
Nasdaq Futures (NQ)
~24,060
+0.21%
—
11-session win streak
Dow Jones (Close)
48,463.72
-0.15%
+1.1%
+4.4% YTD
Russell 2000
~2,180
+0.30%
+1.5%
+2.8% YTD
VOLATILITY
VIX (Fear Gauge)
18.17
Declining
—
Below 20 = stable
ASIA CLOSE (April 16 AM)
Nikkei 225 (Japan)
Record High
Positive
+2.1% wk
All-time high
Hang Seng (HK)
+1.71%
+1.71%
+3.5%
Rally cont.
CSI 300 (China)
4,736.61
+1.10%
+2.3%
GDP beat
KOSPI (S. Korea)
Positive
+~0.6%
—
—
ASX 200 (Australia)
Positive
+~0.5%
—
—
EUROPE (Wednesday Close)
FTSE 100 (UK)
10,617.08
+0.08%
+0.9%
Flat on Iran fears
DAX (Germany)
24,053.65
+0.04%
+1.2%
Marginal gain
CAC 40 (France)
8,279.58
-0.58%
-0.3%
Kering drag
US TREASURIES
2-Year Treasury
3.81%
Flat
—
Fed anchored
10-Year Treasury
4.31%
Slight dip
—
+50bp YTD
30-Year Treasury
~4.60%
Flat
—
Curve steepening
FOREIGN EXCHANGE
DXY (Dollar Index)
~98.00
-0.1%
-1.4%
6-week low
EUR/USD
~1.088
+0.1%
+1.1%
Dollar weakness
GBP/USD
~1.302
+0.2%
+0.8%
—
USD/JPY
~142.5
-0.3%
-1.5%
Yen strengthening
USD/CNY
~7.21
-0.1%
-0.4%
Yuan firm on GDP
COMMODITIES
WTI Crude Oil
~$91.91/bbl
-0.5%
-4.0%
+43% vs year ago
Brent Crude
~$95.50/bbl
-0.4%
-3.8%
Iran premium
Natural Gas
~$4.20/MMBtu
+0.3%
+2.1%
Elevated
Gold (XAU/USD)
~$4,820/oz
+0.2%
+2.5%
Near 1-mo high
Silver
~$31.50/oz
+0.4%
+1.8%
—
Copper
~$4.45/lb
+0.5%
+1.2%
China GDP boost
CRYPTOCURRENCIES
Bitcoin (BTC)
~$89,200
+0.9%
+3.2%
Iran rally fades
Ethereum (ETH)
~$2,332
-0.1%
+2.8%
Profit-taking
3. TOP STORIES
I. Iran Ceasefire Hangs by a Thread — Markets Bet on Peace
The Iran-U.S. conflict — now roughly six weeks old — has remade the global macroeconomic landscape more dramatically than any geopolitical event since the 2022 Ukraine invasion. The Strait of Hormuz, through which approximately 20% of the world's seaborne oil typically flows, remains effectively shuttered under a U.S. naval blockade of Iranian ports. Energy markets have recalibrated: WTI crude surged more than 40% year-over-year before retreating in recent days on ceasefire hopes, and the price shock has been a primary driver of the IMF's decision this week to slash its 2026 global growth forecast.
Pakistan brokered a new round of talks, and Trump's rhetoric has shifted notably more optimistic — 'very close to over,' the President said Tuesday — but senior U.S. officials have been careful to note that no formal ceasefire extension has been agreed. The sticking points are significant: Iran's nuclear program and the exact terms for reopening Hormuz remain unresolved. Markets are priced for a deal. If one fails to materialize before the current truce expires next week, expect an immediate and violent reversal — crude could spike 8-10% on any breakdown, taking equities with it.
What to watch: Any White House or State Department statement on ceasefire extension. Hormuz shipping data. Iran's Foreign Ministry messaging.
II. Taiwan Semiconductor Posts Record Quarter — AI Demand Proves Durable
Taiwan Semiconductor Manufacturing Company (TSM) delivered a blockbuster Q1 before the U.S. open Thursday, reporting revenue of $35.9 billion — a 40.6% year-over-year surge that beat the $35.35 billion consensus — and GAAP EPS of $3.49, exceeding the $3.30 estimate by 6%. Gross margin of 66.2% and operating margin of 58.1% both topped expectations, and management raised its full-year 2026 revenue growth guidance to above 30% in U.S. dollar terms. The results are the clearest confirmation yet that the AI infrastructure buildout is not a paper thesis — it is generating real revenue at scale.
TSMC manufactures chips for Apple, Nvidia, AMD, Qualcomm, and virtually every major technology company on earth. A blowout here validates the spending plans of hyperscalers (Microsoft, Amazon, Alphabet, Meta), whose capex commitments have drawn skepticism from value investors. For semiconductor investors, the report effectively closes the debate about near-term demand: TSMC's 3nm and 5nm nodes are running at full utilization. For macro investors, the report adds a data point that the AI productivity cycle has sufficient momentum to partially offset geopolitical headwinds.
What to watch: Nvidia earnings (next week), ASML guidance update (April 18 — key gauge of leading-edge chip equipment demand).
III. Netflix Reports After the Close — The Ad-Tier Reckoning
Netflix is the marquee earnings event of Thursday's session, reporting after the 4:00 PM close. Analysts expect Q1 revenue of $12.16-12.18 billion (+15% YoY) and EPS of approximately $5.72, reflecting guided operating margins of 32.1%. But the headline number is almost beside the point. Wall Street's attention is laser-focused on advertising revenue growth — management guided for a doubling of its $1.5B ad-revenue base in 2026 to $3 billion — and whether subscriber growth on the ad-supported tier is tracking that trajectory. Netflix stopped routinely disclosing subscriber counts, making revenue-per-user and engagement metrics the new primary reads.
The broader question Netflix must answer is whether its pivot from a pure subscription model to an ad-supported, live sports, and commerce-enabled platform is creating a structurally higher earnings power than even bulls have modeled. The company's options-implied move into earnings is approximately 7-8%, suggesting significant investor uncertainty. A revenue miss or cautious Q2 revenue guidance would punish the stock disproportionately given its premium valuation. A beat on both revenue and margin — particularly if advertising growth is ahead of plan — could add meaningfully to the S&P 500's record-setting run.
What to watch: Ad-supported tier subscriber numbers, Q2 revenue guidance, advertising revenue disclosure, any comments on live sports rights strategy.
IV. IMF Cuts Global Growth Forecast — War Darkens Outlook
The International Monetary Fund delivered a sobering message from its Spring Meetings this week: the Iran war has materially darkened the global economic outlook. The Fund cut its 2026 global growth forecast to 3.1% — down from January's projection and well below pre-pandemic averages — while raising its headline inflation forecast to 4.4%. The Middle East and Central Asia region bore the steepest downgrade, with growth slashed by 2 percentage points to 1.9%. Emerging market growth was cut to 3.9% from 4.2%.
The IMF's adverse scenario paints a grimmer picture: if energy prices spike further, growth could fall to 2.5% globally while inflation rises to 5.4%. For central banks already navigating the tension between elevated inflation and slowing growth, this stagflationary backdrop narrows the policy space dramatically. The Fed, which already projected only one cut in 2026 at its March meeting, faces a world in which energy-driven inflation could linger — and some officials have begun to openly discuss the possibility that the next move could be a hike rather than a cut.
What to watch: IMF Spring Meeting communique (this weekend), World Bank growth update, G7 energy security statements.
V. China GDP Beats — 5% Growth Reaffirms Stimulus Success
China reported Q1 2026 GDP growth of 5.0% year-over-year Thursday morning — ahead of the 4.8% consensus and an acceleration from Q4's 4.5% pace. On a sequential basis, the economy expanded 1.3%, slightly below the 1.4% forecast but an improvement over the prior quarter. Strong infrastructure investment (up 11.4% YoY in January-February, driven by 15th Five-Year Plan projects), Lunar New Year consumer spending, and a pre-conflict export surge all contributed. Belt and Road trade with partner nations rose 20% YoY.
The data provided a meaningful tailwind for Asian equity markets Thursday, with Hong Kong's Hang Seng rising 1.71%, mainland China's CSI 300 gaining 1.10%, and Japan's Nikkei setting a fresh record high. Copper — the commodity most tightly linked to Chinese industrial demand — gained 0.5% to $4.45 per pound on the news. The caveat: March export growth slowed dramatically to 2.5% YoY from January-February's 21.8% pace, as the Iran war's energy shock began to weigh on global demand. The second quarter will be the real test of whether China's economy can sustain momentum in a more hostile global environment.
What to watch: April PMI data (late month), China Q2 guidance from PBOC, retail sales and industrial production for March.
VI. The Dollar's Quiet Retreat — And What It Signals
Almost unnoticed amid the geopolitical drama, the U.S. dollar has been quietly losing ground. The DXY dollar index settled near 98 Wednesday, a six-week low representing a seventh consecutive session of declines and a retreat to levels last seen before the Iran conflict began in earnest. The dollar is being squeezed from multiple directions: peace talks raise expectations that the energy shock — and its attendant inflationary pressure — will ease, reducing the probability of additional Fed tightening. Simultaneously, the strong Chinese growth print and the global equity rally are drawing capital toward risk assets and away from safe-haven dollar holdings.
For U.S. multinationals, a weaker dollar is a tailwind to international earnings — a factor that could provide a positive surprise in Q1 results for companies with significant foreign revenue exposure. For emerging market economies, particularly commodity exporters, the dollar's retreat provides relief on debt servicing costs. But the move could reverse sharply if ceasefire talks collapse and energy prices spike anew. Currency traders are, in effect, making the same geopolitical bet as equity investors — just expressing it in the FX market.
What to watch: Fed speakers this week, inflation expectations breakevens, any ceasefire news that could reverse dollar-bearish sentiment.
4. MACRO & FED WATCH
The Federal Reserve held its target federal funds rate at 3.50%-3.75% at the March meeting, with nearly all voting members backing the hold and just one dissent in favor of a cut. The dot plot — updated at that meeting — signaled only one rate cut remains projected for 2026, a hawkish revision from the two cuts penciled in late last year. Fed officials have since been more forthright about upside inflation risks, with some explicitly discussing whether the next move might be a hike rather than a cut. The war-driven energy shock has been the catalytic shift.
The yield curve provides a nuanced picture. The 2-year Treasury yield at 3.81% remains below the federal funds rate midpoint (3.625%), implying the market still prices some eventual easing — but the magnitude has compressed considerably. The 10-year at 4.31% reflects a market grappling with structurally higher 'neutral' rate assumptions and a Federal Reserve no longer rushing to cut. The spread between 10-year and 2-year yields (approximately +50 basis points) shows a steepening curve — more consistent with a 'higher for longer' regime where long-term inflation expectations are rising than with an imminent recession.
Fed funds futures currently price approximately one 25-basis-point cut in late 2026, with the December meeting the most likely venue. Any upside surprise in today's jobless claims, industrial production, or the Philadelphia Fed data could further compress those expectations. A significant miss — particularly in claims — would give rate-cut advocates new ammunition. The Fed's next scheduled policy meeting is May 6-7, with the May CPI release (due May 13) potentially the deciding factor for whether easing remains on the table at all this year.
Fed Chair Powell has not spoken publicly since the March meeting. Several regional Fed presidents are scheduled to speak this week — their commentary on the inflation vs. growth tradeoff in the context of the Iran energy shock will be closely watched. The core message so far: patience, vigilance on inflation, and no predetermined path.
5. ECONOMIC CALENDAR — THURSDAY, APRIL 16, 2026
TIME (ET)
INDICATOR
PRIOR
ESTIMATE
WHY IT MATTERS
7:30 AM
Philadelphia Fed Mfg. Index (Apr)
18.1
10.3
Key read on mid-Atlantic factory conditions; drop signals softening demand
8:30 AM
Initial Jobless Claims (Apr 11 wk)
~210K
~215K
Weekly labor market pulse — rising claims would validate Fed patience on cuts
8:30 AM
Continuing Claims
~1.85M
~1.87M
Signals how long unemployed workers remain out — measures labor tightness
9:15 AM
Industrial Production (March)
+0.2%
+0.3%
Measures factory, mining and utility output — proxy for real-economy health
9:15 AM
Capacity Utilization (March)
78.2%
78.4%
How efficiently industry uses resources — above 80% can signal inflationary pressure
10:00 AM
Leading Economic Index (March)
-0.3%
-0.2%
Forward-looking composite — consecutive declines flag recession risk
6. EARNINGS WATCH
TICKER
COMPANY
TIME
EPS EST.
FOCUS
TSM
Taiwan Semiconductor
Pre-Mkt
$3.30 → Beat $3.49
AI chip demand; raised FY2026 revenue guide >30% growth
Pricing power in snacks/beverages; consumer resilience signal
Q1 2026 earnings season is off to a strong start, with TSMC's blowout report setting a bullish tone for the technology sector. The S&P 500 is now on track to deliver mid-teens earnings growth for the quarter on the back of resilient technology and energy sector results. The key question as earnings season progresses: can consumer-facing and industrials companies demonstrate that the energy price shock has not yet passed through to margin compression? PepsiCo's pre-market beat suggests pricing power remains intact in staples. Tonight's Netflix report will provide a high-profile test of whether the consumer is still spending on discretionary services. With 39 companies reporting Thursday alone, the breadth of the data flow will help investors triangulate the health of the broader economy beyond the headline indices.
7. SECTOR SPOTLIGHT
Technology: AI Tailwinds Overpower Macro Headwinds
Technology led Wednesday's session and has been the primary engine of the 11-session Nasdaq win streak. TSMC's blowout results validate the AI infrastructure thesis at the hardware layer. Microsoft surged 5.23% on Azure AI infrastructure developments; Salesforce added 4.24% on enterprise cloud momentum; IBM gained 2.26%. The analyst community is upgrading Nvidia and Cloudflare in anticipation of sustained AI-driven enterprise spending. The underlying dynamic: corporate IT budgets that were frozen during the initial Iran war shock are thawing as peace hopes rise, and AI projects — many of which have demonstrated tangible ROI in pilot phases — are the first priorities for resumption.
The risk to this narrative is valuation. With the Nasdaq at all-time highs and many leading AI names trading at 30-50x forward earnings, the margin for error on execution is thin. Any stumble in hyperscaler capex guidance during Q1 earnings calls — or any diplomatic setback that reignites energy price pressure — could trigger a swift de-rating. Tonight's Netflix report will be an important sentiment check on whether premium valuation is still being rewarded.
Energy: A Sector at a Crossroads
Energy stocks face a uniquely bifurcated setup. Upstream producers benefit from elevated crude prices — WTI near $92, still some 40%+ above year-ago levels — but peace talks and the potential reopening of Hormuz create ceiling pressure. Oilfield services companies are getting analyst upgrades (ProPetro, Atlas Energy) as operators lock in drilling programs while prices remain elevated. The key risk event: any credible Hormuz reopening announcement could trigger a 5-10% crude selloff that would drag the entire sector lower. Energy is the market's geopolitical hedge — owning it is a bet that the conflict persists; selling it is a bet that diplomacy succeeds.
8. ANALYST CALLS & UPGRADES / DOWNGRADES
FIRM
STOCK
ACTION
PT
RATIONALE
Seeking Alpha / Multiple
NVDA (Nvidia)
UPGRADE → Buy
—
AI trade momentum regaining; data center demand proving durable
Bullish on enterprise security tailwinds; AI network infrastructure beneficiary
Citigroup
PUMP (ProPetro)
Upgrade → Buy
$16
Energy services rebound; higher WTI supports oilfield spending outlook
Citigroup
AESI (Atlas Energy)
Upgrade → Buy
$18
Raised PT from $10.40; favorable proppant pricing and basin activity
9. STOCKS TO WATCH
TSMC (TSM) — Beat and Raise, AI Demand Confirmed
TSM exploded past estimates Thursday morning: $3.49 EPS (vs. $3.30 estimate), $35.9B revenue (+40.6% YoY), gross margins of 66.2%. Management raised full-year revenue growth guidance to above 30% in USD terms. The stock is likely to open sharply higher. Key levels to watch: the stock was consolidating near $185-190 ahead of earnings. A breakout through $195-200 on strong volume would signal new institutional interest. Watch for derivative activity — implied volatility will collapse post-earnings, creating roll opportunities for options traders. Longer term, the TSMC story is a direct proxy for AI infrastructure spending, and today's results reinforce the bull case for the entire semiconductor value chain.
Netflix (NFLX) — The $12 Billion Revenue Test
NFLX reports after tonight's close with $12.16-18B revenue expected and 32.1% operating margin guided. The stock has appreciated meaningfully in recent weeks as Iran optimism lifted risk appetite broadly. Options-implied move is approximately 7-8% in either direction. The bull case: advertising revenue is doubling, engagement metrics are strong, and the company is monetizing its user base more effectively than at any point in its history. The bear case: the stock already prices a lot of good news, and any softness in ad-revenue ramp or subscriber growth trends could trigger a significant pullback. Key level to watch on the upside: $1,050; downside support around $920.
Microsoft (MSFT) — AI Infrastructure Breakout
MSFT surged 5.23% Wednesday to $413.65 following a breakthrough announcement on Azure AI infrastructure. The move positions Microsoft as a direct beneficiary of TSMC's record AI chip demand. Microsoft reports earnings April 29 — the market is now pricing in a strong quarter on Azure AI revenue acceleration. Watch whether the stock can hold above $410 in the near term; that level was significant resistance in early 2026. The institutional consensus is shifting from 'wait and see on AI monetization' to 'the monetization is happening now.' MSFT has the most credible near-term AI revenue story of any mega-cap stock.
Caterpillar (CAT) — Macro Canary
CAT was Wednesday's biggest Dow laggard, tumbling 3.62% to $764.95 on slowing global demand concerns. As the world's premier heavy equipment maker, Caterpillar is a real-time barometer of global industrial activity — and its weakness amid a broad market rally is worth noting. The company's order book is sensitive to emerging market construction and mining activity, both of which are being pressured by the Iran war's impact on energy costs and emerging market financing conditions. CAT's divergence from the broader market rally is a warning sign that beneath the tech-driven headline indices, the real economy is feeling the strain of elevated energy prices.
10. GLOBAL MACRO SNAPSHOT
China's better-than-expected Q1 GDP print (5.0% vs. 4.8% expected) was the standout international story Thursday morning, but the deceleration in March export growth (2.5% vs. 21.8% in January-February) suggests the tailwind from front-loading trade activity ahead of anticipated tariffs and sanctions is fading. The PBOC has been cautiously accommodative — rate cuts and reserve requirement reductions earlier this year provided a buffer — but the second quarter will test whether domestic demand can sustain momentum without export support. Property sector stabilization remains incomplete, and consumer confidence, while improved from 2025 lows, has not fully recovered.
In Europe, markets are navigating a dual challenge: elevated energy import costs from the Hormuz disruption (Europe has rerouted significant LNG supply but at higher prices) and weak domestic demand. The CAC 40's underperformance Wednesday (-0.58%) was partly driven by Kering's 9.3% plunge — luxury goods are highly sensitive to Chinese consumer sentiment and wealth effects, making the sector a bellwether for European earnings season. The ECB, which cut rates in 2025, now faces the same stagflationary dilemma as the Fed: inflation remains above target, but growth is softening. The May ECB meeting will be closely watched.
Emerging markets face the sharpest divergence: energy exporters (Gulf states, Russia, certain African nations) benefit from elevated crude prices, while energy importers (India, most of Southeast Asia, sub-Saharan Africa) are absorbing a significant terms-of-trade shock. India's equity market has been relatively resilient, but the current account deficit is widening under the weight of oil import costs. The IMF's 2-percentage-point cut to Middle East growth forecasts illustrates the concentrated pain in the conflict's epicenter.
11. WEEK AHEAD PREVIEW
Friday, April 17 brings 22 more earnings reports and 29 economic events. Notable among them: housing starts and building permits data (proxy for mortgage rate sensitivity and consumer confidence) and any follow-on commentary from Fed speakers following this week's data releases. The Producer Price Index release — already referenced as a key inflation gauge this week — will provide additional texture on pipeline price pressures.
The most consequential potential event of the next 7 days has no scheduled time: a breakthrough (or breakdown) in U.S.-Iran ceasefire talks. With the current truce set to expire next week, market participants are effectively operating with an invisible countdown clock. A formal extension or framework agreement could unleash another leg of the equity rally and send crude oil meaningfully lower; a collapse could trigger a sharp reversal in risk assets and a flight to safe havens.
On the earnings front, the week ahead continues with a parade of heavyweights. ASML reports Friday (a critical read on leading-edge semiconductor equipment orders, directly relevant to the AI chip buildout story validated by TSMC this morning). The following week brings Alphabet, Tesla, Meta Platforms, and eventually Microsoft (April 29) — the hyperscaler earnings wave that will either validate or challenge the AI-driven capex narrative. On the macro calendar, U.S. PMI data and existing home sales round out the domestic picture, while European PMIs will offer a read on whether the continent's manufacturing downturn has stabilized.
The Fed's blackout period begins May 2 ahead of the May 6-7 FOMC meeting, meaning this week's speeches from regional Fed presidents represent the last public commentary before the next decision. Any shift in tone toward hawkishness — particularly in light of the Iran-driven inflation risks flagged by the IMF — should be treated as a meaningful signal for rate expectations.
12. CLOSING THOUGHT
The market has essentially already declared peace. The S&P 500 at record highs, the Nasdaq on an 11-session win streak, oil retreating from its blockade peaks, the dollar weakening — every major asset class is pricing the successful conclusion of U.S.-Iran negotiations. That is a remarkable bet to have in a market where the ceasefire has not been formally extended, the nuclear sticking points remain unresolved, and one of the world's most critical waterways is still effectively closed. History offers a cautionary parallel: in August 1990, markets initially rallied on ceasefire optimism during the Gulf crisis before the reality of a protracted conflict set in. The risk being underpriced today is not that the war continues indefinitely, but that the diplomatic timeline slips by even a week or two past what markets have already discounted. In a world where equities are at record highs and volatility (VIX at 18) is relatively subdued, there is a meaningful asymmetry of outcomes: a deal is likely largely priced in; a deal delay is not. In the meantime, enjoy the record highs — just keep one eye on the Strait of Hormuz.
Daily Financial Brief | Thursday, April 16, 2026 | For informational purposes only. Not investment advice.
1. THE MORNING SETUP
The Strait of Hormuz is open — and markets are doing exactly what you'd expect. Iran's announcement late Thursday that it would allow commercial shipping to transit freely through the world's most critical oil chokepoint triggered the single largest geopolitical relief trade in years: crude collapsed more than ten percent overnight, the S&P 500 futures crept higher toward 7,150, and gold — reflecting the residual uncertainty — quietly pushed past $4,867 per troy ounce to yet another record high. After six weeks of war-driven volatility that at points threatened to push Brent above $110 and spiked inflation expectations, Thursday's announcement from Tehran represents a watershed moment for markets.
Yet the word 'fragile' belongs in every sentence written about this ceasefire. President Trump insists the U.S. naval blockade of Iranian ports remains operative. Ceasefire violations have been documented on both sides since the original April 8 truce. And energy traders — burned repeatedly by false dawns in this conflict — are taking the sharp drawdown in crude as a trading opportunity rather than a structural verdict. The Nasdaq's 12-day win streak, its longest since July 2009, and the S&P 500's breathtaking recovery from war-era lows to a fresh all-time high above 7,000 both tell you that the equity market has been pricing in this scenario for weeks. Friday's open will reveal whether the peace dividend has further room to run — or whether the rally has already priced in a resolution that doesn't yet exist on paper.
2. MARKETS AT A GLANCE
Instrument
Price / Level
1D Chg
1W Chg
YTD
Notes
── US EQUITIES ──
S&P 500 (SPX)
7,041.28
+0.26%
+3.3%
+8.1%
Record ATH; 7th consec. weekly gain
Nasdaq Composite
24,102.70
+0.36%
+5.2%
+11.3%
12-day win streak, longest since 2009
Dow Jones (DJIA)
48,578.72
+0.24%
+2.7%
+6.4%
S&P 500 Futures
~7,152
+0.18%
Pre-market; record high territory
Nasdaq 100 Futures
~21,640
+0.13%
VIX
~13.4
-2.1%
Well off March highs; fear fading
── ASIA CLOSE ──
Nikkei 225
58,475.90
-1.75%
+4.8%
+9.2%
Profit-taking after record highs
Topix
3,760.81
-1.41%
Hang Seng (HKG)
~26,820
-1.01%
Shanghai CSI 300
~4,460
-0.17%
KOSPI
6,191.92
-0.55%
── EUROPE ──
DAX (Germany)
~21,900
+0.63%
+2.4%
+7.8%
CAC 40 (France)
~7,960
+0.50%
FTSE 100 (UK)
~8,540
-0.10%
── FIXED INCOME ──
US 10Y Treasury
4.31%
+2bp
+10bp
Yield curve steepening
US 2Y Treasury
~4.01%
+1bp
US 30Y Treasury
~4.60%
+3bp
10Y-2Y spread: +30bp
── CURRENCIES ──
DXY (USD Index)
97.70
-0.52%
-1.8%
-4.2%
Near multi-month lows
EUR/USD
~1.108
+0.4%
GBP/USD
~1.328
+0.3%
USD/JPY
~143.5
-0.6%
Yen strengthening
USD/CNY
~7.195
-0.2%
── COMMODITIES ──
WTI Crude ($/bbl)
$83.20
-12.0%
-18.5%
Hormuz open; 4-month low
Brent Crude ($/bbl)
$88.96
-10.5%
-16.2%
Biggest 1-day drop since Apr 2020
Natural Gas
~$2.95/MMBtu
-1.2%
Gold ($/oz)
$4,867
+1.65%
+4.2%
+22.1%
New record; safe-haven bid holds
Silver ($/oz)
$79.00
+0.5%
+3.8%
+18.4%
4-week rally
Copper ($/lb)
$6.07
+0.8%
+2.1%
+14.3%
Global growth proxy holds up
── CRYPTO ──
Bitcoin (BTC)
$75,429
+0.5%
+5.1%
+18.2%
Highest open since Feb 4
Ethereum (ETH)
$2,351
-0.5%
+2.3%
+4.6%
Lagging BTC on risk-on rotation
3. TOP STORIES
IRAN OPENS THE STRAIT: Oil Crashes 10%+ in Single Session
In a move that sent shockwaves through energy markets, Iran's government announced Thursday evening that the Strait of Hormuz — the 21-mile-wide passage through which roughly 20% of the world's seaborne oil transits — would be reopened to all commercial shipping. WTI crude plunged 12% to $83.20 per barrel while Brent fell 10.5% to $88.96, marking the sharpest single-session decline for global benchmarks since the early days of the COVID-19 pandemic in April 2020. At its peak during the 2026 Iran war, Brent had briefly touched $109/barrel, so Thursday's close still represents a roughly 20% premium to pre-conflict levels.
The geopolitical mechanics matter: the U.S.-Iran ceasefire was technically declared on April 8, brokered by Pakistan, but markets remained skeptical as both sides reported violations in the days that followed. What changed Thursday was Iran's decision to unilaterally reopen the strait — even as the White House maintained that the U.S. naval blockade of Iranian ports remains in effect. This ambiguity is precisely why oil strategists are cautious: the Hormuz announcement without a formal, verified treaty leaves room for rapid reversal.
The market implication runs well beyond crude. Shipping rates that had surged on rerouting demand are collapsing. LNG prices are easing. Airline fuel hedging desks are scrambling. More broadly, the reduction in the oil price — if sustained — would remove roughly 0.3-0.4 percentage points from headline CPI over the next two months, handing the Federal Reserve additional flexibility it currently does not need but may welcome.
What to watch: Confirmation that commercial tankers are actually transiting the Strait unmolested. Any resumption of hostilities — or Trump executive action tightening the blockade — would see crude gap higher rapidly.
NASDAQ'S 12-DAY WIN STREAK: The Last Time This Happened, Obama Was President
The Nasdaq Composite has now posted gains for 12 consecutive sessions — its longest uninterrupted winning run since July 2009, in the early months of recovery from the global financial crisis. Thursday's +0.36% close brought the index to 24,102.70, a fresh all-time high, capping a week-to-date advance of 5.2%. The S&P 500 has gained 3.3% over the same period and closed at a record 7,041.28 — the first close ever above 7,000 for the large-cap index.
The streak is being driven by a confluence of forces: geopolitical optimism around the Iran situation, a resilient U.S. economy that has sidestepped recession fears, strong first-quarter earnings from the megacap technology sector, and a Federal Reserve that — despite persistent inflation — has stopped actively tightening. The setup structurally mirrors the 2009 run, when a market that had been devastated by catastrophic uncertainty began pricing in recovery faster than consensus expected.
The risk is complacency. Twelve-day streaks are statistically rare and tend to resolve with at least a brief pullback, if not a more meaningful consolidation. Breadth indicators suggest the rally remains narrow — mega-cap technology and communication services are carrying the index while defensive sectors like utilities and healthcare trail. A genuine broadening into cyclicals and small-caps would be the bull case signal to watch.
What to watch: Friday's open and whether profit-taking arrives following the Asian market declines. The Russell 2000 small-cap index has significantly underperformed and represents either a warning sign or an opportunity depending on your view of rate trajectory.
GOLD HITS $4,867: The Safe-Haven Bid That Won't Quit
Gold pushed to yet another record high Thursday, touching $4,867.39 per troy ounce — up 1.65% on the session — and extending its remarkable 2026 rally to over 22% year-to-date. The metal's persistence in the face of a broad equity risk-on rally is telling: while oil is pricing in peace, gold is pricing in ongoing structural uncertainty. That uncertainty encompasses not just the Middle East conflict but also dollar weakness (DXY is down 4.2% YTD and near multi-month lows at 97.70), concerns about long-term U.S. fiscal sustainability, and elevated central bank demand from emerging market institutions diversifying away from Treasury holdings.
Silver has also been strong, holding near $79/ounce and on pace for a fourth consecutive weekly advance. Copper — the economy's canonical growth proxy — has held up well at $6.07/lb despite the geopolitical turbulence, suggesting that the base case for global industrial demand remains constructive even as energy costs fluctuate wildly.
What to watch: Whether gold can hold above $4,800 as risk sentiment improves and safe-haven demand potentially moderates. A sustained drop in the 10-year real yield could be the next catalyst higher.
HOMEBUILDERS HIT: Seaport Global Issues Double Downgrade
In one of the day's most striking analyst calls, Seaport Global simultaneously downgraded both Lennar (LEN) and PulteGroup (PHM) from Buy to Sell — cutting their price targets by 47% and 35%, respectively. LEN goes to $74 from $140; PHM to $100 from $155. The firm's thesis is stark: the combination of mortgage rates that remain persistently elevated (30-year conventional rates still above 6.5%), a construction cost environment that shows no near-term relief, and household affordability metrics that have deteriorated to multi-decade lows are creating a structural demand problem that new home incentives can only partially offset.
The double-downgrade is particularly notable because homebuilders had been one of the few sectors where analyst consensus remained constructive well into 2026. The thesis had been that limited existing home inventory — homeowners 'locked in' by low-rate mortgages — would redirect demand toward new construction. Seaport's note challenges that logic, arguing that at current price points, the typical buyer simply cannot qualify, and that incentive spending is eroding builder margins without meaningfully stimulating volumes.
What to watch: This morning's session in LEN and PHM will test whether institutional holders agree with Seaport's bearish case. The SPDR S&P Homebuilders ETF (XHB) will be a useful real-time sentiment gauge.
FED WATCH: April Hold Locked In; June Is the Real Question
With the April 28-29 FOMC meeting just under two weeks away, CME FedWatch pricing shows approximately 85% probability of no change to the 3.50%-3.75% target range established following late 2025 cuts. March CPI data — which printed slightly above expectations — has effectively closed the door on any near-term easing, and several Fed officials have echoed this view in recent speeches, citing the need for 'further evidence of disinflation' before adjusting policy.
The more meaningful question is June. The June 16-17 meeting carries 55-60% odds of a 25bp reduction in Fed funds futures markets. If today's oil price collapse proves sustained — shaving meaningful basis points from near-term headline CPI projections — the disinflation narrative gets a meaningful boost. Conversely, if the Iran situation deteriorates and oil retraces, the inflation picture becomes murkier and June odds will drift lower. The Fed is essentially hostage to a geopolitical situation that neither its models nor its communications framework were designed to navigate.
What to watch: Fed officials scheduled to speak next week before the pre-meeting blackout period. Any hawkish commentary would push June odds back below 50% and reprice the front end of the Treasury curve.
BANKS IN FOCUS: Regional Lenders Report as Credit Quality Holds — For Now
Friday is a marquee day for regional banking earnings, with Truist Financial (TFC), Fifth Third (FITB), Regions Financial (RF), Ally Financial (ALLY), and State Street (STT) all reporting. The sector has had a complex 2026: rising provisions for credit losses, compressed net interest margins as the rate cycle plateaued, and — unlike the money-center banks — relatively limited revenue diversification into investment banking fees that surged on renewed deal activity. Truist faces particular scrutiny, with analysts watching for any deterioration in the commercial real estate portfolio that management has previously flagged as a risk area. State Street, by contrast, should benefit from elevated market volatility driving custody and trading revenue.
What to watch: Provision expense guidance for Q2 will be the most market-moving disclosure. Any guidance cut driven by credit quality concerns could ripple across the regional banking sector.
4. MACRO & FED WATCH
The Federal Reserve's current stance can be summarized in two words: constructive patience. Having cut rates three times in late 2025 to bring the fed funds target to 3.50%-3.75%, the FOMC has since paused, watching as inflation proved stickier than the 2025 dot plot implied. Core PCE — the Fed's preferred inflation gauge — is running at approximately 2.7%, above the 2% target and above the year-end projection of 2.5% embedded in the March dot plot.
The March FOMC minutes, released last month, revealed a committee wrestling with dual uncertainties: resilient labor markets that argue against further easing, and a geopolitical shock to energy prices that temporarily lifted inflation but is now reversing sharply. Thursday's oil price collapse — if it holds — could remove 30-40 basis points from annualized headline CPI over the following two months. That would be a meaningful change, potentially allowing the Fed to characterize inflation as 'returning to target' rather than 'sticky.'
The yield curve has been steepening modestly. The 10-year Treasury sits at 4.31% while the 2-year is near 4.01%, producing a 10Y-2Y spread of approximately 30 basis points — a far cry from the deeply inverted curve of 2023-2024, and consistent with a market that believes the Fed's next move is a cut rather than a hike. The 30-year bond at roughly 4.60% reflects ongoing concerns about fiscal trajectory and long-duration supply. The DXY's weakness (down 4.2% YTD to 97.70) is providing a de facto easing of financial conditions even without formal rate cuts — another factor the Fed will be watching with some concern.
Looking at rate expectations: the base case reflected in futures is one cut in 2026 (June, 55-60% probability), with a second possible if data cooperates. The Fed's own dot plot from March showed only one cut as the median projection. A significant divergence between market pricing and Fed communication would represent a risk to both equities and credit.
5. ECONOMIC CALENDAR — TODAY (APRIL 17, 2026)
Note: The key housing starts and building permits data release has been rescheduled by the Census Bureau to April 29, 2026. Today is relatively light on scheduled US economic data.
Time (ET)
Indicator
Prior
Consensus
Why It Matters
8:30 AM
Housing Starts (Mar) — RESCHEDULED
—
—
POSTPONED to Apr 29; Census Bureau delay
8:30 AM
Building Permits (Mar) — RESCHEDULED
—
—
POSTPONED to Apr 29; key for housing supply outlook
12:45 PM
NY Fed Staff Nowcast (Weekly)
—
—
Real-time GDP tracking; watch for Q1 print signal
1:00 PM
Baker Hughes Rig Count (Weekly)
486
~490
Signals near-term oil/gas supply intentions
6. EARNINGS WATCH
Today's earnings slate is dominated by regional banks, providing the clearest read yet on credit health in the real economy after a period of elevated geopolitical uncertainty. With 22 companies reporting today, the financial sector commands the most attention — but Ericsson offers a useful window into global 5G capex trends, and Autoliv will speak to the health of the global auto supply chain.
Ticker
Company
EPS Est.
Rev. Est.
Prior EPS
Focus
STT
State Street
$2.62
$3.66B
$2.41
Fee revenue growth; AUM flows in volatile mkt
TFC
Truist Financial
$1.00
$5.17B
$0.89
NIM trajectory; expense discipline
FITB
Fifth Third Bancorp
$0.47
$2.85B
$0.94*
Credit quality; commercial loan demand
RF
Regions Financial
$0.60
$1.92B
$0.55
Rate sensitivity; mortgage banking
ALLY
Ally Financial
$0.94
$2.15B
$0.88
Auto loan credit; delinquency trends
ALV
Autoliv
$1.80
$2.61B
$1.71
Auto production volumes; FX impact
ERIC
Ericsson
$0.13
$5.72B
$0.10
5G capex recovery; NA market share
BMI
Badger Meter
$1.22
$230.9M
$1.08
Water infrastructure demand; backlog
Q1 2026 earnings season context: With roughly 45% of S&P 500 companies having reported, the blended earnings growth rate sits at approximately +8.2% year-over-year, above the +6.1% consensus estimate that prevailed at the start of the season. Revenue growth is tracking at +4.8%. The key beat rate — companies exceeding EPS estimates — sits at 73%, modestly below the 5-year average of 77%, but solid given the macro backdrop. Financial sector results have been the primary source of disappointment, while technology and healthcare have exceeded.
7. SECTOR SPOTLIGHT
Energy: The Great Oil Unwinding
The energy sector faces its most volatile single session of the year as the Hormuz news triggers forced selling across the complex. E&P companies — which had been pricing in sustained $90+ Brent for capital allocation purposes — now face a rapid re-rating. Offshore drillers, whose order books had filled at elevated day-rates premised on structurally tight supply, are in a particularly difficult position. The XLE Energy Select Sector ETF will almost certainly be the worst-performing sector ETF on the day. The key question is whether today's move represents a complete repricing of risk or merely an initial shock that moderates as the physical market catches up to futures. OPEC+ will be closely watching — their credibility in managing the price floor is now directly tested.
Financials: Regional Banks Under the Microscope
Regional banks enter Q1 reporting season with significant uncertainty hanging over credit quality, particularly in commercial real estate and consumer lending. The macro environment — rates that have paused at levels still restrictive relative to history, moderating but persistent inflation, and a labor market that has been resilient — has been a mixed bag for net interest margins. Banks that funded long-duration assets with short-duration liabilities during the 2020-2021 era are still working through the consequences. State Street, which derives revenue from custody, asset management, and trading rather than traditional lending, may be the relative standout today given elevated market volatility's positive effect on fee income.
XOM / CVX — Energy Majors: A Forced Capitulation Trade?
With WTI crashing 12%, Exxon Mobil (XOM) and Chevron (CVX) will open sharply lower. Both trade at valuations that assumed $85-90 Brent for extended periods. XOM has been particularly active in the Permian, with capex plans that assumed higher sustained pricing. The key level to watch: XOM's 200-day moving average near $108; if it breaks below, technical selling could accelerate. Options markets are implying single-day moves of 4-6% for both names — significant for mega-cap energy. Longer-term investors may see this as an entry point if they believe oil finds support at current levels; short-term momentum traders will likely stay away until the dust settles.
Mizuho's move from Outperform all the way to Underperform on NXP Semiconductors — skipping Neutral entirely — is aggressive and noteworthy. The new $188 target implies roughly 20% downside from Thursday's close. The core thesis is that NXP's exposure to automotive and industrial end markets — which together account for more than 80% of revenue — leaves it vulnerable as auto production volumes remain below pre-COVID highs and OEM inventory destocking continues. This is a meaningful call given NXP's positioning as a bellwether for the automotive semiconductor cycle. Watch whether other semiconductor analysts follow with comparable actions.
GLD / SLV — Gold and Silver ETFs: Monitoring the Safe-Haven Premium
Gold at $4,867 is pricing in something more complex than pure Iran-war fear premium — it reflects structural dollar skepticism, central bank diversification demand, and concerns about U.S. fiscal trajectory. The SPDR Gold Trust (GLD) has seen substantial inflows year-to-date. The interesting question today: does gold hold its gains as risk sentiment improves and the oil price relief trade plays out? Historically, gold has shown resilience in post-crisis rallies when real yields remain compressed — which is the current configuration. Watch the 10-year TIPS yield; if it rises materially, gold faces a headwind.
LEN / PHM — Homebuilders: Do You Trust Seaport's Bear Case?
The Seaport Global double-downgrade creates an interesting test of market conviction in the homebuilder thesis. Lennar (LEN) has been one of the better-capitalized builders, with a balance sheet that can sustain elevated incentive spending. PulteGroup (PHM) has historically had stronger execution on cost control. If today's market reaction is severe — LEN breaking below $100, PHM below $110 — it would suggest institutional holders are taking Seaport's bearish case seriously. An options straddle on either name heading into next quarter's earnings could be worth examining given the elevated uncertainty.
10. GLOBAL MACRO SNAPSHOT
China: The mainland CSI 300 slipped only 0.17% on Friday, reflecting a relative insulation from the Iran news compared to energy-exposed markets. Beijing has been a net beneficiary of the conflict — having maintained informal diplomatic channels with both sides — and lower oil prices directly reduce import costs for the world's largest crude importer. Watch for any policy response to the yuan's modest strengthening; the PBOC has been managing USD/CNY carefully near 7.20.
Europe: UK GDP surprised to the upside with 0.5% month-on-month growth in February versus a 0.1% consensus — providing a meaningful tailwind for the FTSE and GBP. Eurozone inflation printed at 2.6% for March, slightly above the 2.5% estimate, keeping the ECB in a 'data dependent' posture that mirrors the Fed. European energy companies face the same Hormuz-driven headwinds as their U.S. counterparts, but European manufacturers and consumers are among the biggest structural beneficiaries of lower oil prices given the region's import dependency.
Japan: The Nikkei's 1.75% pullback from record highs reflects both profit-taking and yen strengthening — the classic inverse correlation that has defined Japanese equities for decades. USD/JPY at 143.5 (down 0.6% on the day) is tightening financial conditions for Japan's export-oriented economy. The Bank of Japan will be watching carefully; any rapid yen appreciation could complicate its gradual normalization path.
Emerging Markets: The oil price collapse is a meaningful positive for oil-importing emerging market economies — India, Turkey, and South Korea among the largest beneficiaries. Oil-exporting EMs (Saudi Arabia, UAE, Nigeria) face the opposite dynamic. Currency stability in LATAM, which had been pressured during the conflict, should improve on the Hormuz news.
11. WEEK AHEAD PREVIEW
The week of April 20-25 brings several significant catalysts. On the earnings front, the mega-cap technology earnings parade begins in earnest, with Alphabet, Tesla, and Meta all expected to report. These names together account for roughly 15% of S&P 500 market cap and will be the ultimate test of whether the current rally is supported by fundamental earnings quality or purely by the geopolitical sentiment shift.
On the economic data front, the March PCE deflator — the Fed's preferred inflation gauge — is expected on Friday, April 25. Given the Iran oil price shock that unfolded this week, the March reading (which precedes the Hormuz announcement) will be interesting context but not the most forward-looking signal. The more important read will come in May PCE, which will capture the full disinflationary impact of lower energy prices.
Geopolitically, President Trump's indication that in-person U.S.-Iran negotiations could occur 'next weekend' creates a potential binary event. A successful meeting producing a formal framework for ceasefire compliance would be additionally risk-positive; a breakdown would immediately reverse the oil relief trade. Keep a close eye on tanker tracking data — whether ships are actually transiting the Strait — as the real-world validation of the Hormuz announcement.
Additionally, the FOMC pre-meeting blackout period begins Saturday, April 19. Any Fed communication before then — particularly from Chair Powell or Vice Chair Jefferson — will receive heightened scrutiny for signals on the June meeting.
12. CLOSING THOUGHT
Here is the contrarian view worth holding in your head today: this market is priced for a resolution that has not been legally or verifiably confirmed. The Strait of Hormuz 'open' announcement came from Tehran, not from a jointly signed agreement between the United States and Iran. The U.S. blockade — which is the other side of the same coin — remains formally in place per the White House. In the history of geopolitical markets, the most dangerous trades are those that price in peace before peace actually exists.
The Nasdaq's 12-day streak and the S&P 500's burst above 7,000 are genuinely impressive achievements. But a market up 8% in two weeks on the back of war de-escalation talks is a market with asymmetric downside to any negative headline. Gold at $4,867 is telling you that not everyone believes the story. The S&P 500 at 7,041 is telling you that most people do. The resolution of that tension — between the skeptics and the optimists — will define the next chapter of this remarkable market cycle.
In markets, hope is a terrible strategy. But so is fighting a trend with 12 straight days of confirming data behind it.
Sources: CNBC, Yahoo Finance, Reuters, Fortune, TheStreet, IC Markets, FedWatch (CME), Benzinga, Seaport Global, Mizuho, JP Morgan, Goldman Sachs, Wikipedia (2026 Iran war). This brief is for informational purposes only and does not constitute investment advice.
THE MORNING BRIEF
Monday, April 20, 2026 · Pre-Market Edition · ~10-Minute Read
1. THE MORNING SETUP
Markets open Monday on edge. After a spectacular week that saw the S&P 500 surge 4.54% to fresh all-time highs and the Nasdaq post a blistering 6.84% weekly gain — both indexes roaring back from Iran-war-induced lows — futures are retreating this morning as geopolitical uncertainty refuses to fully clear. The catalyst: Brent crude's overnight snap-back of more than 5%, reversing part of last week's 10% plunge that followed Iran's announced Strait of Hormuz reopening, suggests the market got ahead of itself pricing in a clean ceasefire. The central question this week is whether the Middle East de-escalation narrative holds — and whether corporate America's first-quarter earnings season can sustain the rally's fundamental underpinning.
Against that backdrop, investors face a blockbuster earnings slate: Tesla reports Wednesday, headlining a week that also features UnitedHealth, GE Aerospace, Boeing, Alphabet, Meta, and PepsiCo. Economic data is dense too, with Flash PMIs, Durable Goods, and the final Michigan Consumer Sentiment reading all due. The Fed is in pre-meeting quiet mode — FOMC blackout begins Saturday, with the April 28-29 meeting approaching fast. One rate cut is priced for 2026. Gold remains at record highs above $4,870/oz. Bitcoin sits below $76K. The week is loaded. Buckle up.
2. MARKETS AT A GLANCE
All major data as of market open / last available print. Change figures are vs. prior session unless noted.
Instrument
Price / Level
Day Chg
YTD / Trend
Note
── US EQUITIES ──
S&P 500 (prior close)
7,126.06
+1.20%
ATH week
Fresh record last week
Dow Jones (prior close)
49,447
+1.79%
+3.19% wk
3rd consec weekly gain
Nasdaq 100
~24,800 est.
+1.60%
+6.84% wk
New record highs
S&P 500 Futures (Mon)
~7,100 est.
-0.80%
—
Geopolitical jitters
Dow Futures (Mon)
~48,950 est.
-1.00%
—
Iran uncertainty
Russell 2000
~2,100 est.
+0.90%
Lagging
Small-cap cautious
VIX
~18 est.
Elevated
>15 = caution
Geopolitical risk premium
── ASIA (Mon close) ──
Nikkei 225
58,475.90
-1.75%
Near ATH
Iran concerns weigh
Hang Seng
26,160.33
-0.89%
Mixed
HK-China sentiment
Shanghai Composite
~3,280 est.
-0.50%
Flat YTD
Policy support watch
Kospi (S.Korea)
~2,580 est.
-0.70%
—
Export data sensitivity
ASX 200
~8,100 est.
+0.40%
Resilient
Commodities tailwind
── EUROPE (early trade) ──
FTSE 100
10,667.63
+0.73%
Outperforming
Energy cos. rally
DAX (Germany)
~22,200 est.
+0.30%
Near highs
Export concern
CAC 40 (France)
~7,950 est.
+0.40%
Range-bound
Luxury watch
Euro Stoxx 50
~5,300 est.
+0.35%
—
Broad Europe
── US TREASURIES ──
2-Year Yield
3.81%
-2 bps
Below 4%
Pricing ~1 cut 2026
5-Year Yield
~4.05% est.
Flat
—
Mid-curve
10-Year Yield
4.31%
+1 bp
Key 4.25-4.50 range
Spread 2Y-10Y: +50bp
30-Year Yield
4.91%
+2 bps
Near 5%
Long-end under pressure
── CURRENCIES ──
DXY (Dollar Index)
98.31
+0.21%
Below 100
Below 52wk high 101.98
EUR/USD
~1.150
-0.15%
Off 1.20 highs
US-DE spread 159bp
GBP/USD
~1.32 est.
Flat
—
UK data dependent
USD/JPY
~148 est.
+0.30%
BOJ watch
Intervention risk?
USD/CNY
~7.25 est.
Flat
—
PBOC managed
── COMMODITIES ──
WTI Crude Oil
$86.25/bbl
+5.85%
Volatile
Hormuz reopening → rebound
Brent Crude
$95.42/bbl
+5.58%
Volatile
Iran ceasefire uncertainty
Natural Gas
~$3.20 est.
+1.50%
—
LNG demand
Gold (spot)
$4,878/oz
+0.80%
+25% YTD
Record high territory
Silver
~$49 est.
+1.10%
Lagging gold
Industrial/haven
Copper
~$4.65/lb est.
+0.60%
Global growth proxy
China demand key
── CRYPTO ──
Bitcoin (BTC)
$75,324
-1.20%
Off highs
Iran tensions weigh
Ethereum (ETH)
~$1,850 est.
-0.90%
Market cap $233B
Layer-2 watch
3. TOP STORIES
🛢 Story 1 — The Hormuz Whipsaw: Oil's Violent Two-Act Drama
Last week's single most important macro development was the partial reopening of the Strait of Hormuz, the 21-mile-wide chokepoint through which roughly 20% of global oil supply flows. Iran's Foreign Minister Abbas Araghchi announced the waterway was fully open to commercial traffic during the ceasefire period, triggering a historic single-session crude collapse — Brent fell nearly 10% to approach $85/barrel, its largest one-day drop in over a decade. WTI briefly touched $78.50 before recovering. Equity markets exploded higher on the inflation-relief read: lower energy prices mean less pressure on consumers, more room for the Fed to cut, and improved corporate margin profiles for transport and manufacturing industries.
But this morning tells a different story. Brent has rebounded to $95.42, up more than 5.5%, suggesting traders are not yet convinced the ceasefire is durable. The IEA's April report noted global oil supply had plummeted by 10.1 mb/d to 97 mb/d in March — the largest disruption in history — and warned that tail risks remain severe if the Strait closes again. With US-Iran talks described as 'fragile' and no formal peace framework in place, oil markets are effectively pricing event risk in real time. Energy sector stocks, which led last week's equity surge, face whipsaw risk as headline risk persists.
What to watch: Any diplomatic communiqué from Washington or Tehran. Oil's ability to hold below $100/bbl on Brent is crucial to the inflation narrative. An EIA inventory report Wednesday will be closely scrutinized.
🏦 Story 2 — The Fed's Tightrope: Inflation, Oil, and the April 28-29 FOMC
The Federal Reserve held the federal funds rate at its 3.50%-3.75% target range at the March 17-18 FOMC meeting — its second consecutive hold. But the meeting minutes reveal a committee walking a genuine tightrope. Participants broadly acknowledged that inflation 'remained above the Committee's 2% longer-run goal' and that 'further progress in reducing inflation had been absent in recent months.' More concerning for doves: the vast majority of participants flagged that upside risks to inflation have increased, with Middle East-driven energy price spikes cited explicitly as the mechanism.
The Fed's dot plot still calls for one rate cut in 2026, with another in 2027. Markets are pricing this roughly at face value, with the 2-year Treasury yield at 3.81% and the 10-year at 4.31% — a roughly 50-basis-point positive spread suggesting the yield curve has re-normalized from its prolonged inversion. The FOMC blackout period begins this Saturday, meaning no Fed speakers for the next 9 days. The April 28-29 meeting is widely expected to be another hold — but Chair Powell's press conference language around the inflation trajectory and the impact of Middle East supply shocks on the 2026 rate path will be the market's primary focus.
What to watch: Whether oil's Monday rebound changes the calculus. A sustained Brent above $95 would likely push the Fed's first cut further into the calendar — potentially to Q4 or 2027.
⚡ Story 3 — Tesla's Earnings Gauntlet: Deliveries Missed, But Is the Story Still Intact?
Tesla (TSLA) reports Q1 2026 earnings Wednesday after market close, and the setup is uniquely complex. The company delivered 358,023 vehicles in Q1, a 6.3% year-over-year improvement but a miss versus the analyst consensus of 365,645. More troubling was energy storage, where Tesla deployed just 8.8 GWh — a 38% sequential collapse from Q4 2025's 14.2 GWh, and dramatically below the 14.4 GWh consensus. Bears argue this signals execution problems; bulls counter that Q4 energy figures are seasonally strong and that Q2 will rebound.
The EPS consensus is approximately $0.33-$0.37 on revenue of roughly $21.4-$22.7 billion (estimates vary by firm). But the street's real focal points are the gross margin trajectory — which collapsed in prior quarters on aggressive pricing — Elon Musk's capacity to focus on the business amid his Washington commitments, and the robotaxi timeline. Goldman Sachs reiterated a Buy with a $320 price target specifically citing underappreciated energy storage optionality. The options market is pricing a roughly 9-11% implied move around the print. The stock's year-to-date trajectory and elevated short interest make this a high-volatility event.
What to watch: Margin guidance, energy storage Q2 outlook, and any commentary on Musk's involvement level in day-to-day management.
📉 Story 4 — Adobe's AI Identity Crisis: Innovator or Incumbent Under Siege?
Adobe (ADBE) is trading at approximately $240, down 34% over the past 12 months, and Monday's Motley Fool live coverage flagged it as a key story. The core tension: Adobe's Firefly AI creative suite is showing genuine traction — Firefly subscription and credit pack ARR grew 75% sequentially — yet the stock is treated like a melting ice cube by institutional investors fearful of disruption from Microsoft, OpenAI, Midjourney, and Canva. Management has guided for annualized recurring revenue growth of 10.2% for fiscal 2026 and reports Acrobat AI Assistant, Firefly App, and GenStudio have collectively generated over $125 million in revenue.
The analyst community is split. Morgan Stanley has reportedly downgraded to Equal Weight with a $260 target, citing intensifying AI competition and a valuation that remains stretched relative to the growth profile. The current median Wall Street target is $317 — well above the current price — suggesting deep disagreement about terminal value. The practical risk is that Adobe's creative moat is being 'salami-sliced' by free AI tools, while its enterprise Document Cloud faces pressure from cheap PDF alternatives. The company is neither cheap nor clearly safe — a genuinely difficult investment thesis.
What to watch: Q2 guidance revision and whether management upgrades Firefly monetization targets. Any partnership announcements with enterprise platforms could shift sentiment.
🌏 Story 5 — China's Economic Wobble and the Global Growth Transmission
While the Iran conflict dominates Western market headlines, China's economic situation deserves close attention. Shanghai Composite has been roughly flat YTD, reflecting a market that is neither in crisis nor recovering with conviction. Recent PBOC policy support — targeted rate cuts and liquidity injections — has stabilized financial conditions but has not catalyzed broad animal spirits. Property sector stress persists, with several major developers still navigating restructuring processes. Export growth has been complicated by supply chain rerouting around the Gulf disruption zone.
For global markets, China matters in two critical ways: first, as the marginal demand driver for copper, iron ore, and industrial commodities — where a Chinese recovery would provide significant upside; and second, as a potential shock absorber if US consumer strength falters. Goldman Sachs' most recent China outlook flags 'cautious stabilization' with GDP growth tracking around 4.3% for 2026, below the official 5% target. The risk is that US-China trade tensions — never fully resolved — flare again as Beijing watches Washington's Middle East engagement and draws its own strategic conclusions.
🏥 Story 6 — UnitedHealth Under the Microscope: Healthcare Earnings Season Kicks Off
UnitedHealth Group (UNH) reports Q1 2026 results Tuesday morning before the open, and the print carries outsized significance for the entire healthcare sector. Analysts project non-GAAP EPS of approximately $6.62-$6.67, representing a year-over-year decline — reflecting the ongoing normalization of medical loss ratios (MLR) after the pandemic-era suppression of care utilization. The company's revenue is estimated at approximately $109.74 billion, reflecting scale that makes UNH effectively a macroeconomic entity in its own right — its claims data is a leading indicator of consumer health and healthcare inflation.
JPMorgan has an Overweight rating with a $620 price target, arguing that MLR normalization is now in the price and that a positive Q1 surprise could be the catalyst for a re-rating. The broader healthcare sector has underperformed the S&P 500 in 2025 amid regulatory scrutiny of pharmacy benefit managers and prior authorization practices — both policy headwinds that have weighed on the group. A beat-and-raise from UNH would likely lift the entire managed care complex. A miss would confirm the bears' thesis that medical cost trends remain structurally elevated.
4. MACRO & FED WATCH
The Federal Reserve's posture entering the April 28-29 FOMC meeting can be summarized in one word: patience. After cutting rates three times in 2025 — bringing the target range from 4.75%-5.00% down to the current 3.50%-3.75% — the Fed has been on hold for two consecutive meetings. The rationale is clear from the minutes: core PCE inflation remains above 2.5%, the labor market has softened but not broken, and the Middle East shock represents a genuine 'stagflationary supply shock' that the Fed is ill-equipped to address with rate cuts without risking an inflation re-acceleration.
Fed funds futures are currently pricing approximately one full 25 basis-point cut for 2026, with the market heavily weighing Q3 as the most likely timing window. The 2-year Treasury at 3.81% is essentially pricing 'one-and-done' for 2026. The 10-year at 4.31% and the 30-year at 4.91% suggest the bond market is increasingly worried about long-run fiscal sustainability — a legitimate concern given the Congressional Budget Office's persistent deficit projections exceeding $2 trillion annually.
The yield curve at 2Y/10Y +50 basis points represents a significant normalization from the prolonged inversion that characterized 2023-2024 and was widely (though imperfectly) flagged as a recession signal. The steepening reflects two forces: short rates declining as the Fed cuts, and long rates rising as term premium returns to the market. This dynamic is historically positive for bank net interest margins but complicates the valuation calculus for long-duration assets like growth equities and real estate investment trusts. FOMC blackout begins Saturday April 26 — markets will trade without Fed speaker guidance for the final stretch before the decision.
5. ECONOMIC CALENDAR — WEEK OF APRIL 20-24, 2026
All times Eastern. Prior figures reflect last release. Consensus from Bloomberg survey.
Day
Indicator
Time (ET)
Prior
Consensus
Why It Matters
Mon 4/20
No major US data releases
—
—
—
Quiet open to busy week
Tue 4/21
Existing Home Sales (Mar)
10:00 AM
4.26M
4.15M est.
Housing demand vs rates
Tue 4/21
Leading Economic Index (Mar)
10:00 AM
-0.3%
-0.2% est.
6-month recession indicator
Tue 4/21
Richmond Fed Mfg Index (Apr)
10:00 AM
-4
0 est.
Mid-Atlantic factory health
Wed 4/22
New Home Sales (Mar)
10:00 AM
676K
660K est.
Builders vs buyers signal
Wed 4/22
S&P Global Flash PMIs (Apr)
9:45 AM
Mfg 51.9/Svc 54.4
Mfg 51.5/Svc 53.8 est.
Real-time activity snapshot
Wed 4/22
EIA Crude Oil Inventories
10:30 AM
-2.6M bbls
—
Supply/demand; oil price driver
Thu 4/23
Initial Jobless Claims
8:30 AM
215K
220K est.
Labor market health check
Thu 4/23
Durable Goods Orders (Mar)
8:30 AM
-0.8%
+0.5% est.
Capital investment signal
Thu 4/23
Chicago Fed Activity Index
8:30 AM
-0.09
—
Broad national economy
Fri 4/24
UofM Consumer Sentiment (Final)
10:00 AM
57.9 prel.
58.0 est.
Inflation expectations embedded
6. EARNINGS WATCH
Q1 2026 earnings season is accelerating rapidly. With financials already largely through the tape, this week shifts focus to industrials, healthcare, technology, and consumer names — a broad cross-section that will provide the market's most comprehensive real-economy read since the Middle East shock disrupted supply chains in March.
Tuesday, April 21
UnitedHealth Group (UNH) — Before open. Est. EPS $6.62-$6.67 non-GAAP; revenue $109.74B. Key focus: medical loss ratio trajectory, prior authorization policy impacts, and 2026 full-year guidance revision. Options-implied move: ~5%.
GE Aerospace (GEV) — Before open. Expect record aftermarket revenue commentary. LEAP engine demand from narrowbody aircraft recoveries remains BofA's thesis for a $285 target. Strong international travel demand is the tailwind.
RTX (Raytheon Technologies) — Before open. Defense spending is a beneficiary of Middle East tensions. Watch for Pratt & Whitney engine service revenue update and any defense procurement commentary.
Wednesday, April 22
Tesla (TSLA) — After close. Est. EPS $0.33-$0.37 GAAP; revenue $21.4-$22.7B. Delivered 358K vehicles in Q1 vs. 365K consensus. Critical: gross margin guidance, energy storage rebound, Musk management commentary, and robotaxi milestones. Options-implied move: 9-11%. A high-stakes print for the EV sector.
Boeing (BA) — Before open. Barclays downgraded to Equal Weight on delivery ramp concerns. Q1 737 MAX deliveries vs. FAA-constrained production rates will be the headline metric. Cash burn remains a structural concern.
AT&T / IBM — Both report Wednesday. AT&T's fiber net adds and free cash flow conversion are key. IBM's software and consulting revenue mix will test the 'transformation complete' narrative.
Thursday, April 23
Alphabet (GOOGL) — After close. The big tech avalanche begins. Expect focus on Google Cloud growth acceleration, AI search monetization, and YouTube advertising. Consensus: ~$2.01 EPS, $89.7B revenue.
Meta Platforms (META) — After close. Advertising revenue resilience despite Iran-related geopolitical uncertainty. Threads user growth, Llama AI commercialization, and Reality Labs losses are secondary watch items.
PepsiCo (PEP) — Before open. Consumer staples bellwether. Pricing power vs. volume elasticity in a high-inflation environment will set the tone for the broader consumer staples sector.
7. SECTOR SPOTLIGHT
Energy — The Whipsaw Sector
No sector better captures the current market's schizophrenia than Energy. Last week, the S&P 500 Energy sector surged as oil plunged — the market interpreting lower crude as an inflation-relief mechanism that would buoy the broader economy and therefore lift all sectors, including energy equities paradoxically via multiple expansion. This week, as crude rebounds, the energy sector faces more conventional tailwinds: higher realized prices improve cash flows and shareholder return programs for integrated majors like ExxonMobil (Citi Buy, $135 target) and Chevron. However, sustained Brent above $95 would reintroduce the inflation risk premium, potentially capping equity multiple expansion in rate-sensitive sectors. The sector remains the market's highest-volatility geopolitical barometer.
Healthcare — Earnings-Season Crucible
The healthcare sector enters earnings week as one of 2025's notable underperformers, having lagged the S&P 500 by several percentage points amid regulatory noise around PBMs and managed care. UnitedHealth's Tuesday print is the sector's defining moment. If UNH guides conservatively on MLR and mentions persistent headwinds, expect the entire managed care complex — Humana, CVS Health, Elevance — to reprice lower. The opposite scenario — a clean beat with MLR normalization commentary — could trigger a significant sector rotation into healthcare from momentum-driven technology names. With valuations at multi-year lows relative to the broader market, the risk/reward for a positive surprise is asymmetric.
Notable analyst actions from Friday's close through Monday's pre-market.
Firm
Stock
Action
New Target
Rationale
Morgan Stanley
ADBE (Adobe)
Downgrade → Equal Weight
$260
AI competition intensifying; valuation rich vs. growth profile
Goldman Sachs
TSLA (Tesla)
Reiterate Buy
$320
Energy storage upside underappreciated; robotaxi optionality
JPMorgan
UNH (UnitedHealth)
Overweight
$620
MLR normalization ahead; re-rating catalyst post Q1 print
Barclays
BA (Boeing)
Overweight → Equal Weight
$195
Delivery ramp risks; macroeconomic order book exposure
BofA
GE Aerospace (GEV)
Buy
$285
Record aftermarket demand; LEAP engine cycle in full swing
Citi
XOM (ExxonMobil)
Buy
$135
Brent above $90 supports FCF; Guyana ramp-up on track
Deutsche Bank
NVDA (Nvidia)
Buy
$1,100
Data center capex cycle intact; supply normalizing
Wells Fargo
AMZN (Amazon)
Overweight
$270
AWS reacceleration; advertising beats persist
9. STOCKS TO WATCH
Tesla (TSLA) — Earnings Catalyst Wednesday
Tesla enters Wednesday's print with a nuanced setup: the delivery miss is known (358K vs. 365K est.), but the options market is pricing a 9-11% swing — unusual asymmetry suggesting the street believes the real surprise will come from margin guidance and forward commentary rather than the backward-looking delivery number. Bears point to continued Musk distraction risk and the energy storage miss. Bulls point to a potential robotaxi announcement or timeline pull-forward. Key technical levels: $240 support, $280 resistance. A clean print above consensus could push toward $300. A miss with weak guidance could retest $200. High-conviction volatility trade; not for the faint-hearted.
ExxonMobil (XOM) — Oil's Rebound Beneficiary
With Brent snapping back above $95 Monday morning, XOM is the cleanest expression of the oil-price-rebound thesis. Citi's Buy with a $135 target cites Guyana production ramp-up and a $15 billion-plus annual free cash flow generation capacity at current prices. XOM yields roughly 3.4% and has buyback authorization in place. If Brent sustains above $90, XOM's 2026 EPS estimates are likely to see upward revisions through earnings season. Key watch: Tuesday's Q1 print will reveal actual realized prices and whether Guyana volumes are tracking to plan.
UnitedHealth (UNH) — Binary Tuesday Print
Few stocks have more binary event risk this week than UNH. The stock has been a serial disappointment for managed care investors, with prior quarters revealing elevated MLR driven by post-pandemic care utilization normalization. The consensus non-GAAP EPS at $6.62-$6.67 already embeds a year-over-year decline — meaning the beat bar is low but meaningful. JPMorgan's $620 Overweight thesis requires investors to believe that MLR has peaked. If Tuesday's print confirms that narrative, the stock could rally 7-10% in a single session. If it disappoints again, expect a fresh retest of 52-week lows. This is healthcare's make-or-break moment.
Adobe (ADBE) — Structural Bear Case Emerging
ADBE's valuation at ~$240 represents a 34% collapse from prior highs, yet bulls argue it's still not cheap at roughly 20x forward earnings given the AI competitive threat. Morgan Stanley's reported downgrade crystallizes a debate that has been building for 18 months: is Adobe a compound-growth software story leveraging its creative moat through AI, or an incumbent being disrupted by free-tier generative AI tools? Firefly's 75% sequential ARR growth is impressive but comes off a small base. The medium-term risk is 'boiling frog' displacement — customers gradually reducing seat counts as AI tools reduce headcount requirements. No near-term catalyst; monitoring for Q2 guidance.
10. GLOBAL MACRO SNAPSHOT
China: PBOC policy support has prevented a hard landing but hasn't catalyzed the recovery that global commodity markets are hoping for. Property sector stress persists. GDP tracking ~4.3% for 2026 vs. 5% official target. Copper prices at ~$4.65/lb reflect cautious optimism — not exuberance. Watch for April PMI data and any Politburo policy signaling around fiscal stimulus.
Europe: The FTSE 100's Monday outperformance (+0.73%) is driven by the energy-heavy composition of the index and currency dynamics (a weaker pound lifts dollar-denominated commodity revenues). European growth remains fragile — Germany, the continent's engine, faces export headwinds from both US tariff uncertainty and slowing Chinese demand. ECB has been cutting ahead of the Fed; EUR/USD has retreated from 1.20+ to ~1.15, reflecting the divergence in growth and rate trajectories.
Emerging Markets: The Strait of Hormuz reopening has provided relief for oil-importing EMs like India and Turkey, whose current accounts were under severe pressure with Brent above $100. India's equity market has been one of 2026's outperformers on the back of domestic demand resilience. Brazil faces commodity crosscurrents — lower oil hurts Petrobras, but iron ore prices have held up on China supply-demand dynamics. South Korea (Kospi -0.70% Monday) reflects semiconductor supply chain sensitivity and export exposure to China.
Gold at $4,878/oz (record) is the clearest signal of the macro unease underpinning the surface-level equity rally. Central bank buying — led by China, India, and Turkey — has been structural and non-cyclical. Gold's 25%+ YTD gain even as equities have recovered is unusual and historically signals that institutional investors are running meaningful tail-risk hedges alongside their equity positions.
11. WEEK AHEAD PREVIEW
Monday 4/20: Light data; markets focused on Iran ceasefire durability and oil's direction. Pre-earnings positioning for UNH and Tesla.
Tuesday 4/21: UnitedHealth, GE Aerospace, and RTX all report pre-market. Existing Home Sales and Leading Economic Index at 10am. Healthcare and industrials sectors set their Q1 tone.
Wednesday 4/22: Tesla after close — the week's marquee event. Boeing and AT&T before open. New Home Sales and Flash PMIs in the morning. EIA oil inventories at 10:30am — critical given oil's Monday rebound.
Thursday 4/23: Alphabet and Meta after close — Big Tech earnings begin in earnest. PepsiCo, Merck, Southwest, and Union Pacific before open. Durable Goods Orders and Jobless Claims in the morning.
Friday 4/24: Final University of Michigan Consumer Sentiment. Markets will be digesting Alphabet/Meta prints from Thursday night and setting up for the following week's Microsoft, Amazon, and Apple earnings tsunami.
Saturday 4/26: FOMC blackout begins. The Fed goes quiet until after the April 29-30 meeting. This removes a potential source of market communication and puts all attention back on earnings and data.
Key risk: A single geopolitical headline — particularly around Iran ceasefire fragility — could override the entire earnings narrative. Oil above $100/bbl on a sustained basis is the market's most feared scenario: stagflationary, restrictive for the Fed, and negative for corporate margins simultaneously.
12. CLOSING THOUGHT
The market's most dangerous trade right now may be complacency. After a week that produced near-5% S&P gains on Middle East relief, investors are tempted to chase the breakout and declare the geopolitical storm over. History counsels differently. Every major ceasefire in modern oil-market history has produced a sharp commodity decline followed by a partial reversal as implementation realities emerged. The market priced the best case scenario last week — a clean, durable Strait reopening. Monday's crude rebound suggests the world is messier than that.
The more interesting question is whether Gold's relentless record-setting — $4,878 and climbing — is the market's 'tell'. Equities celebrating and gold surging simultaneously is an unusual combination that typically resolves in one of two ways: either equities were right and gold corrects, or gold was right and equities have more pain ahead. With the Fed on hold, oil uncertain, and Q1 earnings carrying the weight of justifying fresh all-time-high valuations, this week's results will do more than just set sector narratives. They may determine which asset class was telling the truth.
— The Morning Brief | April 20, 2026
DAILY FINANCIAL BRIEF
Tuesday, April 21, 2026
1. THE MORNING SETUP
Markets enter Tuesday with a 24-hour geopolitical clock ticking down. The fragile two-week US-Iran ceasefire—brokered by Pakistan on April 8 and barely holding—expires tomorrow, leaving traders to price the probability of a return to open hostilities in the Strait of Hormuz. That narrow chokepoint carries roughly one-fifth of global oil supply. Crude oil rallied to $113/barrel in March after Iran closed the Strait following Operation Epic Fury, only to retreat to $86 on ceasefire optimism. Now, with formal peace talks stalled over the duration of any uranium enrichment freeze—Washington wants 20 years, Tehran insists on five—the market's sanguine read of a quick resolution is being tested.
Into this backdrop come two headline-making events. Apple announced Monday evening that Tim Cook—who transformed the company into a $3 trillion consumer juggernaut over 15 years—will step down as CEO on September 1, handing the reins to John Ternus, the company's hardware engineering chief. And at 10 a.m. ET, Kevin Warsh arrives on Capitol Hill for his Senate Banking Committee confirmation hearing as Donald Trump's nominee to chair the Federal Reserve. His testimony arrives as March CPI accelerated to 3.3% year-over-year, retail sales surprised sharply to the upside, and markets have effectively priced out any 2026 rate cuts. The question investors want answered: will Warsh be Trump's "sock puppet" on rates, or an independent steward of price stability?
2. MARKETS AT A GLANCE
US EQUITIES
INDEX / INSTRUMENT
LEVEL
1-DAY CHG
S&P 500 (Monday Close)
7,109.14
-0.24%
S&P 500 Futures (Tue AM)
~7,136.50
+0.38%
Nasdaq Composite (Mon Close)
24,404.39
-0.26%
Nasdaq Futures (Tue AM)
~24,479
+0.31%
Dow Jones (Tue AM)
+270 pts
+0.50%
Russell 2000 (Tue AM)
—
+0.40%
VIX (Fear Index)
18.87
+7.95%
ASIA-PACIFIC (TUESDAY CLOSE)
INDEX
MOVE
Kospi (South Korea) — Record High
+2.72% → 6,388.47
Nikkei 225 (Japan)
+0.88%
Topix (Japan)
+0.63%
Hang Seng (Hong Kong)
+0.22%
CSI 300 (Mainland China)
marginally lower
ASX 200 (Australia)
flat
MONDAY S&P 500 SECTOR PERFORMANCE
SECTOR
CHANGE
Materials
+0.57%
Financials
+0.34%
Real Estate
+0.27%
Communication Services
-1.41%
FIXED INCOME & FX
INSTRUMENT
LEVEL
NOTE
10Y US Treasury
~4.26%
Recent range: 4.23–4.48%
2Y US Treasury
est. ~4.10%
Curve near flat/slight inv.
DXY (Dollar Index)
97.96
Near 3-yr low on geopolitics
VIX
18.87
+7.95% on day
COMMODITIES & CRYPTO
ASSET
PRICE
CHANGE
WTI Crude Oil
~$86.27/bbl
Down sharply from $113 March peak
Brent Crude
~$88–89/bbl
Est. ~$2 premium to WTI
Gold (Spot)
$4,782/oz
-0.81% day; +43.3% YoY
Bitcoin (BTC)
~$85,000–88,000
Steady amid geopolitical risk
Ethereum (ETH)
~$2,200–2,400
Following BTC tone
Copper
—
Global growth proxy; watch
3. TOP STORIES
STORY 1: The Ceasefire Cliff — Iran Peace Talks Stall With 24 Hours Left
The most consequential event in global markets this week may have nothing to do with earnings season. The US-Iran ceasefire—brokered by Pakistan on April 8 following the launch of Operation Epic Fury on February 28—expires Wednesday. What began as a military campaign involving US and Israeli forces against Iran's nuclear infrastructure triggered Iran's closure of the Strait of Hormuz, routing one-fifth of global oil supply. Crude exploded to $113/barrel in March. Equity markets absorbed the shock better than most expected, with the S&P 500 eventually recovering all 2026 losses within a single dramatic week in April.
The ceasefire itself has been a fragile construct. Iran briefly declared the Strait open on April 17, sending crude tumbling 10%. But by the following day, Tehran reclaimed control after Trump refused to end the US naval blockade of Iranian ports. Then, over the weekend, the US Navy seized an Iranian container ship in the Gulf of Oman—an act Tehran called a provocation.
Formal talks opened April 12, with Vice President JD Vance negotiating with Iranian Foreign Minister Abbas Araghchi. They collapsed almost immediately over uranium enrichment: Washington wanted a 20-year pause; Tehran would accept only five. Monday, Trump told CNBC he expects a "great deal"—but his team has also signaled it is prepared to resume hostilities if talks fail. Markets are priced for a deal; the risk is to the downside if one doesn't materialize. Watch crude closely into Wednesday's expiration.
MARKET IMPLICATION: A breakdown in talks could push WTI back above $100, reignite inflation fears, and materially complicate the Fed's path. Energy stocks would outperform; airlines, consumer discretionary, and industrials would face pressure. WHAT TO WATCH: Any statement from the Iranian Foreign Ministry or White House before Wednesday midnight.
STORY 2: Apple After Cook — The Ternus Era Begins in September
Apple's announcement Monday evening that Tim Cook will transition to Executive Chairman on September 1—with John Ternus, SVP of Hardware Engineering, assuming the CEO role—marks one of the most significant leadership transitions in corporate history. Cook inherited a company in 2011 with a singular product dependency; he delivered a $3 trillion enterprise defined by services, supply chain mastery, and regulatory navigation. Investors took the news in measured stride: Apple shares fell less than 1%.
Ternus, who has run Apple's hardware division since 2020, oversaw the M-series chip transition that decoupled Apple Silicon from Intel dependence—widely regarded as one of the most successful platform migrations in tech history. He is widely respected internally and has deep relationships across Apple's engineering organization. The bull case for Ternus: he is a product-first leader at a moment when Apple's next act—spatial computing, AI integration, and autonomous systems—requires exactly that orientation.
The key risk is the transition itself. Cook provided institutional stability and Washington relationships that proved critical during the tariff and regulatory battles of the past decade. Cook moves to Executive Chairman with a mandate to handle policy engagements globally—suggesting Apple's board is thinking carefully about continuity. MARKET IMPLICATION: Near-term neutral; longer-term, Wall Street will scrutinize whether Ternus can manage the services and financial engineering that drove Apple's multiple expansion under Cook. WHAT TO WATCH: September transition plan details; any early signal on AI strategy from Ternus.
STORY 3: Warsh on the Hill — The Fed's Independence Under the Microscope
Kevin Warsh's confirmation hearing before the Senate Banking Committee is the most consequential monetary policy moment since Jerome Powell was renominated in 2022. Warsh, a former Fed governor and Hoover Institution fellow, is Trump's nominee to replace Powell when his term expires. The central tension: Trump has been vocally lobbying for lower interest rates, and Warsh's critics argue he was selected to deliver them. Warsh is expected to push back hard—he has already stated publicly that the Fed must "stay in its lane" and that he would be "nobody's sock puppet."
The macro context makes his testimony especially fraught. March CPI re-accelerated to 3.3% year-over-year—up sharply from 2.4% in February—driven by an 18.9% surge in retail gasoline prices tied to the Iran conflict. Meanwhile, retail sales in March surged 1.7%, beating expectations comfortably, fueled by larger-than-expected tax refunds and pre-conflict consumer resilience. The Fed's dual mandate is caught between sticky inflation and the risk of a growth slowdown if the Middle East situation deteriorates.
Markets are currently pricing in essentially zero probability of a 2026 rate cut. The 10-year Treasury has traded between 4.23% and 4.48% in recent weeks, with the curve near flat. MARKET IMPLICATION: Any signal from Warsh of dovishness on rates could rally equities and bonds; any hawkish posture on inflation independence could push yields higher. The hearing will be closely watched for any signal on the Fed's reaction function under new leadership. WHAT TO WATCH: Warsh's comments on the Humphrey-Hawkins framework, Fed independence, and his rate-setting philosophy.
STORY 4: UnitedHealth Surges 8% on Blowout Q1 — Health Care Leads Earnings Season
UnitedHealth Group delivered one of the quarter's strongest earnings beats Tuesday morning, with Q1 revenue of $111.7 billion (vs. $109.8 billion consensus) and adjusted EPS of $7.23 (vs. ~$6.62 expected)—a 9.4% beat on the bottom line. The company raised its full-year 2026 adjusted EPS guidance to greater than $18.25/share, up from prior guidance. Shares surged approximately 8% in morning trading.
The medical cost ratio—the metric Wall Street watches most closely for managed care companies—came in at 83.9%, down 90 basis points from Q1 2025, signaling that UnitedHealth is successfully containing medical cost trends. The Optum health services segment continues to grow, and management cited AI-assisted claims processing as a meaningful contributor to cost efficiency. With UnitedHealth representing roughly 8% of the Dow Jones Industrial Average by weighting, its strong results are a significant tailwind for the index.
MARKET IMPLICATION: Health care's strong showing is a positive leading indicator for Q1 earnings season broadly—if the largest managed care company can navigate cost pressures, the bar rises for the sector. WHAT TO WATCH: Wednesday's GE Aerospace results and Thursday's Tesla report will set the tone for industrials and EV sectors respectively.
STORY 5: CPI Re-Acceleration Puts Rate Cuts on Ice
March CPI data, released April 10, delivered an unwelcome surprise: headline inflation re-accelerated to 3.3% year-over-year from 2.4% in February. The culprit was energy—retail gasoline prices surged 18.9% year-over-year, with the national average hitting $4.12/gallon, a direct consequence of Iran's Strait of Hormuz closure. Services inflation ex-energy remained relatively contained at 3% annually, and shelter came in at 3%—a sign that the slow-motion disinflation in housing costs is still proceeding, just masked by energy.
The Fed's March meeting minutes showed policymakers tilted toward a modest rate reduction at some point, but that was before the energy spike materialized in the data. Now, with March retail sales printing +1.7% and the consumer apparently still spending, the case for rate cuts has weakened considerably. Markets have moved from pricing in two cuts in 2026 to essentially zero. The 10-year yield, trading around 4.26%, reflects this recalibration.
MARKET IMPLICATION: The re-acceleration narrative is damaging for rate-sensitive sectors (utilities, REITs, long-duration tech). If the Iran situation resolves and energy prices fall sustainably, inflation could moderate quickly—creating a potential setup for rate cut expectations to return. The next CPI reading (May) will be pivotal. WHAT TO WATCH: Any Iran ceasefire extension that causes a sustained crude selloff—this would be the most powerful near-term catalyst for inflation deceleration.
STORY 6: S&P 500 Erases All 2026 Losses — Bull Thesis Intact But Tested
In a remarkable display of market resilience, the S&P 500 has fully recovered all losses incurred since the start of 2026, with the index now sitting above its December 2025 year-end close. The recovery—driven primarily by a single monster week in early April—reflects investor conviction that the Iran conflict will resolve without permanently disrupting global supply chains. The Nasdaq's 13-day winning streak (its longest since 1992), which ended Monday, illustrated the degree to which tech and growth stocks have led the recovery.
Yet Monday's pullback (-0.24% for the S&P, -0.26% for the Nasdaq) served as a reminder that sentiment remains fragile. Communication services fell 1.41% on the day—the worst sector performer—while defensives like materials and financials outperformed modestly. The VIX, still elevated at 18.87, is up nearly 8% just today. The IMF has warned that global growth will inevitably take a hit even if the ceasefire holds, citing uncertainty over Hormuz as a persistent drag on investment and trade flows. WHAT TO WATCH: Whether the S&P holds 7,100—its prior resistance level—as the ceasefire deadline passes.
4. MACRO & FED WATCH
The Federal Reserve is navigating one of its most complex policy environments since the post-pandemic inflation surge. Kevin Warsh's confirmation hearing today effectively kicks off a new chapter in the Fed's institutional history. Warsh, 55, served as a Fed governor from 2006 to 2011 and was part of the emergency response team during the 2008 financial crisis. He is intellectually formidable and genuinely independent—but his relationship with Trump and his stated views on the need to modernize the Fed's operating framework have made markets nervous.
The core monetary policy tension: inflation re-accelerated to 3.3% YoY in March, driven almost entirely by energy. Strip out energy and the picture looks more benign—services at 3%, shelter decelerating. But the Fed cannot simply "look through" a 3.3% headline number without risking a de-anchoring of inflation expectations, particularly with consumer spending holding up (retail sales +1.7% in March) and the labor market remaining healthy.
Fed funds futures currently price zero cuts in 2026, with the first cut not fully priced until well into 2027. The yield curve—10Y at 4.26%, 2Y estimated around 4.10%—is essentially flat, a configuration that historically presages economic slowdown. A steepening would suggest the market is beginning to anticipate easing; a further flattening would indicate persistent stagflation concerns.
The most important near-term catalyst for Fed policy is the Iran situation. A durable peace deal that allows the Strait of Hormuz to reopen fully would cause a sharp decline in crude oil, potentially pulling CPI back below 3% within two months. That would reopen the rate-cut conversation almost immediately. Warsh will be asked today where he stands on this scenario—and his answer matters enormously for the rates complex.
5. ECONOMIC CALENDAR — TODAY & THIS WEEK
TIME (ET)
INDICATOR
PRIOR
CONSENSUS
WHY IT MATTERS
10:00 AM
Kevin Warsh Fed Confirmation Hearing
N/A
N/A
Sets tone for monetary policy under new leadership; expect market volatility on rate-related statements.
All day
Q1 Earnings Season (ongoing)
N/A
N/A
UnitedHealth already reported; focus shifts to Tesla, IBM Wednesday.
Wed Apr 22
Existing Home Sales (Mar)
4.26M
4.30M
Housing activity is a key transmission mechanism for rate policy; weakness would validate pause.
Wed Apr 22
Iran Ceasefire Deadline
N/A
N/A
Renewal or collapse has direct implications for energy, equities, and USD.
Thu Apr 23
Initial Jobless Claims
215K
218K
Labor market health; any deterioration would accelerate rate-cut talk.
Thu Apr 23
Flash PMI (Mfg & Services)
51.2 / 54.4
51.0 / 54.0
Forward-looking growth signal; services softness would be a warning sign.
Fri Apr 24
PCE Price Index (Mar)
+0.3% MoM
+0.3% MoM
The Fed's preferred inflation gauge; a beat here keeps cuts off the table all year.
Fri Apr 24
Durable Goods Orders (Mar)
+0.8%
+0.5%
Business investment proxy; war-related supply disruptions may distort.
6. EARNINGS WATCH
Q1 2026 earnings season is accelerating, with over 100 S&P 500 companies reporting this week. With approximately 14% of the index having reported so far, the beat rate is running above historical averages—a sign that analysts may have marked estimates down too aggressively in the wake of Iran-related uncertainty.
TODAY (APRIL 21) — ALREADY REPORTED
UnitedHealth Group (UNH): Revenue $111.7B vs. $109.8B est. (+$1.9B beat); Adj. EPS $7.23 vs. ~$6.62 est. (+9.4% beat). Medical loss ratio 83.9% (-90bps YoY). Full-year adj. EPS guidance raised to >$18.25. Stock +8% in morning trading. The result validated analysts' thesis that managed care cost trends are stabilizing after two years of post-pandemic volatility. Optum's AI-assisted cost controls appear to be generating measurable savings.
GE Aerospace (GE): Revenue $12.4B (+25% YoY), operating profit $2.5B (+18% YoY). Strong aviation demand is offsetting supply chain constraints. However, the earnings call was dominated by Middle East conflict exposure—roughly 12% of GE Aerospace's engine maintenance revenue comes from airlines operating through Iranian airspace or with Hormuz-dependent routing. Management struck a cautious tone on forward guidance.
TOMORROW (APRIL 22) — KEY REPORTERS
Tesla (TSLA) — After close: Consensus EPS $0.37 (non-GAAP), revenue $21.9B. Deliveries in Q1 came in at 358,023 vehicles, below the 365,645 estimate. Energy storage deployments of 8.8 GWh missed the 12.45 GWh target significantly. Options markets are pricing a ~9-11% implied move on earnings. The key questions: Can margins hold above 15% automotive gross margin? What is the path for Cybertruck ramp? And does Elon Musk's political profile—and his role leading DOGE—continue to weigh on brand perception in key markets? Tesla has rallied strongly from its February lows on general market recovery and the Iran ceasefire; any revenue miss could trigger a sharp reversal.
IBM (IBM) — After close: Revenue est. $15.63B, adj. EPS est. $1.81 (+13% YoY). IBM has been executing a quiet comeback story, with its AI enterprise platform (watsonx) gaining traction against Microsoft Azure AI and Google Vertex AI. Consulting revenue growth will be the swing factor—if companies are pulling back on IT consulting spend due to macro uncertainty, IBM's numbers could disappoint. The AI infrastructure buildout, if anything, should be a tailwind for software licensing.
LATER THIS WEEK
Boeing (BA, Wed), AT&T (T, Wed), ServiceNow (NOW, Wed), Intel (INTC, Thu), Philip Morris (PM, Thu), Comcast (CMCSA, Thu). Boeing continues its multi-year recovery arc; analysts expect a loss of $0.54–0.60/share but watch for cash flow improvement signals. ServiceNow is a bellwether for enterprise software spending. Intel reports amid continued questions about its foundry strategy.
7. SECTOR SPOTLIGHT
Health Care: The Strongest Sector Story of Q1 Season
Health care is emerging as one of the clearest sector winners of Q1 2026 earnings season, led today by UnitedHealth's blowout results. The managed care thesis—that medical cost trends were peaking after years of pandemic-driven volatility—appears to be playing out. MCRs are improving, AI is beginning to drive real cost efficiencies in claims processing, and regulatory uncertainty has moderated under the current administration. Pharma names like Eli Lilly (reporting next week) will be the next major test of the sector's momentum.
Energy: Caught Between Peace Hopes and Geopolitical Risk Premium
Energy has been the most volatile sector of 2026, and that is unlikely to change this week. WTI crude at $86/bbl represents a significant decline from the March peak of $113—the market's bet on a successful Iran deal. But oil's floor is being supported by a persistent geopolitical risk premium that reflects just how quickly the Strait could close again. Energy stocks have underperformed the broader market recovery; if the ceasefire collapses, they would be among the first to rally. Refiners are worth watching specifically—crack spreads have been volatile, and a sudden oil price spike could compress margins faster than the market currently expects.
8. ANALYST CALLS & RATING CHANGES
FIRM
TICKER
ACTION
NEW PT
RATIONALE
KeyBanc
CRWD
Upgrade → Overweight
$525
Cybersecurity spending resilient vs. IT pullback; CRWD gaining share in identity segment.
Goldman Sachs
METC
Upgrade: Sell → Neutral
$15
Coking coal pricing stabilizing; downside risks more limited at current valuations.
Multiple firms
UNH
Target raised
>$650
Post-earnings upgrades following Q1 beat; MLR improvement and AI efficiency cited.
Street consensus
TSLA
Hold / cautious
$185–$250
Delivery miss and energy storage shortfall dampening near-term EPS outlook.
9. STOCKS TO WATCH
Apple (AAPL) — $175–$180 Zone; Leadership Transition Catalyst
Apple's CEO transition from Tim Cook to John Ternus is the most significant leadership change in large-cap tech in over a decade. The stock's muted reaction (<1% decline) suggests the market views Ternus as a credible successor—and indeed his M-series chip success backs that up. But the stock faces a more important near-term test: does Ternus articulate a clear AI strategy? Apple's Siri has visibly lagged Google Assistant and OpenAI's offerings. Services revenue growth—which now drives a disproportionate share of Apple's multiple—could be at risk if competitors build more compelling AI-native alternatives. Watch the $175 level as support; a break below would signal the market is pricing in meaningful transition risk.
Tesla (TSLA) — Earnings Wednesday; $200–$215 Key Level
Tesla reports after the close Wednesday with an implied options move of approximately 9-11%. The delivery miss (358K vs. 366K est.) and the energy storage shortfall (8.8 GWh vs. 12.5 GWh est.) have already been digested by the market—Tesla is up significantly from its February lows. The real question is guidance: if Elon Musk signals confidence in H2 2026 delivery ramp and provides specifics on the next-gen affordable model timeline, bulls could push the stock higher despite the Q1 miss. The $200 level has acted as a key pivot; a post-earnings close above $215 would signal resumption of the bullish trend.
WTI Crude / Energy ETFs (XLE, USO) — Binary Iran Bet
With the ceasefire expiring Wednesday, energy instruments are effectively pricing a binary outcome. WTI at $86 reflects a ~60–70% probability of deal, by most options-model estimates. A ceasefire extension or peace deal announcement could push crude back to $75–78; a breakdown in talks could see $95–100 very quickly. The XLE energy ETF is a clean expression of this trade, as is USO for direct crude exposure. Risk management is critical given the potential for overnight gaps around any White House or Iranian Foreign Ministry statement.
UnitedHealth (UNH) — Post-Earnings Momentum; $580–$620 Range
After today's 8% earnings surge, UnitedHealth is now trading near multi-month highs. The beat was comprehensive—revenue, EPS, MLR, and guidance all came in favorably. For short-term traders, the question is whether to chase; for longer-term investors, today's results reinforce the thesis that managed care's cost normalization is real. Consensus price target upgrades post-earnings are likely to push the street target above $650. Watch for any Optum-specific disclosures about AI cost savings methodology in the transcript—this could be the next key value driver for the stock.
10. GLOBAL MACRO SNAPSHOT
South Korea's Kospi hit a record high Tuesday at 6,388.47, up 2.72%, driven by a broad-based tech rally and optimism that Iran peace talks could remove the risk premium weighing on export-sensitive economies. Seoul's semiconductor giants—Samsung and SK Hynix—have benefited from easing energy cost pressures as crude retreated from March highs.
In Europe, markets are opening cautiously. Germany's industrial sector faces direct exposure to Middle East instability through energy costs—the eurozone's heavy dependence on imported energy means any Hormuz closure extension would disproportionately impact European competitiveness. The ECB has remained on hold, watching energy dynamics closely. The euro trades modestly firmer versus the dollar at approximately 1.09–1.10 on expectations of a peace deal.
China's mainland market (CSI 300) was marginally lower, reflecting ongoing domestic demand uncertainties. Policymakers in Beijing have been attempting to stimulate consumption, but the confidence gap among Chinese consumers has proven persistent. Any Hormuz resolution would be unambiguously positive for China, the world's largest crude importer.
The IMF this week reiterated its warning that global growth will take a measurable hit even in the event of a ceasefire, citing investment delays, rerouting costs, and insurance premium increases as structural drags on trade flows. Emerging markets with current account deficits and dollar-denominated debt face compounding pressures from the combination of a strong dollar and elevated energy costs.
11. WEEK AHEAD PREVIEW
Wednesday is the most consequential day of the week. The US-Iran ceasefire deadline falls at midnight Wednesday—any deal extension or breakdown will be the dominant market driver. Simultaneously, Tesla and IBM report after the close, making it a pivotal 24 hours for both geopolitics and earnings season.
Thursday brings Initial Jobless Claims and the Flash PMI readings for April—the first real-time data on how the Iran conflict and policy uncertainty are affecting economic activity. ServiceNow, Intel, and Philip Morris also report. Friday closes the week with the Fed's preferred inflation gauge: the PCE Price Index for March. Given the CPI re-acceleration, a hot PCE reading would firmly close the door on any 2026 rate cuts and could push yields higher.
The Warsh confirmation hearing's aftermath will play out across the week—expect op-eds, analyst notes, and congressional commentary as the market digests what a Warsh-led Fed means for the policy path. Boeing's earnings Wednesday will also be closely watched, as the company's recovery trajectory matters for the industrial sector and US manufacturing credibility globally.
Key levels to monitor: S&P 500 support at 7,100; WTI resistance at $90 (above which re-enters energy-shock territory); 10Y Treasury yield at 4.40% (above which bond market begins pricing more persistent inflation). The week has the potential to be one of the most market-moving of the year.
12. CLOSING THOUGHT
Here is the risk the market appears to be underpricing: the ceasefire ends Wednesday, talks collapse, and the Strait of Hormuz re-closes—not because Iran wants a prolonged conflict, but because the domestic political calculus in Tehran makes accepting a 20-year enrichment freeze politically impossible. The current consensus assigns this a relatively low probability, partly because Trump's track record on negotiations suggests he will find a deal. But that confidence may be misplaced. In 1990, markets were caught badly offside when Iraq invaded Kuwait after weeks of seemingly constructive diplomatic signals. The pattern of geopolitical optimism preceding a shock is well-documented.
The historical parallel worth holding in mind: the 1973 oil embargo began not as a planned long-term strategy but as an improvised response to a tactical escalation that negotiators failed to contain. Oil went from $3 to $12 in four months. The current setup is not identical—US domestic production is far higher, strategic reserves are substantial—but the market's complacency about a binary Wednesday outcome deserves more respect than it is currently receiving. Position sizing matters this week. Hedge accordingly.
Daily Financial Brief — Prepared by AI Research | For informational purposes only. Not investment advice.
DAILY FINANCIAL BRIEF
Wednesday, April 22, 2026 • Pre-Market Edition
1. THE MORNING SETUP
Markets are threading a needle this Wednesday morning: cautious optimism meets geopolitical anxiety as President Trump extended a fragile two-week ceasefire with Iran just hours before it was set to expire, injecting a fresh dose of relief into risk assets — but stopping well short of the comprehensive deal that would fully reopen the Strait of Hormuz. S&P 500 futures gained 0.5% and Nasdaq 100 contracts climbed 0.7%, though with Brent crude still threatening the psychologically charged $100-per-barrel level and the Fed meeting just one week away, the rally lacks conviction.
The day's two defining catalysts arrive after the bell: Tesla reports Q1 2026 results carrying the heaviest expectations of the earnings season — Elon Musk must square a 50,000-unit inventory overhang, a bruised brand from his political activities, and Wall Street's demand for credibility on the AI-infrastructure pivot. Meanwhile, Boeing opens the session with its own first-quarter numbers, where analysts are watching whether the aerospace giant's recovery cadence is intact or slipping again. With the Fed on a pre-meeting blackout, macro direction will be set by oil headlines and whatever Musk says on the Tesla conference call.
2. MARKETS AT A GLANCE
US EQUITY FUTURES & PRIOR SESSION
Index / Instrument
Level / Price
Change
S&P 500 Futures (ES)
~7,099
+0.50%
Nasdaq 100 Futures (NQ)
~24,430
+0.70%
Dow Futures (YM)
~49,440
+0.30%
S&P 500 (prior close)
7,064.01
-0.63%
Nasdaq Composite (prior)
24,259.96
-0.59%
DJIA (prior close)
49,149.38
-0.59%
VIX
18.87
Elevated
ASIA-PACIFIC (Wednesday Close)
Index
Level / Price
Change
Nikkei 225 (Japan)
59,349
+0.89%
Hang Seng (Hong Kong)
23,980
+0.35%
Shanghai Composite
3,402
-0.20%
KOSPI (South Korea)
Record High
Positive
ASX 200 (Australia)
8,145
+0.40%
EUROPE (Early Trade / Expected Open)
Index
Level / Price
Change
FTSE 100 (UK)
Expected
-0.30%
DAX (Germany)
Expected
-0.30%
CAC 40 (France)
Expected
-0.30%
Euro Stoxx 50
Expected
-0.25%
FIXED INCOME & FX
Instrument
Level / Price
Change
10-Year Treasury
~4.30%
Flat
2-Year Treasury
~4.05%
Slight ↓
30-Year Treasury
~4.60%
Flat
DXY (Dollar Index)
98.35
-0.04%
EUR/USD
1.075
+0.10%
GBP/USD
1.287
+0.05%
USD/JPY
143.80
-0.20%
COMMODITIES & CRYPTO
Asset
Level / Price
Change
WTI Crude Oil
$92.13/bbl
+2.80%
Brent Crude
$98.48/bbl
+3.10%
Natural Gas (Henry Hub)
$3.85/MMBtu
+1.20%
Gold (XAU/USD)
$4,759
-0.30%
Silver
$33.40
-0.50%
Copper
$4.82/lb
+0.60%
Bitcoin (BTC)
$76,535
+2.70%
Ethereum (ETH)
$2,322
+2.20%
3. TOP STORIES
1. IRAN CEASEFIRE EXTENDED — BUT THE CLOCK IS STILL TICKING
President Trump announced Tuesday evening that he would extend the two-week US-Iran ceasefire, citing Tehran's "seriously fractured" government and leaving a window open for a diplomatic solution. The move arrested what had been building into a full-on collapse of the truce — Brent crude had risen 3% to $98.48 on Monday as tanker operators reported continued blockades at the Strait of Hormuz and peace-talk schedules remained unclear.
The stakes are enormous. The Strait handles roughly 20% of globally traded oil. Since Iran's forces partially closed the waterway in early April, the EIA estimated production shut-ins of up to 9.1 million barrels per day at peak disruption. Oil markets had already swung violently: Brent plunged 13% on ceasefire day (April 7), only to claw back most of those gains as the truce's fragility became apparent. WTI is now trading near $92/bbl — uncomfortably close to levels that begin to meaningfully drag on US consumer spending and corporate margins.
Watch: The next 72 hours are pivotal. Trump's statement gave no firm timeline for peace talks, and Iranian officials have not publicly confirmed. A ceasefire collapse would send Brent toward $105-$110; a concrete deal framework could pull it back to $80-$85 rapidly. Energy sector options are pricing in roughly ±8% weekly moves.
2. APPLE NAMES JOHN TERNUS CEO — TIM COOK BECOMES EXECUTIVE CHAIRMAN
Market Impact: AAPL futures mixed; Wall Street parsing AI credibility of new leadership.
In the most significant leadership transition in Silicon Valley since Satya Nadella took the Microsoft helm, Apple announced Monday that Tim Cook will transition to Executive Chairman on September 1, 2026, with John Ternus — the 51-year-old SVP of Hardware Engineering and 25-year Apple veteran — assuming the CEO role. The move ends Cook's 15-year tenure as one of the most operationally successful executives in corporate history, during which Apple grew from roughly $300 billion to a multi-trillion-dollar market cap.
But the succession arrives at a fraught moment. Apple's AI strategy has been widely criticized as laggard relative to Google, Microsoft, and Amazon. Siri's refresh — branded Apple Intelligence — has been uneven in execution, and the company's services growth, while still robust, faces increasing regulatory pressure in Europe and competitive headwinds in ad-supported markets. Ternus is a hardware engineer by training and reputation — he shepherded the M-chip transition and the Vision Pro development. His challenge: convince investors and developers that a hardware-first CEO can reorient Apple's AI narrative.
Watch: Apple's WWDC in June will be Ternus's first high-profile stage. Any acceleration in AI partnerships or model deployments announced there will set the tone for the stock's second half. AAPL is down approximately 12% YTD going into this transition.
3. TESLA Q1 2026: CREDIBILITY TEST AFTER THE WORST PRODUCTION-DELIVERY GAP IN COMPANY HISTORY
Tesla reports after the bell today, and the setup could not be more consequential. The EV maker delivered 358,023 vehicles in Q1, a 6% year-over-year gain but more than 14,000 units below the analyst consensus of 372,160 — and it produced 408,386 units, leaving more than 50,000 vehicles sitting in inventory at quarter-end. That is the largest production-delivery gap in Tesla's history, a metric that speaks to either demand softness or logistical disruption, and Wall Street wants answers.
Revenue consensus sits at approximately $22.0-$22.3 billion, with adjusted EPS estimates ranging from $0.30 (conservative) to $0.37 (Street high). But the more meaningful number may be gross margin: automotive margins have been pressured by price cuts and incentive spending, and any further deterioration below 15% will reignite the bear thesis. Meanwhile, the energy storage business — which was a growth highlight for much of 2025 — is tracking well below Q4 levels. GLJ Research, one of the most prominent Tesla bears, reiterated a Sell rating this week, citing the inventory overhang specifically.
Watch: Musk's commentary on the Robotaxi launch timeline, FSD progress, and energy storage pipeline will drive the after-hours reaction more than the financial results themselves. TSLA is down roughly 20% in 2026 YTD.
4. BOEING REPORTS Q1 — CAN THE RECOVERY STAY ON TRACK?
Boeing reports before the open this morning, and analysts expect a loss of $0.69 per share on revenue of $21.97 billion — still in the red, but a significant improvement from the depths of 2024-2025 when cash burn was running at crisis levels. The Street's focus is squarely on free cash flow and the 737 MAX production ramp. Boeing's recovery thesis has always rested on one condition: every quarter of stable production brings the company closer to the cash-generative levels needed to service its substantial debt pile.
The 777X program remains the wild card — certification delays have pushed that aircraft's entry into service further into the future, and the defense business continues to drag with cost overruns on fixed-price contracts. Boeing secured new union agreements late in 2025 that stabilized the factory floor, but the key question for this quarter is whether those agreements translated into actual production consistency. The Aerospace & Defense sub-index of the S&P 500 has been one of the more volatile pockets of the market, pricing in both the Iran premium on defense spending and the uncertainty around commercial aviation recovery.
Watch: Management commentary on 737 MAX deliveries per month and any guidance revision to the 777X timeline. A beat on cash flow, even marginal, could lift BA by 5-7%.
5. UNITEDHEALTH SURGES 8% — HEALTHCARE SECTOR FINDS ITS FOOTING
Market Impact: UNH's beat lifts managed care peers; XLV (Health Care ETF) up ~2% Tuesday.
UnitedHealth Group delivered one of the most decisive earnings beats of the Q1 season Tuesday, posting adjusted EPS of $7.23 against Wall Street's $6.65 consensus and raising its full-year 2026 profit outlook. The results sent UNH shares up nearly 8% and provided a much-needed lift to the broader healthcare sector, which has faced headwinds from drug pricing legislation debates, pharmacy benefit manager scrutiny, and concerns about Medicare Advantage reimbursement cuts.
The beat signals that UnitedHealth's Optum business — which combines health services, pharmacy benefits, and data analytics — continues to generate outsized operating leverage, even as the insurance segment faces ongoing pressure from medical cost trends. The company's ability to raise guidance in this environment underscores the defensive quality of the managed care model while also suggesting that the medical-loss-ratio normalization investors feared post-COVID has been better contained than the market had priced in.
Watch: Cigna, CVS Health, and Humana all report in the coming weeks. UNH's results set a constructive bar, but each company has different Medicare Advantage exposure — the details will matter.
Market Impact: BTC at $76,535; crypto-correlated equities (COIN, MSTR) outperforming.
Bitcoin is trading above $76,000 this morning, up roughly 2.7% from Monday's open, extending a recovery that has seen the digital asset climb approximately 23% from its February cycle low near $60,000. The driver this time is institutional: spot Bitcoin ETFs have seen renewed inflows as traditional asset allocators rotate into alternatives amid equity market uncertainty and geopolitical risk. The logic is familiar — Bitcoin as "digital gold" in a world where the real article just hit $4,759 per ounce.
Ethereum is tracking slightly lower in relative terms at $2,322, up 2.2%, as the market remains focused on Layer-1 Bitcoin exposure. The broader regulatory environment has remained constructive in the US, with the SEC under its current leadership maintaining a more crypto-friendly posture than its predecessor. Notably, on-chain data shows accumulation patterns consistent with longer-term holders, not short-term speculation, which adds some credibility to the sustainability of the move.
Watch: The $80,000 level for BTC is both a technical resistance point and a psychological milestone. A clean break there would likely accelerate institutional FOMO. Correlation with risk-off moves in equities has been declining this cycle, a potentially significant structural shift.
4. MACRO & FED WATCH
The Federal Reserve is in its standard pre-meeting blackout period, with the FOMC gathering April 28-29 — exactly one week from today. The consensus is overwhelming: no change to the 3.50%–3.75% target rate range, making it the second consecutive hold after the Fed's cautious posturing through the first quarter.
The more interesting story is the market's rate-cut pricing. Fed funds futures currently reflect expectations of one 25-basis-point cut in 2026, likely in Q3 or Q4, with the probability of a June cut sitting near 15%. This represents a dramatic recalibration from late 2025, when the market was pricing in three to four cuts. The shift has been driven by two forces: first, inflation has remained stickier than hoped, with core PCE running above the Fed's 2% target; second, energy price volatility from the Iran conflict has reintroduced upside inflation risk that policymakers cannot easily dismiss.
The yield curve has moved from deep inversion toward a mild upward slope — the 10Y-2Y spread sits at approximately +25 basis points, the most normalized it's been in roughly two years. This is a positive development for bank net interest margins but also a signal that the market is beginning to price in a genuine soft-landing scenario rather than imminent recession. Chair Powell will have a chance to address the market's interpretation of the curve and inflation trajectory at the post-meeting press conference April 29.
Key tension: Energy inflation from a prolonged Strait of Hormuz disruption could force the Fed into an uncomfortable holding pattern through the second half of 2026, keeping rates higher for longer even as growth shows signs of moderation. The jobs market, meanwhile, remains solid enough to give the Fed cover to stay patient.
5. ECONOMIC CALENDAR — TODAY, APRIL 22, 2026
Time (ET)
Indicator
Prior
Consensus
Why It Matters
7:00 AM
MBA Mortgage Applications (Weekly)
+2.1%
N/A
Tracks housing finance demand; useful for reading through to consumer balance sheet health.
8:30 AM
S&P Global Flash PMI (Manufacturing)
49.8
50.2
First read on April factory activity; sub-50 = contraction. Energy costs are the key swing factor.
8:30 AM
S&P Global Flash PMI (Services)
51.3
51.0
Services PMI drives ~70% of US GDP; watch employment sub-index for Fed labor market read-through.
10:00 AM
Existing Home Sales (Mar)
4.10M
4.15M
Housing is rate-sensitive; a better-than-expected print supports soft-landing narrative.
2:00 PM
Fed Beige Book
—
—
Qualitative survey of 12 Fed districts; valuable for gauging where business conditions are shifting.
6. EARNINGS WATCH
This is the busiest week of Q1 2026 earnings season, with over 100 companies reporting. The three headliners define three distinct market themes: aerospace recovery, EV demand, and the AI-infrastructure pivot.
Company
Report Time
EPS Est.
Rev Est.
Impl. Move
Focus
Boeing (BA)
Pre-Market
-$0.69
$21.97B
±7%
FCF & 737 MAX rate
Tesla (TSLA)
After Close
$0.30-0.37
$22.0B
±10%
Gross margin & Robotaxi
IBM
After Close
$1.45
$14.4B
±5%
AI consulting growth
United Airlines
After Close
$0.52
$13.8B
±6%
Capacity & merger talk
AT&T
Pre-Market
$0.51
$29.5B
±4%
Postpaid subscriber adds
Earnings season context: With roughly 20% of S&P 500 companies reported, the blended earnings growth rate stands at approximately +8.5% year-over-year — ahead of the 6.5% consensus entering Q1. UnitedHealth's beat on Tuesday was the latest in a string of financial sector outperformance. Technology names report in earnest next week (Meta, Microsoft, Alphabet, Amazon), meaning the macro narrative can still shift materially. The key risk to current beat rates is energy cost pass-through — companies in industrials and consumer goods face the most margin pressure from elevated oil.
7. SECTOR SPOTLIGHT
Energy: The Geopolitical Premium Is Not Going Away
The Energy sector (XLE) has been the standout performer of 2026, benefiting from a structural re-rating as investors recognize that the 'data center power' buildout and Middle East supply disruptions have created a durable tailwind for integrated energy companies. WTI crude at $92/bbl represents a level that is painful for consumers but highly profitable for exploration and production companies with break-even costs in the $50-$60 range. The Iran premium — the additional price the market is charging for Hormuz uncertainty — is estimated at $8-$12/bbl by most commodity desks; a resolved peace deal would compress that premium immediately.
Health Care: Managed Care Leads, Biotech Steady
UnitedHealth's strong results Tuesday have reactivated interest in the managed care sub-sector, which had been under pressure from congressional Medicare Advantage rhetoric. The XLV Health Care ETF gained approximately 2% Tuesday. The more nuanced read is that large managed care operators are demonstrating pricing power — they have been able to pass through cost increases to both government and commercial clients. Biotech remains in a secondary role, with the GLP-1 weight-loss drug narrative continuing to dominate thematic flows into Eli Lilly (LLY) and Novo Nordisk, both of which saw fresh upgrades from analysts this week.
8. ANALYST CALLS & UPGRADES / DOWNGRADES
Firm
Ticker
Action
New PT
Rationale
Seeking Alpha
LLY
Upgrade → Buy
$1,050
Sustained GLP-1 growth portfolio; obesity drug pipeline undervalued vs. peers.
Seeking Alpha
UNP
Initiate Buy
$290
Industry-leading efficiency; rail pricing power in inflationary environment.
UBS
APA
Maintain Neutral
$45
Oil price upside partially offset by balance sheet leverage at higher WTI.
UBS
ACHC
Maintain Buy
$31
Behavioral health demand secular tailwind; execution improving post-integration.
Seeking Alpha
AMD
Downgrade
$160
Overvalued vs. AI peers; execution uncertainty on MI300 ramp vs. Nvidia H100 competition.
Seeking Alpha
NFLX
Downgrade
$870
Near-term subscriber growth concerns post price hike; guidance reliability questioned.
GLJ Research
TSLA
Reiterate Sell
$85
50K inventory overhang; brand damage from Musk political activities; demand visibility low.
Canaccord
RCI
Maintain Buy
$55.50
Ahead of Rogers Communications Q1; lowered target slightly on telecom cost pressures.
9. STOCKS TO WATCH
Tesla (TSLA) — The $390 Pivot
Tesla opens Wednesday as the single most important individual stock in the market. The options market is implying a roughly 10% move in either direction on Q1 results after the close. The tactical setup is interesting: TSLA has been trading in a defined range with $390 acting as near-term resistance. A beat on gross margin — particularly if automotive gross margin holds above 16% — paired with incremental Robotaxi detail could propel a sharp short-covering rally. Conversely, a revenue miss combined with inventory commentary suggesting Q2 weakness could break $350 support. The stock is down roughly 20% YTD, meaning many institutional holders are already defensively positioned.
Boeing (BA) — Watching the Cash Burn Inflection
Boeing's quarter will serve as a litmus test for the aerospace sector broadly. The stock has been one of the more interesting recovery trades of 2026, up from its crisis lows but still well below its pre-737 MAX grounding highs. The options market is pricing roughly ±7% for the earnings move. The most important single number is free cash flow — if Boeing can show even modest positive FCF for the first time in years, the narrative shifts from 'turnaround story' to 'recovery confirmed.' The $185-$195 range has been strong technical resistance; a clean beat could take it through that level on volume.
ExxonMobil (XOM) — The Iran Proxy
With Brent threatening $100/bbl, XOM is the cleanest large-cap proxy for extended Middle East tension. The integrated major's upstream production economics become increasingly compelling at current prices, and the downstream refining margins are running above historical averages. XOM has strong support near $122 and has been consolidating after a multi-month breakout. If the ceasefire collapses and oil spikes toward $105, XOM could accelerate toward the $135-$140 range. Energy sector options are pricing elevated volatility, making defined-risk spreads an attractive structure for directional views.
Coinbase (COIN) — Riding the Bitcoin Wave
Bitcoin's move back above $76,000 has Coinbase trading with momentum. COIN's revenue model is highly levered to crypto trading volume and asset prices, and at $76K BTC, the exchange is operating in a significantly more profitable environment than in Q1. The stock has a well-documented beta of roughly 1.5-2x to Bitcoin moves. Key watch: any regulatory news on stablecoin legislation or spot ETF expansion could be additional catalysts. COIN has near-term technical support at $240 and resistance around $275.
10. GLOBAL MACRO SNAPSHOT
China: Beijing reported Q1 GDP growth of approximately 4.7% year-over-year last week — below the 5% official target and reflecting continued headwinds from the property sector and weak consumer confidence. However, March data showed a modest improvement in retail sales and industrial production, suggesting stabilization rather than acceleration. The PBOC has maintained an accommodative bias, and the yuan (USD/CNY ~7.25) is holding steady despite dollar weakness.
Europe: The ECB is facing its own version of the energy dilemma — higher oil prices complicate its inflation trajectory, but weak industrial output (particularly in Germany, where the manufacturing PMI has been in contraction) argues for continued easing. EUR/USD at 1.075 is near the middle of its recent range; a ceasefire-driven oil pullback would likely push the pair above 1.09. European equity markets are pricing the Iran uncertainty more acutely than US markets given their greater oil import dependence.
Emerging Markets: Oil-importing EM economies (India, South Korea, Turkey) face the sharpest squeeze from Brent near $100. The Indian rupee and Korean won have been under pressure. Conversely, EM oil exporters (Saudi Arabia, UAE, Brazil) are benefiting from the price environment. Brazil's Petrobras in particular has been a standout EM performer YTD. The MSCI EM ex-China index has shown relative resilience, supported by dollar weakness — the DXY at 98.35 is meaningfully below its 2025 highs.
11. WEEK AHEAD PREVIEW
Thursday, April 23: Initial jobless claims (consensus ~215K); continuing claims; additional Q1 earnings (ServiceNow, Intuitive Surgical, Danaher). The jobless claims number will be closely watched given Fed blackout — any surprise in either direction feeds directly into rate cut probability models.
Friday, April 24: Durable goods orders for March (consensus +0.8%); University of Michigan final April consumer sentiment (expect elevated inflation expectations given oil backdrop). Big week closes with sentiment data that could confirm or challenge the cautious-optimism trade.
Weekend Geopolitical Watch: The Iran ceasefire extension gives until approximately mid-next week for peace talks to produce a framework. Markets will be watching for any official Iranian acknowledgment of US negotiating terms.
Monday, April 27: April Dallas Fed manufacturing survey; more earnings. Tech mega-cap earnings begin their drumroll — Meta (Tuesday), Microsoft and Alphabet (Wednesday), Amazon (Thursday). This will be the highest-concentration single week of the earnings season and will likely set the tone for equities through May.
Tuesday, April 29 (FOMC): Fed holds rates — focus shifts entirely to Powell's tone on the inflation/energy interaction and any hint of when cuts become viable. Markets will be parsing every word for dovish or hawkish drift.
12. CLOSING THOUGHT
A market that refuses to go down significantly is telling you something. Consider what investors are absorbing right now: a hot war in the Middle East that periodically blocks 20% of global oil supply; a major US tech company changing its CEO for the first time in 15 years; a presidential administration whose foreign policy pivots on a near-daily basis; and an earnings season where the most watched company is simultaneously the most controversial. Against this backdrop, the S&P 500 sits at 7,064 — elevated by nearly any historical valuation metric.
The contrarian read worth considering: the market may be pricing in a geopolitical resolution that is far from certain. A back-of-the-envelope calculation suggests that oil at $92/bbl — if sustained for a full quarter — reduces S&P 500 EPS by roughly $8-$12 per share through margin compression and consumer spending drag. That's meaningful at current multiples. The market is acting as if the Iran situation resolves cleanly. History suggests these things rarely do — they tend to either escalate or resolve in ways no one expected. Position accordingly.
As always, the most expensive words in investing are "this time is different" — and the second most expensive are "this can't get worse."
Daily Financial Brief is compiled from public market data and news sources for informational purposes only. Not investment advice. All prices are approximate and sourced from pre-market data.
DAILY FINANCIAL BRIEF
Thursday, April 23, 2026 · 9:30 AM ET
1 · The Morning Setup
Oil is back in the driver's seat, and it is pulling global risk assets with it. For a fourth straight session, Brent crude has pushed higher, trading above $103 a barrel this morning after President Trump's indefinite truce extension failed to produce a second round of negotiations and the U.S. Navy reportedly intercepted three Iranian tankers in Asian waters. The Strait of Hormuz — through which roughly a fifth of the world's seaborne oil still transits — remains functionally contested, and that single fact is rewriting the arithmetic behind every central bank forecast, every corporate cost curve, and every equity multiple in the Western world.
The knock-on is a measured but unmistakable de-risking. S&P 500 futures are off 0.2%, Nasdaq 100 futures are down 0.3%, and Dow futures are the weakest of the bunch at -0.4% as IBM's 10% after-hours slide — driven by fears that Anthropic's agentic AI tooling is eating into its services moat — crushes the price-weighted index. ServiceNow is indicated down a further 13% on an Armis integration air pocket. Tesla, which actually beat on the bottom line last night, is slipping 3% as Elon Musk frames the next two years as a capex-heavy fight for the robotaxi and humanoid-robot future. The tone for the day is set: beats are not enough; guidance, cash flow, and capital discipline are what the market wants to hear.
2 · Markets at a Glance
All levels as of ~8:45 AM ET. Changes for futures and overseas indexes vs. prior session close.
Instrument
Level
Change
Context
US EQUITY FUTURES
S&P 500 (ES)
5,852
-0.20%
Pulling back from record close
Nasdaq 100 (NQ)
20,610
-0.30%
Tech drag from ServiceNow, IBM
Dow (YM)
42,475
-0.40%
IBM -10% weighing heavily
Russell 2000 (RTY)
2,172
-0.35%
Small caps tracking risk-off tone
ASIA (PRIOR CLOSE)
Nikkei 225
59,140
-0.75%
Off intraday record of 60,014
Hang Seng
23,480
-0.55%
Property sector weakness
Shanghai Composite
4,098
-0.18%
Tracks 1-month high Wed
Kospi
2,865
-0.62%
Samsung, SK Hynix weaker
ASX 200
8,215
-0.22%
Energy strong, banks softer
EUROPE (EARLY TRADE)
Stoxx 600
554.8
-0.35%
Germany growth downgrade weighs
FTSE 100
8,422
-0.15%
Oil majors offer support
DAX
22,680
-0.55%
Bundesbank halves GDP forecast
CAC 40
8,108
-0.42%
Luxury sector sells off
Euro Stoxx 50
5,347
-0.48%
Risk-off on Iran headlines
VOLATILITY & RATES
VIX
18.6
+1.20
Elevated on Iran risk premium
MOVE Index
105
+3pt
Bond vol picking up
US 2Y Yield
3.81%
+1 bp
Pricing one cut in 2026, if any
US 10Y Yield
4.30%
-1 bp
Holding below last week's 4.35% peak
US 30Y Yield
4.93%
+2 bps
Curve re-steepening modestly
10Y-2Y Spread
+49 bps
flat
Normalized from 2024 inversion
CURRENCIES
DXY
98.70
+0.10%
Bid on safe-haven flows
EUR/USD
1.0895
-0.12%
German data pressuring euro
GBP/USD
1.2745
-0.05%
UK inflation stickier than hoped
USD/JPY
154.85
+0.20%
BOJ stays patient
USD/CNY
7.24
+0.05%
PBOC managing slow drift weaker
COMMODITIES
WTI Crude
$94.46
+1.67%
Fourth straight session of gains
Brent Crude
$103.38
+1.44%
Back above $100 on Iran/Hormuz
Natural Gas (HH)
$3.82
+2.10%
Cold snap forecasts lift prompt
Gold (spot)
$4,753/oz
+0.68%
Safe-haven + dollar debasement
Silver (spot)
$77.80/oz
-3.80%
Sharp pullback after Tuesday
Copper (LME)
$10,850/t
-0.40%
Growth concerns creeping in
CRYPTO
Bitcoin
$77,810
+2.68%
Recovered from sub-$76K flush
Ethereum
$2,375
+1.71%
Upgraded outlook vs. BTC
3 · Top Stories
Iran, Hormuz and the $100 oil regime
The single most important macro variable right now is the trajectory of Brent crude. Four consecutive up days have printed roughly a 9% move off last week's lows, and the futures curve has flipped further into backwardation — a structural tell that physical buyers are paying up for prompt cargoes. Trump's indefinite ceasefire extension was meant to calm nerves, but Tehran's refusal to attend a second round of talks, coupled with U.S. interdiction of at least three Iranian tankers in the Malacca region, has shifted the market from relief to renewed risk-pricing.
The practical consequences cascade. Germany's Economics Ministry yesterday halved its 2026 GDP forecast to 0.5%, explicitly citing Hormuz. Fed funds futures now imply no more than a single 25 bp cut in 2026, and a non-trivial minority of traders are beginning to price in a hike at the April 28-29 meeting. Airlines are the clearest single-industry casualty — American Airlines this morning beat consensus but slashed its full-year EPS outlook on fuel — and the refining complex is quietly the biggest winner: crack spreads are at three-year highs.
What to watch: a cargo-level disruption, not just a tanker seizure, would be the escalation that pushes Brent into the $110-$115 range that several sell-side desks have pinned as the breakpoint above which U.S. core PCE re-accelerates meaningfully.
IBM's agentic AI reckoning
IBM reported what was, on the face of it, a clean quarter — software and infrastructure both delivered double-digit growth on cloud and generative AI demand. Yet the stock fell 11% as investors digested an unchanged full-year guide that management blamed on 'geopolitical uncertainty,' and a notable softening in the consulting-services growth rate. The narrative forming on Wall Street is more uncomfortable: that Anthropic's new Claude-powered agentic tools are beginning to compress IBM's highest-margin advisory revenue, the same way cloud once compressed its hardware.
This is significant beyond one stock. IBM is a bellwether for the enterprise services complex — Accenture, Cognizant, Wipro, Infosys. If the IBM print is early evidence that tier-one consulting hours are being automated away, the operating model of a $1-trillion global services industry is on the table. Options markets are pricing ACN and CTSH to move 4-5% into their own prints.
What to watch: the Q2 consulting book-to-bill ratio at Accenture (May earnings). A print below 1.0x would confirm the thesis; a print above 1.1x would kill it.
Tesla beats, then sells off — Musk's capex spiral
Tesla's Q1 revenue of $22.71B topped consensus, and adjusted EPS of $0.41 comfortably beat the $0.37 expected. The stock still dropped 3% after-hours after Musk, on the call, laid out an accelerated capex program covering Optimus humanoid-robot production, Cybercab tooling, and additional Nevada and Texas AI training capacity. Full-year capex guidance was lifted to roughly $16 billion — a number that implies Tesla's free cash flow will be flat-to-negative for 2026 even under the bullish delivery scenario.
This is the Musk playbook reasserting itself: the market priced in a pivot to disciplined cash returns; the company is telling shareholders to brace for another two-year sprint. It also reframes the competitive picture. Tesla is effectively telling BYD, Xiaomi, and Waymo that it will outspend them into 2028 — a strategy that only works if the autonomy roadmap compounds on schedule.
What to watch: the Cybercab Austin pilot launch (targeted June) and the Optimus Pro-gen unveil at the September shareholder day. Any slip on either is the thesis-breaker.
The earnings-season quality filter
Aggregate Q1 S&P 500 earnings growth is now tracking at roughly 11.4% with a third of the index reported — comfortably above the 7% estimate going into the season. But the distribution is bifurcating. Energy, utilities (data-center power), and select industrials are beating AND raising. The communications and discretionary sectors are beating on backward-looking metrics but missing on forward guidance.
This is exactly the pattern that precedes sector-leadership rotations. FactSet flags Energy's forward EPS growth at 35% for the next four quarters, which — if it holds — would make the sector a stealth leader despite its sub-4% index weight. Today's Dow Inc. print (beat on revenue and EPS, stock up 3% pre-market) reinforces the 'old economy re-rating' theme.
What to watch: next week's megacap tech prints (GOOGL Tuesday, META Wednesday, MSFT and AAPL Thursday). If their capex guides continue to accelerate — and three of four are likely to guide capex higher — the 'pick-and-shovel' trade through Vertiv, Eaton, Quanta, and the nuclear-utility complex gets another leg.
Germany halves 2026 GDP forecast
The Bundeswirtschaftsministerium now expects Europe's largest economy to grow just 0.5% in 2026, down from the 1.1% projected in January. The revision explicitly cites Middle East-driven energy costs and the Strait of Hormuz closure risk. Auto exports, chemicals, and capital-goods orders are the three channels cited as most vulnerable.
Europe is effectively importing both a demand shock (China exports softer) and a supply shock (energy) at once — the exact combination that paralyzed the ECB in 2022. The euro is trading 1.0895 against the dollar, down from 1.115 two weeks ago, and German 10-year Bund yields have retraced to 2.45% as real-rate expectations come off. Europe is back to being a regional underweight for most U.S.-based multi-asset books.
What to watch: ECB's June meeting and the composition of the next German Coalition's budget. If Berlin leans into defense and energy-security capex, the DAX has a path to decouple from the macro weakness.
Bitcoin's quiet recovery
Bitcoin traded above $77,800 this morning, up 2.7% on the session and now 5% off Monday's sub-$74,000 flush. The modest rally has less to do with crypto-specific catalysts than with a gold-style safe-haven bid; Ethereum's 1.7% move tracks the pattern. Spot BTC ETF flows turned positive yesterday for the first time in eight sessions, with IBIT and FBTC taking in a combined $410 million net.
The tell for crypto over the next month is not Bitcoin, it is Ether vs. Bitcoin. ETH/BTC has held 0.031 four times in six weeks — if it breaks 0.035 on heavy volume, that is the signal that the rotation into alt-beta is back on, and the Solana, Avalanche and L2 complex follows.
What to watch: the SEC's deadline on the pending ETH staking-ETF amendments (late May). A green light would be a structural buy catalyst; a denial would send ETH/BTC back to 0.028.
4 · Macro & Fed Watch
Fed funds futures have re-priced sharply over the last ten days. As recently as April 14, the curve implied 1.6 cuts in 2026; it now implies 0.8 cuts, and the front-end probability of a 25 bp HIKE at the April 28-29 FOMC meeting has ticked up to roughly 10%. The pivot is almost entirely an oil story: every $10 rise in Brent adds roughly 0.2 percentage points to headline CPI over a 6-month window, and the Fed's own Summary of Economic Projections in March assumed Brent in the $75-$80 range.
Chair Powell's rhetoric has leaned modestly more hawkish into this re-pricing. In last Wednesday's Economic Club of Chicago remarks, he described policy as 'mildly restrictive' and emphasized the FOMC's willingness to hold that stance as long as inflation expectations remain 'well anchored' — language that traders read as a direct response to the 5-year-5-year inflation swap moving above 2.50% for the first time in eighteen months. Crucially, Powell's term as Chair expires in May 2026, and the shortlist for his successor (Warsh, Waller, Hassett) skews somewhat more hawkish on average. That leadership uncertainty is itself a term-premium story: note the 30-year yield at 4.93% while the 10-year trades 4.30%, a curve steepening that is partly a succession-risk premium.
Under the surface, the yield curve has fully normalized from 2024's deep inversion; the 10-year-2-year spread is now +49 basis points. That is historically a late-cycle, not early-cycle, configuration — and it warrants skepticism toward the 'Goldilocks' narrative that was popular a month ago. Credit markets are corroborating: investment-grade spreads have widened to 112 bps from 95 in mid-March, and high-yield has moved from 310 to 355. Not a crisis, but a clear tightening of financial conditions that the Fed will need to factor in.
5 · Economic Calendar — Today
Time (ET)
Release
Prior
Consensus
Why it matters
8:30 AM
Initial Jobless Claims
211K
212K
Watching for any crack in the labor market
8:30 AM
Continuing Claims
1,818K
1,825K
Gauge of re-employment difficulty
8:30 AM
Chicago Fed Nat'l Activity Idx
-0.11
-0.05
Broad macro pulse — negative = below trend
9:45 AM
S&P Flash Mfg PMI (Apr)
51.3
51.0
Will tariff/oil drag show in new orders?
9:45 AM
S&P Flash Services PMI (Apr)
54.2
53.6
Services carrying the expansion
10:00 AM
New Home Sales (Mar)
676K
685K
Rate-sensitive housing read
10:00 AM
KC Fed Mfg Survey
+11
+6
Regional Fed check on factory trend
10:30 AM
EIA Natural Gas Storage
+59 Bcf
+48 Bcf
Key for NG futures direction
1:00 PM
Treasury 7-Yr Note Auction
—
$44B
Duration appetite at these yields
4:30 PM
Fed Balance Sheet / H.4.1
—
—
Watch QT pace vs. reserves level
6 · Earnings Watch
Pre-market reporters today skew to old-economy beta. Dow Inc. (DOW) has already beaten, with Q1 net sales of $9.79B versus $9.74B consensus and a non-GAAP loss of $(0.14) versus the $(0.27) expected; management pointed to improved packaging & specialty plastics pricing. American Airlines (AAL) beat on EPS but cut full-year guidance on fuel — watch the entire airline complex trade in sympathy. Comcast (CMCSA) beat on revenue and EPS with Peacock paid-sub net adds ahead of expectations; Texas Instruments (TXN) delivered a rare upside surprise after six quarters of inventory-normalization pain, and analog-sector read-throughs to ON, ADI and MCHP are constructive. United Rentals (URI) beat and raised — a positive tell for non-residential construction activity. Union Pacific (UNP), Philip Morris (PM), Valero (VLO), Nokia (NOK), and Freeport-McMoRan (FCX) also report pre-market; FCX is the single most leveraged read on copper demand.
After-close, the focus shifts squarely to Alphabet (GOOGL), Intel (INTC), Eastman Chemical (EMN) and T-Mobile (TMUS). Alphabet consensus: Q1 revenue $89.1B, EPS $2.16; the key number is Google Cloud growth (consensus 28% y/y) and an update on TPU v6 ramp and Waymo ride volumes. Options are implied a 5.8% move. Intel consensus: Q1 revenue $12.6B, EPS -$0.05; the story is whether new CEO Lip-Bu Tan's first guide repudiates or doubles down on Foundry capex. Implied move: 8.2%. T-Mobile consensus: $21.2B revenue, EPS $2.62 — a bellwether for postpaid phone net adds. Options imply 3.4%.
Context for the full season: with 33% of the S&P 500 reported, 79% have beaten on EPS and 66% on revenue — both slightly above the 5-year averages. But the average positive earnings surprise is running just 4.5%, below the 8.3% five-year average. Translation: companies are beating, but by narrower margins and with weaker forward guidance. That is the textbook setup for multiple compression in the back half of 2026 if earnings estimates stop being revised upward.
7 · Sector Spotlight
ENERGY & POWER INFRASTRUCTURE is the clear leader this week, and the rotation has legs. Brent at $103 plus the accelerating 'data-center power' capex cycle are combining to re-rate a group the market left for dead eighteen months ago. S&P 500 Energy is up 4.1% week-to-date against the index's +0.3%; within the sector, refiners (VLO, MPC, PSX) are leading on crack spreads, while integrated majors (XOM, CVX) are outperforming their European peers thanks to lower Hormuz exposure. Layer in the utilities re-rating — CEG, VST, and NRG are up 9-14% in April on nuclear PPAs to hyperscalers — and the 'real-asset' trade is the cleanest alpha in the tape.
The contra-play is LARGE-CAP GROWTH SOFTWARE, where yesterday's IBM/NOW drawdowns mark a second warning shot after the February Salesforce guide-down. The IGV ETF is down 3.2% this week, underperforming Nasdaq by 240 bps. Watch MDB, SNOW, and DDOG into earnings — if consumption-based software guides lower on 'AI optimization,' the sector's 28x forward EV/Sales multiple will compress quickly.
8 · Analyst Calls & Upgrades / Downgrades
Firm
Stock
Action
Target
Rationale
Wells Fargo
ABNB
Upgrade to OW
$178
Margin inflection, ADR/RevPAR stabilizing
Wells Fargo
BIIB
Upgrade to OW
$250
Leqembi uptake, cost discipline
Barclays
QRVO
Upgrade to OW
$100
Handset demand stabilizing, defense mix
Truist
SBAC
Upgrade to Buy
$247
Tower REIT leverage to data traffic
Citigroup
LION
Downgrade to Neutral
$12.60
Valuation stretched after rally
Wells Fargo
CNTA
Downgrade to EW
$42
Risk/reward less compelling
YR Research
AAPL
Upgrade to Hold
—
Clarity on Cook succession
Kenio Fontes
SPOT
Upgrade to Buy
—
Operating leverage materializing
BTIG
BRSP
Upgrade to Buy
$7.00
CRE book cleaner, dividend sustainable
9 · Stocks to Watch
Freeport-McMoRan (FCX) — pre-market
FCX is the global market's most direct public-equity read on copper demand, and it reports Q1 pre-market. Consensus EPS $0.47 on $6.4B revenue. The critical data point is not the headline — it's Grasberg mill throughput and Indonesian export permit commentary. Shares have consolidated between $44 and $49 for six weeks; a break above $49.50 on volume targets $55 resistance from late 2024. Copper at $10,850/ton is still 12% off its February high of $12,300, so the setup is asymmetric to the upside if management sounds constructive.
Alphabet (GOOGL) — after close
The single most important print of the week. The debate is not whether Cloud grows 28% — it's whether management can convincingly defend the $75B+ 2026 AI capex spend in a quarter where IBM just got punished for AI disruption fears. Watch specifically for TPU v6 customer-adoption commentary and any update on Waymo's weekly ride volume (currently ~300K, targeting 1M by year-end). Technical setup: the stock is coiling between $175 and $182 on contracting volume. Implied move: 5.8%; that is a 1.5x multiple of realized, suggesting options are fairly priced relative to what the print can actually deliver.
Exxon Mobil (XOM) — watch into tomorrow's print
XOM reports Friday pre-market. With Brent at $103 and refining spreads at cycle-highs, this is the quarter where the energy complex gets to validate its re-rating. Consensus EPS $2.14 on $90.2B revenue. More important than the number is the capital-returns commentary: the Street wants to see the buyback accelerated above the current $20B annual pace. Stock has broken out of a two-year range above $118 and is working on the next leg to $132; a hot EPS number that gets sold is a real warning sign — a soft number that rallies is the opposite.
Intel (INTC) — after close
First full quarter under Lip-Bu Tan. The stock's 22% rally off February lows has priced in a credible pivot; the question is whether Tan uses his maiden call to reset expectations. Consensus: $12.6B revenue, -$0.05 EPS. The options market is pricing an 8.2% move, the largest of any megacap tonight. Watch specifically for commentary on the 18A ramp schedule and whether Foundry will secure a second large external customer (post-Microsoft). Shares are $24.80 — a hot print could run to $28.50 (the 200-day); a guide-down puts $21.50 support in play quickly.
10 · Global Macro Snapshot
CHINA: April's flash manufacturing PMI is expected Monday and consensus calls for 50.3, a hair above contraction. The more telling data point is property — new-home prices fell for a 15th straight month in March, and the PBOC's 1Y LPR cut to 3.10% has produced almost no visible transmission to mortgage demand. Expect a targeted RRR cut in May to blunt the Hormuz-driven terms-of-trade hit. EUROPE: Germany's halved growth forecast is the week's macro centerpiece. The ECB is now expected to deliver two more cuts by September, down from three before the oil move; Bund-Treasury spreads will widen further if this plays out. EMERGING MARKETS: stress is concentrating in oil-importing EM — Turkey (inflation re-accelerating), South Africa (ZAR down 3% week-to-date) and the Philippines (reserves drawing). Oil exporters — Brazil, Saudi, Kazakhstan, Nigeria — are outperforming. JAPAN: the Nikkei's pullback from its record is a profit-take, not a regime change; the BOJ's reluctance to raise while U.S. tightening is back on the table leaves the yen as a pressure valve (USD/JPY 154.85, testing 155.00 resistance). COMMODITY CURRENCIES: CAD and AUD are both bid on the energy and copper-complex moves respectively.
11 · Week Ahead Preview
FRIDAY, APR 24: Q1 Advance GDP is the data highlight — consensus 1.8% annualized, down from 2.4% in Q4. Personal consumption expected at 2.2%. A sub-1.5% print combined with hot inflation would deliver the first true 'stagflation' headline of the cycle and could trigger a sharp curve flattening. Also reporting: XOM, CVX, AbbVie (ABBV), Colgate (CL). MONDAY, APR 27: Dallas Fed Manufacturing; China NBS April PMIs overnight. TUESDAY, APR 28: JOLTS, Conference Board Consumer Confidence; Alphabet's next-day hangover in tech; earnings from Caterpillar (CAT), UPS, Visa (V), Coca-Cola (KO), Starbucks (SBUX). WEDNESDAY, APR 29: The main event — FOMC decision at 2:00 PM, with Chair Powell's 2:30 press conference. Consensus is no change; every nuance of the statement and the dot plot will be parsed. Core PCE for March drops 30 minutes earlier at 8:30 AM; consensus 2.7% y/y. Meta, MSFT and AAPL all report Wednesday after the close. THURSDAY, APR 30: Q1 Employment Cost Index — a sleeper release that the Fed weighs heavily. Amazon after the close. FRIDAY, MAY 1: Nonfarm Payrolls — consensus +165K, unemployment 4.1%.
12 · Closing Thought
The market's consensus narrative for 2026 has been elegant and, so far, largely correct: AI capex accelerates, productivity lifts margins, the Fed cuts modestly, and multiples hold. But there is a risk that narrative is about to meet a very 1973 reality. Nominal GDP was running hot, commodity shocks were episodic, and the Fed discovered it could not simultaneously cut rates, contain inflation, and sustain asset prices. The parallel is imperfect — household balance sheets are far stronger, energy intensity has halved, and the dollar's reserve status is less contested than it was — but the pattern of a commodity-shock-driven re-rating of long-duration assets is not something the 2020s crop of investors has lived through.
The S&P 500 at 23x forward earnings, with 10-year yields at 4.30% and Brent above $100, is a combination that history suggests is not stable. Either earnings estimates move up faster than the consensus now projects (unlikely with guidance softening) or multiples come in. The quiet way for this to resolve is a 5-8% chop through the summer while earnings catch up. The loud way is a sharper revaluation triggered by a supply-side shock. Either way, the coming six weeks — encompassing the FOMC, peak earnings season, and a European political calendar that will decide whether Hormuz remains geopolitical tinder — are the pivot. Position accordingly.
Daily Financial Brief · Compiled April 23, 2026 · For informational purposes only.
Friday, April 24, 2026 • Morning Edition • 9:30 AM EST
THE MORNING SETUP
Markets head into Friday's session with the most combustible setup of the year: a blockbuster earnings beat from an unlikely hero, Intel, colliding with a Middle East standoff that refuses to resolve and an oil market that has decided, for now, to price in disruption rather than diplomacy. U.S. equity futures are pointing modestly higher — S&P 500 futures last traded up about 0.4% — almost entirely on the back of Intel's thirty-percent pre-market surge after the chipmaker delivered its strongest quarter in nearly a decade. Beneath that bid, however, the tape is uneasy. Brent has punched above $107, WTI above $97, and the Strait of Hormuz remains effectively choked by an undeclared naval blockade that has now shut off the world's single most important oil artery for eight consecutive trading days. The VIX, at 19.3, is higher than you'd expect for a market this close to record highs — a tell that investors are hedging, not celebrating. Today's calendar brings durable goods and the University of Michigan sentiment final, both likely to be dwarfed by a pair of earnings (Procter & Gamble, Colgate-Palmolive) and the ongoing question the bond market is trying to answer: is $105 oil a growth scare or an inflation scare? So far, it's both.
MARKETS AT A GLANCE
U.S. Equity Futures (as of 8:15 a.m. ET)
Instrument
Level
Change
Note
S&P 500 futures
7,138.25
+0.42%
Bid on Intel blowout
Nasdaq 100 futures
26,080.10
+0.61%
Chip strength leads
Dow futures
49,515
+0.21%
PG premarket +4%
Russell 2000 futures
2,364.40
+0.15%
Small caps flat
Prior U.S. Close (Thursday, April 23)
Index
Close
Change
Note
S&P 500
7,108.40
-0.41%
Software-led pullback
Nasdaq Composite
24,438.50
-0.89%
IBM, NOW drag
Dow Industrials
49,310.32
-0.36%
-179.71 points
Russell 2000
2,361.85
-0.54%
Breadth poor
VIX
19.31
+2.06%
Creeping higher
Asia Close (Friday, April 24)
Index
Close
Change
Note
Nikkei 225 (Japan)
59,716.18
+1.00%
Tech bid on Intel halo
Hang Seng (HK)
25,976.65
+0.20%
Reversed early loss
Shanghai Composite
4,090.48
-0.10%
Thin, rangebound
Kospi (Korea)
6,475.63
~flat
Samsung, SK Hynix mixed
ASX 200 (Australia)
8,786.50
-0.10%
Oil majors lift energy
Europe (Early Trade)
Index
Level
Change
Note
FTSE 100 (UK)
9,486.20
-0.72%
Miners offset by BP/Shell
DAX (Germany)
22,914.85
-0.05%
Flat; Siemens leads
CAC 40 (France)
8,294.11
-0.58%
Luxury weak
Euro Stoxx 50
5,612.40
-0.60%
Risk-off skew
Rates, Credit & FX
Instrument
Level
Change
Note
US 2Y yield
3.79%
+2 bps
Fed-hold repricing
US 5Y yield
4.05%
+3 bps
Belly leading selloff
US 10Y yield
4.30%
+4 bps
Oil-inflation impulse
US 30Y yield
4.92%
+5 bps
Long end under pressure
2s10s spread
+51 bps
+2 bps
Steepening resumes
IG CDX
62 bps
+1 bp
Tight but widening
HY CDX
341 bps
+6 bps
Risk premia rising
DXY
98.58
+0.15%
Two-week high
EUR/USD
1.0842
-0.18%
Euro soft on growth
GBP/USD
1.2616
-0.22%
BoE cut bets building
USD/JPY
156.94
+0.11%
Carry reasserting
USD/CNY
7.2790
+0.05%
PBoC anchor holds
Commodities & Crypto
Instrument
Level
Change
Note
WTI crude
$97.71
+1.9%
Hormuz choke
Brent crude
$107.38
+2.2%
Above $105 resistance
Nat gas (Henry Hub)
$2.66/MMBtu
-0.4%
Multi-year low
Gold
$4,738.53/oz
-0.3%
Consolidating near highs
Silver
$52.14/oz
-0.6%
Profit-taking
Copper
$6.10/lb
+0.4%
China-growth bid
Wheat
$6.24/bu
-0.2%
Harvest pressure
Bitcoin (BTC)
$78,126
+1.1%
24h: +2.3%
Ethereum (ETH)
$2,353
+0.9%
24h: +1.7%
TOP STORIES
1. Intel Stuns With Blowout Quarter, Stock Surges 30% Pre-Market
Intel delivered the earnings surprise of 2026. The struggling chipmaker — written off by most of Wall Street as recently as last autumn — reported first-quarter adjusted EPS of $0.29 versus the $0.01 consensus, on revenue of $13.58 billion against a $12.42 billion forecast. Data-center revenue climbed 22% year-over-year to $5.1 billion, the single most important line item in the report: it is the first unambiguous evidence that Intel is participating in the AI-driven CPU cycle it has spent three years claiming was coming. Guidance was the rocket fuel. Intel forecast Q2 revenue of $13.8–$14.8 billion and EPS of roughly $0.20, both well above Street estimates.
Shares closed up 9% regular session and then tacked on another 20% in after-hours trade. By 7:30 a.m. ET Friday, the stock traded near $87.09, up roughly 30% and on course to open at an all-time high. The read-through is not subtle: for the first time since the Pat Gelsinger era began, Intel is capturing incremental AI-server budget rather than surrendering it to AMD and Nvidia. Expect a wave of analyst upgrades and meaningful short-covering through Friday. Watch: $90 as the technical breakout level; $95 is the next resistance. The broader semiconductor complex — SOX, SMH — is indicated up 2–3% pre-market.
2. Strait of Hormuz Remains Shut as U.S.-Iran Ceasefire Frays
The Iran ceasefire, technically still in force, is no longer a market positive. Shipping through the Strait of Hormuz has collapsed: only five vessels transited in the last 24 hours, one of them an Iranian oil products tanker. President Trump ordered the Navy to "shoot and kill" any Iranian vessels laying mines, while Tehran has seized two commercial ships and declared the U.S. naval presence the "main obstacle" to restarting talks. Trump, asked Thursday evening about a timetable, told reporters "don't rush me."
The number to watch is not the headline — it is the tanker traffic count. Roughly 20% of global seaborne oil, and nearly all of Qatar's LNG, normally transits Hormuz. Every additional day of disruption tightens physical crude balances by an estimated 1.5–2 million barrels per day. Traders currently price a four-to-six-week disruption; if it runs longer, $120 Brent is the consensus next stop. Separately, Trump announced a three-week extension of the Israel-Lebanon ceasefire, the one piece of Middle East good news on the tape this morning.
3. Oil Markets Enter Second Week Above $100
Brent has now closed above $100 for eight consecutive sessions, the longest such streak since the 2022 post-invasion spike. WTI is approaching $98. The move is no longer purely geopolitical: OPEC+ has signaled it is in no rush to add barrels, U.S. Strategic Petroleum Reserve releases have been paused, and Gulf of Mexico hurricane-season pre-positioning has begun. Refining margins — particularly gasoline cracks — are widening, which historically precedes pump-price pass-through by four to six weeks.
The macro knock-on is meaningful. Each sustained $10 move in Brent adds roughly 15–20 basis points to headline CPI. With March CPI already at 3.3% year-over-year (up from 2.4% in February), a full quarter at $105 Brent would push headline inflation back above 4% by the July print. That is the single most important macro variable for the Fed meeting next Wednesday. Watch the five-year, five-year inflation breakeven, last at 2.48% — anything above 2.55% is the tripwire for a meaningfully more hawkish Powell press conference.
P&G's fiscal third-quarter print is the most important consumer-staples read of the season. EPS of $1.59 adjusted beat the $1.56 estimate; revenue of $21.24 billion beat $20.50 billion expected. The line that matters: total volume grew 2%, ending four straight quarters of volume declines. For the entire staples complex — KO, CL, CHD, KMB, EL — volume has been the single greatest overhang, as price-led revenue growth ran out of road.
P&G raised the lower end of its full-year organic sales guidance to 2–4% from 1–3%, and shares are up about 4% pre-market. The ripple effects should lift Colgate-Palmolive (reporting this morning before the open), Church & Dwight, and Kimberly-Clark. Broader implication: if even one of the price-elasticity canaries is recovering, the Fed's disinflation path is not as linear as it was three months ago. Watch XLP relative to SPY; staples have been a relative laggard and could finally catch a bid.
5. Treasury Long End Cracks as Inflation Expectations Re-Rate
The 30-year Treasury yield closed at 4.92% on Thursday, within a whisker of the 5% psychological level that cracked equity sentiment last autumn. The move — up five basis points yesterday and 23 basis points over the past two weeks — is being driven almost entirely by the term premium, not by rate-cut repricing. The 2-year yield at 3.79% has barely moved. This is a classic bear-steepener, and historically a poor setup for long-duration equity.
The MOVE index, which measures Treasury volatility, has climbed to 98 from 82 at month-start. Dealers point to two proximate causes: rising oil-driven inflation expectations, and growing concern about fiscal deficits as the administration telegraphs new tariff-revenue spending programs. Next week's $69 billion 2-year, $70 billion 5-year, and $44 billion 7-year auctions will be closely watched. A sloppy long-end auction is the single most likely catalyst for a 3–5% equity drawdown into the FOMC.
6. China Q1 GDP Surprises, But Stimulus Off the Table
China reported Q1 GDP growth of 5.0% year-over-year, accelerating from 4.5% in Q4 and beating the 4.8% consensus — the fastest rate in three quarters. Exports remained the primary driver, with AI-related global demand offsetting continued property-sector drag. The People's Bank of China left benchmark lending rates unchanged for the 11th consecutive month, confirming a policy stance that prioritizes yuan stability and financial-system discipline over short-term stimulus.
For U.S. investors, the read-through is mixed. Strong China growth supports the commodity-linked trade (copper, iron ore, LNG demand) and helps multinational industrials like Caterpillar and Deere. But the absence of stimulus limits upside for the China-consumer names — Apple, LVMH, Estée Lauder — whose thesis has required a Beijing-driven consumption recovery that keeps failing to materialize. FXI and KWEB are underperforming EFA by 200 basis points year-to-date despite the GDP beat.
MACRO & FED WATCH
The Federal Reserve meets next Tuesday and Wednesday (April 28–29) for what is shaping up to be the most consequential FOMC since March. Futures markets price a 99.4% probability of no change to the 3.50%–3.75% target range, and Chair Powell is all but certain to hold. The action is in the dot plot and, more importantly, the press conference. As of Thursday's close, Fed funds futures imply just 11 basis points of cuts for full-year 2026 — down from 42 basis points priced at the start of April, and 75 basis points at year-start. The December meeting is the only one with a non-trivial cut probability, and even there the market assigns just 26% to a 25 basis-point move.
The driver is inflation. March CPI surprised hot at 3.3% year-over-year, up from 2.4% in February, with energy the dominant contributor. The Cleveland Fed's Nowcast is tracking April headline CPI at 3.5% and core at 3.1% — well above the Fed's 2% target, and rising. The Michigan sentiment survey out today, with its early April preliminary crash to 47.6 (a historic low), will be closely parsed for inflation expectations: the five-year measure jumped to 4.1% in the preliminary, the highest since 1993. A confirmation of that figure would make a June cut functionally impossible and push the cycle's next easing into Q4 at earliest.
The yield curve is telling a nuanced story. The 2s10s has re-steepened to +51 basis points from inverted territory in early 2025, suggesting the market expects the Fed to eventually cut — but not soon, and not by much. Credit spreads remain benign (IG 62 bps, HY 341 bps), which is the single most important signal that recession risk is not being priced. Watch Powell's press conference Wednesday for any language change around "sufficiently restrictive" — a downgrade to "modestly restrictive" would effectively close the door on 2026 cuts entirely.
ECONOMIC CALENDAR — TODAY
Time
Release
Prior
Consensus
Why It Matters
8:30 a.m. ET
Durable Goods Orders (Mar)
-6.3%
+2.0%
Aircraft-driven bounce; core critical
8:30 a.m. ET
Core Durable Goods ex-Transport
+0.4%
+0.2%
Capex proxy — watch business investment
8:30 a.m. ET
Core Capital Goods Orders
-0.1%
+0.2%
Best real-time capex signal
10:00 a.m. ET
Michigan Sentiment (Apr Final)
47.6 (prelim)
48.0
Historic low; 5Y inflation expectation key
10:00 a.m. ET
Michigan 1Y Inflation Expectations
6.7% (prelim)
6.5%
Highest since 1981 if confirmed
10:00 a.m. ET
Michigan 5Y Inflation Expectations
4.1% (prelim)
4.0%
Highest since 1993 — Fed watches closely
1:00 p.m. ET
Baker Hughes U.S. Rig Count
589
—
Drilling response to $100+ oil
EARNINGS WATCH
Today's Friday tape is dominated by consumer staples and a handful of mid-cap industrials. Pre-market reports already out: Procter & Gamble (PG) beat with EPS of $1.59 vs. $1.56 consensus and revenue of $21.24 billion vs. $20.50 billion, shares up 4% pre-market — volume grew 2%, the first positive print in four quarters. Colgate-Palmolive (CL) is expected to post EPS of $0.95 (up 4.4% YoY) on revenue near $5.1 billion; options imply a 3.2% move. AutoNation (AN) reports with estimates of $4.16 EPS; used-car commentary will be closely read as a consumer-health tell.
After-hours is quieter by design: reporting-season heavyweights fall Monday through Thursday next week. But the Thursday-after-close digest of Intel's blowout and Tesla's solid Tuesday beat ($0.41 EPS vs. $0.37; revenue $22.39 billion vs. $21.92 billion; gross margin 21.1% up 478 basis points year-over-year) has reset expectations for the Magnificent 7 reports coming Wednesday.
The season-to-date setup is constructive. With roughly 10% of S&P 500 companies reported, blended earnings growth is tracking 13.2% year-over-year — on pace for a sixth consecutive quarter of double-digit growth. 88% of reporters have beaten EPS estimates, well above the 78% five-year average. Information Technology leads with estimated +45% growth; Materials +24%; Financials +15%. Healthcare drags at -9.8%, largely a Merck one-time acquisition charge. The Magnificent 7's estimated +22.8% earnings growth is still materially ahead of the other 493 names' +10.1% — the narrowness that defined 2024–25 is intact, for now.
SECTOR SPOTLIGHT
Two sectors warrant close attention today. First, Semiconductors. Intel's 30% pre-market move is a genuine regime change: the market is being forced to re-rate the idea that AI-CPU demand is a one-name Nvidia story. Expect SMH and SOX to open up 2–3%, with potential follow-through in AMD (the near-term share-donor), Broadcom, and Marvell. The short interest in INTC — 6.2% of float entering the print — adds fuel; a full unwind could add another 4–6% to the move by the close.
Second, Consumer Staples. P&G's volume breakout is the most-watched event in this sector since 2022. Staples have been the worst-performing S&P sector year-to-date (-1.8% vs. SPX +6.4%) on fears that price-elasticity-at-last would force guidance cuts. A clean 2% volume print at P&G refutes that thesis. XLP has notable relative-strength coiling: a close above $82.50 opens a path to $86 into summer. Names with the most operating leverage to volume recovery: KMB, CHD, CL, and EL (which has been particularly battered).
ANALYST CALLS & UPGRADES / DOWNGRADES
Firm
Stock
Action
Price Target
Rationale
BofA
Texas Instruments (TXN)
Upgrade Buy
$320 (from $235)
AI-edge cycle underappreciated
BMO
W.R. Berkley (WRB)
Upgrade Mkt Perform
$68 (from $64)
Reserves adequately topped up
HSBC
Intel (INTC)
Prior Upgrade
Confirmed post-earnings
Server CPU share gains
BNP Paribas
Intel (INTC)
Prior Upgrade (pre-earnings)
Reiterated
AI-server momentum
Morgan Stanley
CSX Corp (CSX)
Downgrade Underweight
$30
Volume visibility limited
BMO
ASGN Inc. (ASGN)
Downgrade Mkt Perform
$33
Staffing cycle weakening
JP Morgan
Avis Budget (CAR)
Downgrade Underweight
$165 (PT raised)
Fleet-value mean reversion
HSBC
TE Connectivity (TEL)
Downgrade Hold
$234
Valuation fully reflects cycle
Piper
Investar Holding (ISTR)
Downgrade Neutral
$31.50 (from $34)
NIM pressure
STOCKS TO WATCH
Intel (INTC) — $87 pre-market, +30%
The single most important stock on the tape today. If INTC holds $85 into the close, the post-earnings gap is unlikely to fill and this becomes the breakout setup of the quarter — $95 is the measured move, $110 the 2022 high. Watch options flow: the April 25 $80 calls, which were bought heavily last week, will see enormous gamma unwind. Risk is not the print; it's the 30% gap itself, which historically gives back a third of the gain inside 48 hours. Suggested level: pullbacks to $82–83 are likely bought.
Exxon Mobil (XOM) — $142.10
The simplest way to express the Hormuz-risk trade. XOM reports next Friday; with Brent at $107, analyst estimates are meaningfully too low. Consensus Q1 EPS is $2.04 — a repeat of Q4's conditions would deliver closer to $2.35. Technical setup: $140 is breakout support, $150 is the late-2022 high. The dividend yield of 3.7% plus an active buyback provides a floor. Watch relative performance to CVX — XOM's Permian leverage is structurally superior at $100+ oil.
Procter & Gamble (PG) — $169.50 pre-market, +4%
The volume breakout re-rates the whole defensive complex. $170 has been resistance for seven months; a close above opens a clean technical path to $185. Fundamentals support it: Q3 volume +2%, guidance raised, FX headwinds fading with DXY topping. The pair trade: long PG / short XLY, expressing a view that staples' relative laggard status is ending and discretionary is priced for a consumer that is about to feel $4 gasoline.
CSX Corporation (CSX) — $29.80, pre-market -1.8%
Morgan Stanley's downgrade to Underweight with an unchanged $30 price target effectively marks the stock's ceiling. Rail volumes are softening (intermodal down 3.4% YTD), and the coal tailwind that helped Q4 is fading. Earnings April 29. Key level: $28 is the 200-day moving average; a break invites a quick move to $26. The broader transport complex (IYT) has been the quietest leadership-failure story of 2026 — a CSX miss could crack it open.
GLOBAL MACRO SNAPSHOT
China: Q1 GDP of +5.0% YoY beat forecasts but did not trigger stimulus; PBoC holds lending rates for the 11th straight month. Industrial profits data due next week will sharpen the picture on whether the export-led rebound can survive U.S. tariff escalation. CNY at 7.28 is stable-to-firming — Beijing is clearly prioritizing currency over growth-juicing.
Europe: the ECB's April meeting last week delivered a dovish hold, with President Lagarde explicitly flagging Middle East oil risks. Eurozone composite PMI for April (prelim out Wednesday) will be critical; consensus is 51.2, and anything below 50 re-opens the cut conversation. Bund yields have decoupled from Treasuries, with 10Y Bunds up just 1 bp against Treasuries' +4, a reliable signal that capital is considering a rotation.
Emerging Markets: the EMB/EMLC complex is quietly outperforming U.S. duration year-to-date, with Brazil (SELIC 11.50%) and Mexico (11.00%) offering positive real yields the developed world cannot match. Turkey has hit the 50% policy rate threshold Erdoğan long resisted; TRY stability is the single best EM-FX surprise of 2026. Commodity EM (Chile, Peru) benefits directly from copper's resilience.
WEEK AHEAD PREVIEW
Monday, April 27: Dallas Fed manufacturing. Earnings: Waste Management, Brown & Brown.
Tuesday, April 28: Conference Board Consumer Confidence (consensus 91.5 vs. prior 92.9); JOLTS job openings (consensus 7.75M). FOMC meeting Day 1 (no announcement). Earnings: Amazon (previously scheduled — now Wednesday), Visa, Pfizer, Starbucks, Booking Holdings.
Wednesday, April 29: Q1 advance GDP (consensus +1.7% SAAR vs. prior +2.4%); pending home sales. FOMC decision 2:00 p.m. ET, Powell press conference 2:30 p.m. The big one. Earnings after close: Microsoft, Alphabet (Google), Meta Platforms — the three most-watched prints of the season.
Thursday, April 30: Core PCE deflator (consensus +0.3% MoM, +2.8% YoY); Employment Cost Index Q1; initial claims. Earnings: Apple (the Magnificent 7's anchor), Amazon, Mastercard, Eli Lilly. Friday, May 1: Nonfarm payrolls (consensus +162K; unemployment 4.1%); ISM Manufacturing. A 36-hour window spanning FOMC + GDP + PCE + five Magnificent 7 prints + payrolls is the densest macro-and-earnings cluster of the year. Expect realized volatility to run 20–30% above implied.
CLOSING THOUGHT
Here is a risk the tape is not adequately pricing: the Fed is running out of room to be patient on inflation, and equity markets are trading as if March's 3.3% CPI print was a blip. It was not. The structural forces pushing inflation higher — deglobalization, tariff pass-through, reshoring capex, an oil shock that is no longer transitory — are all accelerating, not fading. The last time the 10-year Treasury yield was rising alongside oil while the S&P 500 sat within 1% of an all-time high was October 2018. Readers will recall what happened next. This is not a prediction; it is a reminder that the correlation regime of 2023–24 (equities up on every yield spike because earnings kept bailing the market out) has a shelf life. With forward P/Es at 22.5x — a level only exceeded during the 1999 and 2021 tops — the equity market's margin for error on inflation has compressed to roughly zero. Watch the 5Y5Y breakeven and the 30-year auction next week. If both go the wrong way, April's highs will be the highs for a while. Trade accordingly.
Prepared 24 Apr 2026 • For informational purposes only • Not investment advice
DAILY FINANCIAL BRIEF
Monday — April 27, 2026
Markets, macro, and the morning's most important moves
1. The Morning Setup
Markets enter the busiest week of earnings season on edge — but for once, the world's largest companies aren't the main event. Crude oil is what's moving the tape. Brent surged above $107 a barrel in early Monday trading and West Texas Intermediate climbed toward $96 after President Trump abruptly cancelled the weekend peace mission to Islamabad, leaving the Strait of Hormuz blockade in place for a ninth straight week and the largest energy supply shock on record still unresolved.
U.S. equity futures slipped modestly — S&P 500 contracts off 0.22%, the Nasdaq 100 down 0.16%, the Dow off a quarter point — even as Asia powered higher, with the Nikkei ripping 2.4% to a fresh record. Beneath the surface lies a fragile stand-off: a market priced for perfection on tech earnings, a Federal Reserve that begins a two-day meeting tomorrow, and an oil shock now actively embedding itself into inflation expectations.
Five of the Magnificent Seven report between Wednesday and Thursday. Q1 GDP and the March PCE deflator print that same window. The 10-year Treasury yield is back to 4.34%, the dollar is bid as a haven, gold is paradoxically lower as real yields rise, and the VIX — at 19 — looks complacent against the catalyst load. Brace for whiplash.
2. Markets at a Glance
Snapshot at 8:00 AM ET. Futures levels are front-month contracts. % changes vs. prior session close unless noted.
Instrument
Level
Change
Note
US EQUITY FUTURES (pre-open)
S&P 500 (Jun)
7,179.00
−0.22%
Off Friday's record
Nasdaq 100 (Jun)
27,390.50
−0.16%
Mag 7 in focus
Dow Jones (Jun)
49,271.00
−0.24%
Defensives rotate
Russell 2000 (Jun)
2,341.20
−0.31%
Yield-sensitive
PRIOR US CLOSE (Friday, Apr 24)
S&P 500
7,165.08
+0.50%
4th straight weekly gain
Nasdaq Composite
23,512.40
+0.61%
Tech relentless
Dow Industrials
49,389.00
+0.34%
Caboose, but green
VIX
19.03
+1.71%
Calm, all things considered
ASIA CLOSE
Nikkei 225
59,518.34
+2.38%
Fresh record close
Hang Seng
23,147.00
+0.94%
Tech, banks lead
Shanghai Composite
4,055.55
+0.70%
Politburo eyed Apr 30
Kospi
3,118.20
+1.12%
Samsung, SK Hynix bid
ASX 200
8,612.40
+0.45%
Energy, miners firmer
EUROPE (intraday)
Stoxx Europe 600
568.70
+0.55%
Banks +1.2% pre-prints
FTSE 100
8,914.40
+0.41%
Energy bid
DAX 40
23,810.50
+0.62%
Defense, autos firm
CAC 40
8,278.30
+0.58%
Luxury stable
U.S. TREASURIES
2-Year yield
3.83%
+2 bps
Front-end glued to FOMC
5-Year yield
4.04%
+3 bps
Belly cheapens on oil
10-Year yield
4.34%
+4 bps
Term premium back
30-Year yield
4.86%
+4 bps
Bear-steepening
CURRENCIES
Dollar Index (DXY)
98.62
+0.18%
Safe-haven bid
EUR/USD
1.0832
−0.20%
ECB Thu, slips
GBP/USD
1.3478
−0.16%
BoE Thu
USD/JPY
153.41
+0.34%
BoJ Tue, yen heavy
USD/CNY (offshore)
7.218
+0.10%
PBoC fix steady
COMMODITIES
WTI crude (Jun)
$95.80
+1.48%
Hormuz risk premium
Brent crude (Jun)
$106.99
+1.55%
Above $107 intraday
Natural gas (Jun)
$2.52
−3.60%
Mild weather, oversupply
Gold (Jun)
$4,693
−0.40%
Real yields up, oil up
Silver (Jul)
$76.40
+0.70%
Industrial bid
Copper (Jul)
$4.92/lb
+0.55%
Growth proxy steady
CRYPTO
Bitcoin (BTC)
$78,670
+1.36%
Reclaims $79K intraday
Ethereum (ETH)
$2,370
+2.22%
Sentiment shifts to neutral
CREDIT (option-adjusted spreads)
IG corporate (BAML)
82 bps
Flat
Near 25-year tights
HY corporate (BAML)
278 bps
+4 bps
BB 175, CCC 720
3. Top Stories
Trump cancels Iran mission; Hormuz stays shut into week nine
Saturday's last-minute scrubbing of Steve Witkoff and Jared Kushner's flight to Islamabad was the third diplomatic collapse of the nine-week conflict, and the most consequential. Iran's foreign minister, who had already arrived in Pakistan, departed for Moscow within hours; Trump told reporters that Iran 'offered a lot, but not enough.' Brent crude, which had drifted lower last week on hopes of a breakthrough, gapped back above $107 overnight.
The mechanics now matter more than the rhetoric. Roughly one-fifth of seaborne oil and a quarter of LNG normally transit Hormuz; the IEA last week called the cumulative disruption 'the largest energy supply shock on record.' Saturday's tracking by Windward showed only 19 commercial vessels transiting the strait — a fraction of the typical 60 — and shipping insurers have effectively withdrawn cover for non-aligned flags. Each week the closure persists adds roughly 30–50 bps to year-ahead U.S. inflation expectations, by Goldman's running estimate.
Market implication: the energy complex is no longer trading a peace dividend. Refiners (PSX, VLO, MPC) and integrateds (XOM, CVX) have been the trade of the quarter, and Friday's options activity in XOM May $135 calls suggests positioning for further upside. Watch for any signal of reciprocal escalation — Iranian missile activity in the Gulf or a U.S. naval move on Bandar Abbas — that could send Brent toward the $115–$120 risk-premium zone strategists have been modeling.
The Mag 7 earnings avalanche begins Wednesday
Five of the Magnificent Seven — Microsoft, Alphabet, Meta and Amazon on Wednesday after the close, Apple on Thursday — report into a market that has rerated relentlessly higher since the April low. Together these names account for roughly 31% of the S&P 500's market capitalization and well over 40% of expected 2026 earnings growth; the FactSet blended Q1 growth rate just stepped up to 15.1% with 84% of reporters beating on EPS, well above the 10-year average of 76%.
Analyst consensus has Microsoft delivering $4.07 EPS on $81.4B in revenue (+17.6% / +16.2% YoY); Meta at $6.64; Amazon at $1.65; Apple at $1.95. The questions are uniform across the cohort: capex guidance, AI monetization signals (Copilot ARR, Meta's Advantage+ ad lift, Google Cloud GPU backlog) and the China demand picture. Implied moves on the Friday options chain are running 4.5%–7% — the high end since 2022.
Watch for: gross-margin compression at the cloud hyperscalers as the FY26 GPU build-out crests; any sign that Apple's Services revenue is softening alongside iPhone unit declines; and Amazon's AWS run-rate, where bulls expect a re-acceleration to 20%+ y/y after a cycle of optimization. A clean sweep extends the breadth-anemic rally; a single miss in this group could puncture sentiment that has carried the index to four straight weekly highs.
FOMC begins; markets price 95% hold, but it's all about the dots in June
The Federal Open Market Committee convenes Tuesday and announces Wednesday at 2:00 PM ET. CME FedWatch implies a 94.8% probability of a hold at the current 4.25%–4.50% target range, where the rate has sat since December 2024. The interesting question is what Powell signals about the dot plot at the June refresh, given a stagflationary cocktail no one anticipated three months ago: oil up 35% YTD, headline CPI tracking 3.6%, but the Atlanta Fed GDPNow estimate for Q1 down to 1.4%.
Fed funds futures still price one to two cuts by year-end, concentrated in September and December. The 2s/10s curve, at +51 bps, has steepened 18 bps since the Iran conflict began, classic late-cycle term-premium repricing rather than recession signaling. Powell's challenge Wednesday is to acknowledge the supply shock without endorsing a near-term easing path the data don't yet support.
Market implication: any hawkish surprise in the statement language — a stronger acknowledgment of energy pass-through, a hint that the cuts already priced are excessive — would lift the dollar and steepen the curve further. Conversely, a dovish nod to softening growth would re-anchor the front end and revive duration trades. The 2-year note auction at 1 PM ET today, $69B, is the first read on demand.
European banks set up the continent for a defining week
The Stoxx 600 ground higher 0.5% in early London trade with banks +1.2%, the standout sector ahead of a flurry of European prints that begins Wednesday: Barclays, Deutsche Bank, BNP Paribas, UBS, Santander and BBVA all report this week. After three years of margin tailwinds from positive deposit rates, European lenders face the inflection: ECB on Thursday is expected to hold at 2.25%, but the curve and fee-income outlook now matter more than NII.
UBS will get particular scrutiny on its Credit Suisse integration milestones and capital return; Deutsche on its investment-banking trajectory after a punishing 2025; Barclays on the U.S. consumer-credit book that has become its swing factor. European banks trade at 0.85x book on average, against U.S. peers at 1.25x — the widest gap since 2014.
Watch for: any flagging of credit deterioration in commercial real estate in Germany or Italy. The ECB's bank lending survey, due Tuesday, is the macro tell. A clean print would help close the U.S./Europe valuation gap; a single CRE-related charge could reopen it.
Bitcoin reclaims $79K as Fear & Greed flips to neutral
Bitcoin opened the U.S. session near $78,670, up 1.4% on the day, with the Fear & Greed Index moving to 47 (Neutral) from 33 (Fear) Friday. Total crypto market cap pushed back to $2.71 trillion. The proximate catalyst is reduced macro stress: stalled Iran talks notwithstanding, the dollar's safe-haven bid has been less aggressive than the early-April spasm, and ETF flows turned mildly positive into the weekend.
Underneath the price action, the structural story is unchanged. The post-halving supply tightening is past peak, miner break-evens are rising with energy costs, and the next technical pivot is the prior all-time high near $84K. Ethereum's $2,370 print represents a 2.2% session gain but still leaves ETH/BTC at three-year lows.
Regulatory backdrop matters more than usual this week: the SEC under Atkins is expected to issue final ETF generic-listing guidance, which would open the door to spot Solana and XRP products. Confirmation of that timeline could untether alt-coin flows from the BTC tape for the first time in a year.
Cadence and Nucor open the tape after the close
Today's main event after the bell is Cadence Design Systems (CDNS), the EDA software bellwether and a clean read on chip-design spend. Consensus has Q1 EPS of $1.89 on revenue of $1.46B (+16.4% YoY), with company guidance of $1.89–$1.95. The MSC Software acquisition (closed February) starts contributing this quarter and the read across to Synopsys, Ansys and Arm is direct. Implied move into the print is roughly 5.8%.
Also after-hours: Nucor (NUE), expected to deliver $2.81 EPS on $8.82B revenue. The steel margin trajectory matters less than commentary on Section 232 tariff exemptions and any framing of the auto/non-resi construction order book heading into the back half. Nucor has fallen ~9% YTD against an S&P up 4%; a clean beat would help reset the cyclicals trade.
Pre-market action was dominated by Domino's Pizza (DPZ): consensus $4.28 EPS, $1.17B revenue. The company posted $4.13 — a 4.6% YoY miss, with U.S. comparable sales softer than feared. Shares were indicated 6% lower in the pre-market and the read for the QSR group, particularly into Starbucks tomorrow, is incrementally negative.
4. Macro & Fed Watch
The Federal Reserve enters its April 28–29 meeting with a problem it didn't have a quarter ago: an oil shock layered over an economy that was already cooling. Headline CPI in March printed 3.5%, with shelter still sticky and goods disinflation now reversing for the first time in two years. The Atlanta Fed GDPNow tracker shows Q1 growth at 1.4% — Thursday's advance read will tell us whether that has further to fall. Treasury markets have responded by bear-steepening: the 2-year is back to 3.83%, the 10-year to 4.34%, and the 30-year to 4.86%, with most of the move concentrated at the long end on rising term premium rather than rising rate-cut expectations.
CME FedWatch prices a 94.8% probability of a hold this week, and the September meeting is now the first with materially better-than-even odds of a cut. The full-year curve implies one to two 25 bp moves by December — fewer than the three signaled in March, more than the zero some hawks have argued for. The June dot plot will be the next defining moment; it lands the same week as May CPI. Powell's Wednesday press conference will be parsed for two signals: how he frames the energy passthrough into core inflation expectations (a concession that they're 'less anchored' would be the hawkish read) and how he characterizes the labor market, where last week's continuing claims at 1.81 million were the highest since November 2021.
Globally, the Bank of Japan also meets Tuesday with the yen near 153.4 — Governor Ueda is widely expected to maintain the 0.50% policy rate but signal a July hike if wage data hold. The Bank of Canada announces Wednesday with a cut in the conditional set. The ECB on Thursday is the cleanest hold in the G7. The Bank of England Thursday is split: 6–3 hold-versus-cut is the consensus. Add it up and global rate divergence is widening, which has supported a renewed dollar bid into this week despite the U.S. growth concerns — itself a pro-cyclical pressure on emerging markets and a headwind to U.S. multinational earnings translation that the Mag 7 will have to address.
5. Economic Calendar — Today
Time (ET)
Indicator
Prior
Consensus
Why it matters
10:30 AM
Dallas Fed Mfg Index (Apr)
−0.2
−1.5
Tariff & oil pass-through to factories
11:30 AM
3M & 6M Treasury auctions
—
—
Front-end demand gauge into FOMC
1:00 PM
2-Year Note auction ($69B)
3.815%
—
Tests FOMC pricing
—
Fed speakers
—
—
Quiet — FOMC media blackout in effect
—
Earnings (AMC)
Cadence, Nucor, F5, Brown & Brown
—
Tape-setters for the week
Light Monday by design. Tuesday is the heavy hitter: BoJ decision overnight, Conference Board Consumer Confidence (10 AM ET, consensus 94.5 vs. 92.9 prior) and JOLTS Job Openings (10 AM ET).
6. Earnings Watch
This is the busiest week of the Q1 reporting season. Roughly 180 S&P 500 companies — a third of the index — report Monday through Friday, including five of the Magnificent Seven. Coming in, the FactSet blended Q1 growth rate has stepped up to 15.1%, the sixth straight quarter of double-digit earnings growth, and 84% of the 28% who have already reported beat on EPS — the strongest beat rate since Q3 2021. Aggregate beats are running 12.3% above estimates, well above the 7.3% five-year average. Information Technology, Materials and Financials lead; Health Care is the lone material laggard.
Today's slate is the appetizer. Pre-market: Domino's (DPZ) missed at $4.13 vs. $4.28 — see Top Stories. Verizon (VZ) is expected to deliver $1.15 EPS / $33.5B revenue with focus on net adds and free cash flow guidance reaffirmation. Public Storage (PSA), AvalonBay (AVB) and Ventas (VTR) provide the REIT read into Welltower tomorrow. Cincinnati Financial (CINF) on commercial-lines pricing, Universal Health (UHS) on hospital labor costs.
After the close, the marquee names are Cadence Design (CDNS) at $1.89 EPS / $1.46B revenue, with implied move 5.8%; Nucor (NUE) at $2.81 / $8.82B; F5 Networks; Brown & Brown; Alexandria Real Estate (ARE); and Amkor Technology (AMKR), an OSAT name that will give a tactical read for next year's iPhone build before AAPL on Thursday.
Sector context: with Q1 setting up to print mid-teens growth, the bar for Q2 (consensus +20.6%) and 2026 full year (+18.6%) is towering. Margins are the swing variable. Last week's S&P 500 net margin estimate ticked down 10 bps to 12.7% on rising input costs; another 20 bps of compression would shave roughly $5 from forward EPS — enough to keep the index's 22.5x forward multiple uncomfortable.
7. Sector Spotlight
Energy: from laggard to leader, in nine weeks
Energy is the trade of the year. The S&P 500 Energy sector is +18.7% YTD against a +4% benchmark, the second-best four-month run since 2008. The setup since the Iran conflict began has been almost too clean: integrateds first (XOM +21%, CVX +18% over the period), then refiners on widening crack spreads (PSX +29%, VLO +24%), then services (SLB +14%, HAL +10%) as rig counts ticked up despite hedged producer guidance.
The risk now is that the move has gone parabolic. Aggregate energy short interest is at a six-year low, and crowdedness scores from prime brokerages are elevated. Today's Morgan Stanley upgrade of Phillips 66 to Overweight with a $174 target — published into strength — is the kind of late-cycle analyst affirmation that historically marks intermediate tops. Conversely, if Hormuz stays closed through the second half and Brent settles into a $105–$115 range, free cash flow yields above 12% on the integrateds remain the most defensible income profile in the index.
8. Analyst Calls & Upgrades / Downgrades
Firm
Stock
Action
Price Target
Rationale
Morgan Stanley
PSX
Upgrade — Equal Wt → Overweight
$147 → $174
Refining margins to widen on Hormuz disruption
Morgan Stanley
CSX
Downgrade — Equal Wt → Underweight
$30 (held)
Valuation; ~35% downside; intermodal softening
KBW
BFH
PT raise (maintain Outperform)
$100 → $115
Strong Q1 beat; net charge-offs improving
UBS
WING
PT cut (maintain Neutral)
$295 → $210
Same-store sales deceleration; valuation reset
Wells Fargo
BA
Reiterate Overweight
$240 (held)
MAX 10 timeline supports 2H delivery ramp
Goldman Sachs
XOM
Reiterate Buy, Conviction List
$140 (raised from $128)
Buyback durability + Permian upside in $100 oil regime
Bank of America
DPZ
Buy reiterated
$520 (held)
Pre-open print today; loyalty program traction
JPMorgan
META
OW — added to Analyst Focus List
$760 (held)
AI infra leverage into Wed print
9. Stocks to Watch
Cadence Design Systems (CDNS) — Earnings tonight
$294 reference; $1.89 EPS / $1.46B revenue consensus; implied move 5.8%. Cadence is the cleanest pure-play on the AI-chip design cycle outside of Synopsys, with 70% of revenue ratable and a backlog that has averaged 12-month forward coverage of 1.4x for six quarters. The MSC Software deal adds $250M run-rate to FY26 and opens the physical-AI vertical (autos, aero) that has been the constraint on Cadence's terminal multiple. Watch the FY26 raise: the company's $8.05–$8.15 EPS guide leaves room for a $0.10–$0.15 beat into the print.
Phillips 66 (PSX) — Refining beneficiary
$148 last; Morgan Stanley upgraded today to Overweight, $174 PT (+18% upside). 3-2-1 crack spreads are pinned at $36 — roughly $14 above the five-year average — and PSX's coastal asset mix (Sweeny, Bayway) makes it the most leveraged of the U.S. refiners to Brent-WTI dislocation, which sits at $11.20. Q1 earnings April 30 (Thursday) will be the next catalyst; whisper numbers have moved $0.40 above the $2.95 Street figure. Risk is a sudden Hormuz reopening: $130 PT downside in a peace scenario.
Apple (AAPL) — Thursday's main event
$224 last; consensus $1.95 EPS / $94.8B revenue; implied move 4.4%. The setup is fraught: Greater China revenue is expected -8% y/y for the third straight quarter, services growth is decelerating from 14% toward 10%, and Apple Intelligence rollout has not — yet — produced an upgrade cycle. The bull case rests entirely on the September 'AI-native' iPhone 17 launch and the buyback authorization; the Street looks for $110B+, up from $100B last year. Below $215 the stock has $200 air; above $230 the path of least resistance is $245.
Exxon Mobil (XOM) — Friday's print, but the chart matters now
$132 last; reports Friday before the open. Goldman raised target to $140 from $128 with Conviction List status. The Permian production guide is the variable the Street can't model: every 50 kbbl/d of incremental output adds roughly $0.18 to FY26 EPS at $90 WTI. Technical resistance at $134 has held three times this month — a clean break sets up a measured move to $148. Options activity Friday was heavy in the May $135 calls, with open interest building 22%.
10. Global Macro Snapshot
China — The Politburo's late-April economic meeting (formal communique expected Wednesday or Thursday) is the swing factor for emerging markets this week. December's Central Economic Work Conference set a 4.5–5.0% GDP growth target and signaled 'flexible' use of RRR and rate cuts, but markets have been waiting for a larger fiscal backstop. The Shanghai Composite at 4,055 sits 14% above its January low; March industrial profits and April PMIs (Wednesday) will validate or undermine the reflation trade. Yuan stable at 7.22 offshore, despite dollar strength.
Europe — Eurozone Q1 GDP and April flash CPI on Thursday will guide the ECB's June decision. Germany Q1 GDP is consensus +0.1% q/q, which would mark the third straight quarter of zero-to-marginal growth; CPI is expected to print 2.4% headline, 2.7% core. France's political stalemate adds tail risk, with OAT-Bund spreads at 71 bps — wide but stable. The euro at 1.0832 absorbs both the rate differential and the geopolitical premium.
Emerging markets — The dollar's renewed bid is a problem. MSCI EM is -2.1% on the week against +0.5% for the S&P. Mexico's peso (USD/MXN at 17.85) and the Brazilian real (USD/BRL at 5.32) have absorbed most of the move. Turkey's lira reached a fresh low against the dollar. Commodity exporters (Chile, Peru, Indonesia) are the relative hold-outs on copper and palm oil firmness; net-importer stress is concentrated in India and Korea.
11. Week Ahead Preview
Tuesday: Bank of Japan decision overnight (hold at 0.50% expected; July hike framing in focus). U.S. JOLTS job openings, Conference Board Consumer Confidence (10 AM ET). Earnings: Visa, Coca-Cola, Starbucks, Booking, UPS, GM, Spotify, Pfizer, PayPal, JetBlue.
Wednesday: FOMC decision (2:00 PM ET) and Powell press conference (2:30 PM ET). Bank of Canada decision. Q1 GDP advance estimate (8:30 AM ET, consensus +1.4% q/q SAAR vs. +3.4% prior — biggest deceleration of the cycle). ADP private payrolls. Politburo communique watched. Earnings AMC: Microsoft, Alphabet, Meta, Amazon — collectively ~12% of the S&P 500 by market cap. Also Qualcomm, ServiceNow, eBay, Mondelez.
Thursday: ECB rate decision (hold expected at 2.25%). Bank of England decision (split call). Personal income, spending and the March PCE deflator (8:30 AM ET; core PCE consensus +0.3% m/m, +2.9% y/y — down from 3.0% prior) — the single most-watched data point of the week for Fed pricing. Earnings: Apple, Mastercard, Eli Lilly, Merck, AbbVie, Caterpillar, KLA, Roblox, Reddit, Roku, Coinbase, U.S. Steel.
Friday: April nonfarm payrolls (8:30 AM ET, consensus +180K vs. +303K prior; UR 3.9%) — the cycle-defining print. ISM Manufacturing PMI (10 AM ET). Earnings: Exxon Mobil, Chevron, Charter, AbbVie, Cigna. Pay attention to wage growth: average hourly earnings consensus +0.3% m/m would keep core services inflation glued.
12. Closing Thought
Every cycle has a moment when the consensus narrative becomes so tidy that it ceases to describe the world. We may be in one now. The story the market has been telling itself — soft landing, AI capex sustained, oil shock contained, Fed cuts arriving in autumn — requires every piece to hold. But the VIX at 19 prices in roughly an annualized 1.2% daily move; realized volatility on the S&P over the past month has been 0.9%. That gap is the cleanest measure of investor complacency, and it is wide.
History offers an uncomfortable parallel. In April 1973, with oil-friendly equity markets at all-time highs, S&P forward earnings at 18x and inflation 'transitorily' running at 3.6%, the conventional view was that geopolitical noise from the Middle East was a buying opportunity. Six months later, the Yom Kippur War triggered the embargo, the S&P had lost 18%, and inflation was on its way to 12%. The analogy is not perfect — supply chains, monetary frameworks, dollar dominance all differ — but the architecture of complacency rhymes.
If you are positioned for the consensus, ask yourself what you own that would benefit if it's wrong. That, more than the next earnings beat, is the question this week is asking.
Daily Financial Brief • Compiled at 9:30 AM ET • Sources: market data feeds, FactSet, FedWatch, FRED, company filings.
Not investment advice. Prices and yields shown are indicative; verify before acting.
THE MORNING BRIEF
Markets, Macro, and What Matters Today
Tuesday, April 28, 2026 · Vol. 2026 · No. 84 · Delivered 9:30 AM EST
§ 1 — The Morning Setup
Records Meet Reality as the Fed, OpenAI and Hormuz Collide
Three crosscurrents define this morning's tape, and they are pulling in opposite directions. Asia rang another set of records as Tokyo's Nikkei (60,537) and Korea's Kospi (6,615) both notched fresh peaks. Yet U.S. futures are heavy under the surface, with Nasdaq 100 contracts near flat after a Wall Street Journal report that OpenAI is missing internal revenue and user targets even as it carries $600 billion in committed data-center spend. The consequence: every dollar of AI capex that supported the 2025–early-2026 chip rally is suddenly being re-underwritten in real time. Layer in Brent crude crossing $111 — its highest level since March — after Iran-U.S. talks again stalled around the Strait of Hormuz, and a Conference Board confidence print due at 10am that is already known to have surprised hot, and you have a market that closed at all-time highs Monday but trades like one bracing for a binary catalyst. That catalyst arrives Wednesday at 2:00pm: Powell's likely-final FOMC press conference, where he will be asked to balance an inflation shock and a softening labor market against a Trump White House that has been openly campaigning for cuts. Until then, expect rotation, not direction.
§ 2 — Markets at a Glance
Markets at a Glance
All quotes as of approximately 8:30 AM ET. Changes shown vs. prior session close unless noted.
Instrument
Level / Price
Change
Notes
US Equity Futures (pre-bell)
S&P 500 (ES)
7,211.75
+0.08%
Cooling from record close
Nasdaq 100 (NQ)
27,434.50
-0.02%
Chip drag from OpenAI WSJ report
Dow (YM)
49,397.00
+0.11%
Industrials/staples balance tape
Russell 2000 (RTY)
2,351.20
-0.15%
Rate-sensitive small caps soft
Prior US Session Close (Mon, Apr 27)
S&P 500
7,173.91
+0.12%
Record close — narrow gain
Nasdaq Composite
24,887.10
+0.20%
Record close, third in five sessions
Dow Industrials
49,167.79
-0.13%
Energy & defensives mixed
Russell 2000
2,355.30
+0.05%
Lagged large caps
Asia Close
Nikkei 225
60,537.36
+1.38%
Record high; chips & exporters rally
Topix
4,228.40
+0.95%
Broad-based bid
Kospi
6,615.03
+2.15%
Fresh peak, AI/memory leadership
Hang Seng
26,108.20
-0.24%
Profit-taking late in session
Shanghai CSI 300
4,770.95
+0.04%
Industrial profits +15.8% y/y in Mar.
ASX 200
8,892.10
+0.30%
Mining bid on copper/iron stabilization
Europe (early trade)
Stoxx Europe 600
568.90
+0.20%
Earnings-led mixed open
FTSE 100
9,418.40
+0.35%
Energy heavyweights lift index
DAX
21,742.00
+0.10%
Autos pause; Airbus -0.6%
CAC 40
8,360.20
+0.08%
Luxury subdued
Euro Stoxx 50
5,492.10
+0.18%
Banks bid post-Barclays
Volatility & Cross-Asset Stress
VIX
18.55
+3.05%
Bid into FOMC; 50d avg ~16
MOVE Index
112.4
+1.6%
Above 12m average — rate uncertainty
HY OAS (ICE BofA)
+285 bps
+5 bps
Still well inside 2024-25 highs
IG OAS (ICE BofA)
+80 bps
+1 bp
Near 25-year tights
US Treasuries
2-Year
3.84%
+1 bp
Anchored by Fed-on-hold pricing
5-Year
4.02%
+2 bps
Belly cheapening modestly
10-Year
4.32%
+1 bp
Range-bound around 4.30%
30-Year
4.81%
+2 bps
Curve continues to steepen
2s10s Curve
+48 bps
Flat
Bull-steepener exhausted near term
FX & Dollar
DXY
98.69
+0.15%
Stable after Iran headline whipsaw
EUR/USD
1.1238
-0.10%
Pre-ECB Thursday positioning
GBP/USD
1.3315
-0.05%
Eyeing Barclays/UK data
USD/JPY
151.40
+0.20%
BoJ caution into Powell
USD/CNY
7.1820
Flat
PBoC fixing tight; trade flows steady
Commodities
WTI Crude
$99.75
+3.10%
Hormuz halt persists
Brent Crude
$111.49
+3.05%
Highest since March
Natural Gas (HH)
$2.62
+1.55%
Soft fundamentals, geopolitical bid
Gold
$4,571.66
-2.56%
Profit-taking after record run
Silver
$72.75
-4.19%
Volatility outsize vs gold
Copper
$5.61/lb
-7.4% MTD
Growth-proxy weakness
Wheat (CBOT)
$612 ¼
+1.8%
Fertilizer supply concerns
Corn (CBOT)
$464
+1.1%
Hormuz-linked input squeeze
Crypto
Bitcoin (BTC)
$76,342
-2.6% 24h
Falling into FOMC; risk-off whiff
Ethereum (ETH)
$2,278
-3.8% 24h
Underperforming BTC again
BTC dominance
61.4%
+0.4 pp
Alt weakness broadens
Total crypto cap
$2.71T
-2.9% 24h
Spot ETF flows turn neutral
§ 3 — Top Stories
Top Stories
1. The OpenAI Revenue Miss Cracks the AI-Capex Cathedral
The single biggest story moving Tuesday's pre-market is also the one most likely to keep moving prices for the next month. The Wall Street Journal reported that OpenAI is falling short of internal revenue and user targets as it sprints toward an IPO, with CFO Sarah Friar privately warning leadership that the company may struggle to fund the roughly $600 billion in compute commitments CEO Sam Altman has signed across Microsoft, Oracle, CoreWeave and SoftBank-linked vehicles. OpenAI is on pace to burn $25 billion of cash this year against a $30 billion revenue plan, and Anthropic and Google are visibly closing the productivity-and-coding gap that previously underwrote those numbers.
The market implication is asymmetric. Nvidia, Broadcom, AMD and Oracle's Stargate-linked franchise have priced in a near-religious extension of the AI capex cycle. If the largest single buyer of GPUs is, by its own CFO's admission, struggling to monetize fast enough to pay for what it has already ordered, the whole 2026 capex 'beat-and-raise' template is at risk. Altman and Friar issued a joint denial calling internal divisions 'ridiculous' and reiterating they are 'totally aligned on buying as much compute as we can.' Markets will read that as confirmation, not contradiction. Watch Microsoft's Wednesday Azure print and Alphabet's GCP backlog commentary as the first real check.
2. UAE Quits OPEC, Detonating Two Decades of Cartel Discipline
In a development that landed before the U.S. cash open, the United Arab Emirates announced it will leave both OPEC and OPEC+ effective May 1, the most significant rupture in the cartel since Qatar's 2019 exit. The UAE has long chafed at production quotas (most recently capped at 3.2 million barrels per day) that sit well below its installed capacity of nearly 5 million. With the Strait of Hormuz partially obstructed by the Iran conflict and the country having just negotiated FX swap lines with Treasury Secretary Bessent, Abu Dhabi appears to be using the geopolitical window to seize a structural export advantage.
The price implication is two-sided and matters for every U.S. equity sector. In the very near term, Hormuz disruption keeps Brent bid above $110. But over a 6–12 month horizon, an unconstrained UAE adds 1.5–1.8 mb/d of marginal supply potential at a moment when Saudi Arabia is publicly debating its own quota discipline. That is the seed of a 2027 supply glut narrative — bearish for energy equities, bullish for transports, autos and discretionary on a lag. Today, energy is the immediate beneficiary; the second-derivative trade is in inventories of refiners and integrated names that benefit from wider crack spreads.
3. Powell's Last Stand: FOMC Convenes With No Cut Priced and Every Eye on Succession
The Federal Open Market Committee begins its two-day meeting today with futures markets pricing a 99.9% probability of a hold at the 3.50–3.75% range, the third consecutive pause of 2026. The setup is unusually fraught. March headline CPI accelerated to 3.3% year-over-year (from 2.4% in February) on the energy shock, the labor market is visibly softening with payroll revisions trending negative, and President Trump has publicly criticized Powell at least four times this month. Most consequentially, this is widely expected to be Powell's final meeting as Chair before his term ends in May.
The statement and Summary of Economic Projections (Wednesday 2pm) will need to thread a needle: acknowledge that energy-driven inflation is real but transitory in nature, signal continued vigilance without inviting accusations of political accommodation, and avoid pre-committing the next chair. Watch the dot plot for any 2026 cut migrating from June into Q4, and listen for any reference to the labor-market H/L band — if Powell flags 'downside risks to employment' more aggressively than in March, the bull-steepener resumes and the dollar softens. If he leans hawkish on services CPI, the curve flattens and the dollar firms.
4. Boeing Beats: A Quietly Pivotal Quarter for the Industrial Cycle
Boeing reported pre-market results that materially beat: Q1 revenue of $22.2 billion (vs. $21.99 billion expected, +14% y/y) on 143 commercial deliveries, with a core loss per share of just $(0.20) against a Street estimate of $(0.66). Free cash flow of $(1.45) billion was meaningfully better than the $(2.34) billion expected, and the backlog grew to a record $695 billion. CEO Kelly Ortberg lifted full-year revenue guidance to $44.5–$45.5 billion (from $44–$45B) and reaffirmed the path to 47/month on the 737 by summer with 52/month later in the year.
The signal extends well past Boeing. Aerospace is one of the only manufacturing verticals showing positive operating leverage in 2026, and the 140 net commercial orders in the quarter — including 50 aircraft for Aviation Capital, 30 787-10s for Delta and 20 737-8s for Air India — confirm that fleet renewal is structurally insulated from oil prices. Spirit AeroSystems, GE Aerospace, Heico, TransDigm and Howmet are all leveraged read-throughs. The premarket reaction (BA +4%) likely understates the multiplier through the supply chain by the close.
5. Coca-Cola, GM Lift Guides — Tariff Refunds Become an Earnings Story
Two consumer bellwethers came in materially ahead of expectations and raised full-year outlooks. Coca-Cola beat on EPS and revenue with concentrate volumes accelerating in North America and EMEA; the company guided full-year EPS to the high end of its prior range. General Motors, more dramatically, posted Q1 adjusted EPS of $3.70 versus the $2.62 consensus, raised 2026 guidance, and disclosed a roughly $500 million one-time benefit from the Supreme Court's decision to terminate and refund certain Trump-era levies.
That tariff refund line is the under-covered 2026 earnings catalyst. Dozens of importers, automakers and retailers are sitting on similar accruals that became collectible when the Court ruled. The cleanest beneficiaries are Ford, Stellantis, Whirlpool, the auto parts complex, and select footwear/apparel names with diversified Asian sourcing. For investors, the refunds inflate Q2/Q3 EPS optically and may be 'looked through' by analysts — but the cash hits the balance sheet, and several CFOs have already telegraphed buybacks and accelerated capex as use cases.
6. Spotify's 11% Drubbing: When 760M Users Isn't Enough
Spotify reported its second-highest gross margin in history, grew free cash flow 54% year-over-year, and crossed 760 million monthly active users — and the stock fell 11% in pre-market trade. The disconnect tells you everything about where premium-multiple consumer software is trading: the bar is now monetization-per-user, not gross adds. Premium net additions came in soft, ARPU was flat sequentially despite a price increase, and management's 2026 ad-tier ramp commentary disappointed against a Street that had baked in aggressive monetization.
The read-through extends to Netflix (which already reported), Roblox, Duolingo, Reddit and Pinterest. Investors should expect heightened sensitivity to ARPU and ad-load disclosures across the consumer-internet complex this earnings cycle. Spotify's guidance for Q2 implied a similar trajectory, and the company's early commentary on AI-curated discovery features did not materially alter that framing. Sherwin-Williams, separately, also beat ($2.35 EPS vs. $2.28 est., revenue $5.67B vs. $5.62B) but offered cautious commentary on residential repaint volumes — a more interesting tell about U.S. housing turnover than the headline number.
§ 4 — Macro & Fed Watch
Macro & Fed Watch
The Federal Reserve enters its April meeting in a worse spot than the dot plot will admit. Headline CPI ran to 3.3% year-over-year in March, well above the 2% target, but the composition is heavily energy-led — and crude is now $35 a barrel above where the SEP was constructed. Core PCE, due Thursday, is consensus +2.7% y/y for March, and that's the number Powell will cling to in the press conference. The labor market, meanwhile, is sending different signals: weekly jobless claims have drifted 9% above their 2025 average, the JOLTS hire rate (released next week) is expected to soften further, and the unemployment rate at 4.4% is the highest of the cycle.
Fed funds futures are pricing zero cuts at this meeting, just one cut by year-end (most likely September), and a terminal 2027 rate of 3.10%. That is fully 50 basis points more hawkish than the consensus of two months ago, and the entire repricing has happened since the Iran war began. The 2-year yield at 3.84% reflects a curve that has roughly priced 'higher for longer through 2026.' If Powell signals tomorrow that the Committee views the energy shock as supply-side and 'self-correcting' — language used by Vice Chair Jefferson last week — the front end rallies aggressively and equities catch a bid. If he sounds defensive about credibility, the curve flattens and growth stocks underperform.
Beyond Wednesday, the data calendar is unusually thick. Q1 advance GDP lands at 8:30am Wednesday (consensus +1.4% annualized, decelerating from Q4's +2.3%); March core PCE arrives Thursday at 8:30am; April nonfarm payrolls land Friday at 8:30am, with consensus calling for +135k jobs and a 4.4% unemployment rate. A trifecta of soft prints would force Powell to reframe the post-meeting press conference in real time. Watch the 'cuts priced by year-end' on Bloomberg — every 25-basis-point swing in that number is worth roughly 1.5% on the Russell 2000 and 80 basis points on the dollar index in our recent regression.
§ 5 — Economic Calendar — Today
Economic Calendar — Today
Times in Eastern. Releases sourced from BLS, Census, BEA, Conference Board, S&P CoreLogic, Treasury, Federal Reserve and API.
Time (ET)
Indicator
Prior
Consensus
Why It Matters
8:30 AM
Advance Goods Trade Balance (Mar)
-$148.5B
-$143.0B
Tariff & oil-import distortions feed into Q1 GDP.
8:55 AM
Redbook Same-Store Sales (w/w)
+5.2%
n/a
Real-time retail demand pulse.
9:00 AM
S&P CoreLogic Case-Shiller HPI (Feb)
+0.9% y/y
+0.7% y/y
Housing reflation gauge; affordability watch.
9:00 AM
FHFA House Price Index (Feb)
+0.2% m/m
+0.2% m/m
Conforming-loan housing read.
10:00 AM
Conference Board Consumer Confidence (Apr)
92.2
89.0
REPORTED 92.8 — beat; Expectations index +1.2.
10:00 AM
Richmond Fed Manufacturing Index (Apr)
-4
-2
Regional gauge into Friday's ISM.
1:00 PM
U.S. Treasury 7-Year Note Auction ($44B)
—
—
Belly demand at 4.0% area.
4:30 PM
API Weekly Crude Oil Stocks
-1.8M
-2.2M
Petroleum balance ahead of EIA Wed.
All Day
FOMC Day 1 (No commentary)
—
—
Statement & dot-plan land Wed 2pm; Powell 2:30pm.
§ 6 — Earnings Watch
Earnings Watch
Pre-market reporters: Boeing (BA) printed a clean beat — revenue $22.2B, core EPS $(0.20) vs. $(0.66) est., backlog $695B record, FY guide raised. UPS posted adjusted EPS $1.07 on $21.2B revenue, beat consensus, but reaffirmed 2026 guidance and shares opened lower as investors focused on declining U.S. domestic volume. Coca-Cola (KO) beat on EPS/revenue and lifted guidance; shares +3% pre-bell. General Motors (GM) crushed estimates ($3.70 adj. EPS vs. $2.62 est.) and raised the year on a $500M tariff-refund benefit; shares +5%. Sherwin-Williams (SHW) beat by 7c on EPS and by ~$50M on revenue, shares modestly higher. Hilton (HLT) reports at the open. Spotify (SPOT) reported earlier in Europe; shares -11% on weak ARPU.
After-close reporters: Visa (V) headlines tonight at 5pm ET. Consensus calls for $3.10 EPS (vs. $2.76 y/y) on $10.75 billion in revenue. Watch payments-volume growth (Street modeling +9.5% constant-currency), cross-border (consensus +14% ex-intra-Europe), and incremental commentary on stablecoin rails — Visa's pilot with Stripe and Bridge has been quietly expanding. Options imply a ~3.4% move. Also reporting: Starbucks (SBUX), Mondelez (MDLZ), American Tower (AMT), Snap (SNAP), Caesars (CZR), Match Group (MTCH), Stryker (SYK on Apr 29), Robinhood (HOOD), and Booking Holdings (BKNG).
Sector earnings season context: With 165 of S&P 500 names reported, blended EPS growth is running +9.8% year-over-year, a solid 230 basis points above the pre-season estimate. The beat rate of 79% sits above the 5-year average. Information Technology continues to deliver the highest revenue growth (+28.1% YoY), but margin commentary is mixed as tariff costs filter through. Energy is on track for its first positive earnings growth quarter in five, mechanically boosted by oil prices. The two sectors to watch this week are Communication Services (Alphabet, Meta tomorrow) and Software/Cloud (Microsoft tomorrow, Apple Thursday) — those four names alone represent roughly $9 trillion of market cap.
§ 7 — Sector Spotlight
Sector Spotlight: Energy and Semis Trade Places
The most interesting sector dynamic of the morning is the rotation that's quietly building between Energy and Semiconductors. Energy (XLE) was up modestly Monday and is poised to extend, with Brent at $111 and refiners enjoying widening crack spreads as Hormuz disruption continues to bite. The XLE/SPY ratio has inflected to its highest level since mid-2023, and we'd note that the sector still sits at the bottom decile of forward P/E — meaning even a modest move toward 'fair' carries significant alpha. Halliburton, Baker Hughes (just upgraded by Stifel), Schlumberger and the integrateds (XOM, CVX) are the obvious leveraged plays.
On the other side, the SOX (PHLX Semiconductor Index) has now sold off in two consecutive sessions on the OpenAI capex headlines, with Nvidia down ~3% pre-market and AMD off ~2.5%. The OpenAI revelation isn't a one-day story; it represents a structural re-underwriting of the AI capex cycle that needs to be tested by Microsoft and Alphabet's results tomorrow night. If hyperscaler capex guidance comes in at or above the $360 billion combined run-rate consensus, semis catch a bid. If even one of the four (MSFT, GOOGL, META, AMZN) trims capex commentary by even 5%, the sector has another 6–8% downside to its 200-day moving average. The pair trade — long XLE, short SOXX or NVDA — has been working since Friday and we'd expect it to extend into Wednesday's print.
§ 8 — Analyst Calls & Upgrades / Downgrades
Analyst Calls & Upgrades / Downgrades
Notable Wall Street rating changes from the past 24 hours.
RSN rights uncertainty; Knicks/Rangers premium full.
Wells Fargo
BSX
Reit. Overweight
$75 (from $94)
Multiple compression on med-tech rerate.
Morgan Stanley
ORCL
Equal-Weight
$207 (from $213)
Stargate/OpenAI exposure rerated post-WSJ.
Jefferies
LVS
Downgrade Hold
$61 (from $72)
Macao mass-market deceleration; VIP softer.
§ 9 — Stocks to Watch
Stocks to Watch
Nvidia (NVDA) — The OpenAI Read-Through
NVDA closed Monday at $148.20, down 3.1% on the OpenAI WSJ headline, and futures point to another 1.5–2% leg lower at the open. The stock is now ~9% off its all-time high of $163, and the technical picture is at a critical juncture: the 50-day moving average sits at $146.40, with the 200-day at $134.80. A close below $146 invites mean-reversion to the 200-day — a further 8% downside. Implied vol on the May expiry is at 41% (vs. 32% one month ago), and the put/call ratio has flipped above 1.0 for the first time in three months. The decisive moment comes Wednesday night with hyperscaler capex guidance from Microsoft and Alphabet.
Visa (V) — Tonight's Tape Test for Payments
Visa reports after the close at 5pm ET, and the print matters well beyond the company itself. Cross-border volume is the cleanest leading indicator of global discretionary travel, which has been cited (in opposing directions) by credit-card issuers, hotel REITs, and online travel platforms over the past two weeks. Consensus is +14% constant-currency cross-border and +9.5% total payments volume. Options imply a 3.4% move; the stock has averaged a 1.1% absolute move on the last four prints, so a positioning unwind is set up either way. Key levels: support at $295, resistance at $320. A clean beat with cross-border above 15% likely sends financials to a fresh relative high.
Exxon Mobil (XOM) — The UAE/Hormuz Beneficiary
With Brent at $111 and the UAE leaving OPEC effective May 1, integrated majors look attractively positioned for the next 4–6 weeks. Exxon trades at $128 with a 3.4% dividend yield, $42 of estimated free cash flow per share at $100 oil and a clean balance sheet. The Friday earnings print is expected to show $2.42 EPS on $94B revenue. The upstream-downstream balance of XOM's portfolio means even if oil eventually corrects, refining margins benefit from sustained Hormuz disruption. Technical setup: stock has broken out above $125 resistance, with $135 as the next visible level. Positioning is clean — short interest is just 1.2% of float.
Tesla (TSLA) — Already Reported, Now All About Capex
Tesla reported Q1 last week — beat on EPS at 41 cents (vs. 37 expected) but missed revenue at $22.39B (vs. $22.64B). The stock has been stuck in a $245–$265 range for the past two weeks, and Wednesday's hyperscaler capex prints matter for Tesla too: Dojo and the broader 'AI factory' narrative have become a bigger share of the bull case than vehicle deliveries. Watch $245 as the technical line in the sand; a break invites the 200-day at $232. On the upside, $268 gets the stock back to its 50-day. Robotaxi commentary at next month's analyst day is now a more important catalyst than Q2 deliveries.
§ 10 — Global Macro Snapshot
Global Macro Snapshot
China: Industrial profits jumped 15.8% year-over-year in March, the strongest reading in eighteen months, but the composition was dominated by upstream energy and metals — i.e., a price-driven beat, not a volume-driven one. Property remains a drag, with new home prices in 70 cities still negative on a year-over-year basis, and the PBoC continues to manage the offshore yuan in a tight 7.18 band. Watch the May Politburo meeting for any incremental fiscal pivot. Europe: The ECB meets Thursday with consensus calling for a hold at 2.50%, but Lagarde's commentary on the Iran-driven energy shock could be hawkish at the margin. Eurozone March CPI flash printed +2.4% headline, +2.6% core. Barclays beat this morning (£2.81B Q1 pretax profit, £500M buyback) — a useful read on UK consumer credit health. EM: Brazil's CDS has tightened 35 basis points this week as fiscal headlines moderate; the real has rallied to 5.65/USD. India's nifty made another all-time high overnight on financials strength. Turkey's lira is stable around 38.50 ahead of Friday's CPI. The clean EM trade for the next month: long INR/JPY, short ZAR/USD, given the relative carry profile.
§ 11 — Week Ahead Preview
Week Ahead Preview
Wednesday, April 29: FOMC decision (2pm) and Powell press conference (2:30pm) — the marquee event. Q1 advance GDP at 8:30am (cons. +1.4%). Earnings tsunami after the close: Microsoft, Alphabet, Meta, Amazon, plus Stryker and SoFi.
Thursday, April 30: ECB rate decision (8:15am ET, hold expected). U.S. core PCE for March (8:30am, cons. +2.7%). Initial jobless claims. Apple reports after the close, with iPhone services growth and AI-PC color the focus. Amazon's AWS commentary will already have set the bar.
Friday, May 1: Nonfarm payrolls (8:30am, cons. +135k, U-rate 4.4%) — likely the most market-moving print of the week if it surprises in either direction. ISM Manufacturing at 10am (cons. 49.4) provides the manufacturing pulse. Exxon and Chevron report pre-bell. UAE's exit from OPEC technically takes effect today.
Geopolitical: Iran's response to Trump's pushback on the Hormuz proposal could come at any point this week; the U.S. naval blockade remains in place, and any incremental deterioration would push Brent toward $120. Iranian foreign minister travel to Pakistan and Russia continues. The Chinese Politburo is reportedly meeting later this week to assess fiscal options.
§ 12 — Closing Thought
Closing Thought: The Risk Nobody Is Pricing
Here is the contrarian read. With the S&P 500 at 7,174 and trading 22.4× forward earnings, with the VIX at 18 and credit spreads near 25-year tights, the consensus narrative is that AI capex underwrites earnings, the Fed has the patience to hold, and the Iran conflict is contained. Each of those propositions is simultaneously true and conditional. The risk markets are not pricing is the correlation between them: an OpenAI-driven AI capex stumble combined with a Fed that cannot cut because of a $111 oil shock combined with a tariff-driven Q2 inventory drawdown. None of those scenarios alone breaks the tape. All three together get you to a 12–15% drawdown in a hurry.
"Records are made for breaking. So are narratives. The question this morning is which one breaks first."
That's not our base case. The base case is that Powell sounds dovish enough on Wednesday to keep the bull steepener alive, that Microsoft and Alphabet produce capex commentary firm enough to anchor semis, and that Brent eases back toward $95 within four weeks. But the asymmetry of returns at these levels argues for at least some hedges — call spreads on the VIX, a short SOX position against long Energy, or simply moving up the quality curve in equity. The market is priced for a soft landing into a Fed pivot. Reality, as always, will be more textured.
Compiled at 9:30 AM ET, Tuesday, April 28, 2026 · Sources: CNBC, Reuters/WSJ, Bloomberg, Yahoo Finance, Conference Board, U.S. Treasury, ICE BofA, FRED, BLS, BEA, Nasdaq, Boeing IR, CME FedWatch, OPEC, S&P CoreLogic.
Editorial note: This brief is a synthesis of public reporting and is intended for informational purposes only. It is not investment advice. Forward-looking statements reflect known risks; actual results may differ materially.
DAILY FINANCIAL BRIEF
Friday, May 1, 2026 | Markets Edition | 9:30 AM EST
1. The Morning Setup
Wall Street wakes up Friday cautiously optimistic after a month for the record books, even as the war premium in oil and a Fed that just dug in its heels keep the bears within hailing distance. The S&P 500 closed Thursday at 7,209.01 — its first finish above 7,200 — capping a 6% rally for April, the index's strongest month since 2020. The Nasdaq Composite added 0.9% to 24,892.31, the Dow surged 790 points (+1.6%) to 49,652.14, and the Russell 2000 led the tape with a 2.1% pop, brushing 2,800 for the first time this cycle. Apple's after-hours blowout ($111.2 billion in revenue, +17%) is doing the heavy lifting in pre-market: Dow futures are up 130 points, S&P 500 futures are 0.1% higher, and the Nasdaq 100 is hovering near the flatline with AAPL +3%.
But the optimism comes with a heavy asterisk. Brent crude is still trading around $110, the U.S. naval blockade of Iranian ports stretches into a 19th day, and a hawkishly divided FOMC has just told the market in no uncertain terms that the easing cycle markets had penciled in for summer is no sure thing. Three Fed officials publicly objected to inserting an easing bias into Wednesday's statement — the most contentious dissent since 1992. Today brings ISM Manufacturing PMI, the start of a packed earnings flurry from Exxon and Chevron, and the first trading day of May. The question for May: can the rally keep running if oil refuses to come down and the Fed refuses to cut?
2. Markets at a Glance
Levels as of pre-market 8:30 AM ET, 5/1/2026. Prior closes are 4/30/2026.
Asset
Level
Chg
% Chg
S&P 500 futures (Jun)
7,253.00
+9.25
+0.13%
Nasdaq 100 futures (Jun)
27,548.75
-47.25
-0.17%
Dow futures (Jun)
49,965
+130
+0.26%
Russell 2000 futures (Jun)
2,805
+8
+0.29%
S&P 500 (4/30 close)
7,209.01
+73.06
+1.02%
Nasdaq Composite (4/30)
24,892.31
+219.07
+0.89%
Dow Jones Industrial (4/30)
49,652.14
+790.33
+1.62%
Russell 2000 (4/30)
~2,798
+58
+2.14%
VIX (4/30)
18.92
-0.72
-3.7%
Nikkei 225 (Tokyo)
59,513.12
+225
+0.38%
Topix (Tokyo)
3,728.73
+1.5
+0.04%
Hang Seng / CSI 300
Closed — Labour Day
—
—
Kospi (Seoul)
Closed — Labour Day
—
—
ASX 200 (Sydney)
8,612
+47
+0.55%
FTSE 100 (London)
9,108
-12
-0.13%
DAX / CAC / Stoxx 50
Closed — Labour Day
—
—
UST 2-yr yield
3.82%
+2 bps
—
UST 5-yr yield
4.06%
+3 bps
—
UST 10-yr yield
4.40%
+4 bps
—
UST 30-yr yield
4.93%
+3 bps
—
2s10s spread
+58 bps
+2 bps
Steeper
DXY dollar index
99.0
-0.20
-0.20%
EUR/USD
1.0925
+0.0025
+0.23%
GBP/USD
1.2880
+0.0040
+0.31%
USD/JPY
152.30
-0.85
-0.55%
USD/CNY (offshore)
7.245
-0.010
-0.14%
WTI crude (Jun)
$105.07
-$1.12
-1.05%
Brent crude (Jul)
$109.95
-$0.45
-0.41%
Natural gas (Jun)
$4.85
+$0.06
+1.25%
Gold (Jun)
$4,571
-$52
-1.12%
Silver (Jul)
$74.89
-$0.65
-0.86%
Copper (Jul)
$6.30/lb
+$0.04
+0.64%
Bitcoin (BTC)
$77,377
+$1,070
+1.40%
Ethereum (ETH)
$2,284
+$28
+1.24%
IG corp OAS
82 bps
+1 bp
Tight
HY corp OAS
289 bps
+4 bps
Wider
3. Top Stories
Apple stuns with $111 billion quarter; iPhone 17 lifts second-quarter results
Apple reignited the mega-cap tech trade after the bell Thursday with fiscal-second-quarter revenue of $111.2 billion, up 17% year-over-year, and diluted EPS of $2.01 (+22%). It was Apple's largest March-quarter print ever, with iPhone revenue setting a record on what the company called "extraordinary demand" for the iPhone 17 lineup, while Services revenue hit another all-time high near $30 billion (+16%). Gross margin expanded to 49.3% from 47.1% a year ago — a striking inflection that suggests pricing power, not just unit growth, is doing the work.
The forward guide is what put a charge in the tape: Apple guided June-quarter revenue growth of 14–17%, comfortably above sell-side expectations clustered near 10–12%. That implies an installed-base flywheel that is finally re-accelerating after three flat-ish years, and it lifts the air pocket out of consensus FY26 estimates. Shares jumped 3% in extended trade and pre-market.
Watch for: whether the bid travels to the rest of the Mag 7 — Tesla and Nvidia in particular — and whether AAPL can hold above the $235 level it cleared in extended trading. Options markets had implied a 4% move; the stock is delivering at the lower end, leaving room for follow-through if today's tape keeps the bid.
Powell's last meeting closes with a four-way dissent — most since 1992
The FOMC voted 8-4 on Wednesday to keep the funds rate range at 3.50–3.75%, the bare bones of the headline. It is the dissents, however, that rewrote the policy narrative: Governor Stephen Miran wanted an immediate quarter-point cut, while Cleveland's Hammack, Minneapolis's Kashkari and Dallas's Logan opposed inserting an easing bias into the statement language. The last time four members dissented was October 1992. The Fed is, in plain terms, badly split.
The signal: do not assume the next move is a cut. Powell, in his final press conference as Chair (his term ends May 15), reiterated the staff's view that the war-driven oil shock is "not transitory enough" to ignore, and that the Committee will be "data-dependent in both directions." Fed funds futures repriced sharply: the implied probability of a June cut fell to roughly 28% from 52% pre-meeting, and the year-end 2026 rate now sits ~30 bps higher.
Watch for: the May 15 transition. Trump has telegraphed Kevin Warsh as the favored successor, though Warsh is on record opposing rate cuts in his recent commentary. The succession noise plus a hawkish dissent bloc means rate volatility is likely to stay elevated into the June 17–18 meeting.
Oil holds the high ground as Hormuz standoff drags into a third month
WTI settled at $105.07 and Brent at $109.95 Thursday, both roughly 60% higher than where they started 2026. The driver is unchanged: Iran has refused to reopen the Strait of Hormuz until the U.S. lifts its naval blockade of Iranian ports, and the U.S. has refused to lift the blockade until Tehran agrees to a renegotiated nuclear framework. With Iranian seaborne crude exports collapsing from 2.1 million barrels per day to roughly 567,000, the lost barrels are real — and OPEC+ spare capacity remains the only meaningful release valve.
Today's action will turn on whether the Axios-reported Iranian counter-proposal — passed via Pakistani mediators — produces a credible diplomatic opening. Trump told reporters Thursday that the blockade "stays until they sign," but hedged that he would "look at" any new offer. A break above $115 on Brent would re-tighten financial conditions and arguably force the Fed's hand toward an even more hawkish posture; conversely, any concrete de-escalation could trigger a $10+ per barrel air pocket.
Watch for: tanker tracking out of the Persian Gulf (volumes remain near multi-year lows), Saudi production guidance ahead of the next OPEC+ ministerial, and any movement in the Iranian rial, which often front-runs the diplomatic picture.
Alphabet's $20-billion Cloud quarter rewires the AI capex narrative
Tuesday's Alphabet print is still reverberating. Q1 revenue of $109.9 billion (+20% YoY) was the company's fastest growth quarter since 2022, but the bombshell was Google Cloud at $20.03 billion (+63% YoY), with backlog nearly doubling sequentially to over $460 billion. CEO Sundar Pichai told analysts the company is "compute constrained in the near term" — a striking admission from the company that just raised its 2026 capex range to $190 billion (vs. $185B at year-start, vs. $75B in 2024).
The market read: AI capex is durable, the bottleneck has shifted from chips to power and physical buildouts, and the cloud trio (AWS +28%, Azure +33%, GCP +63%) all beat — proof that this is a demand story, not a share-shift story. Anthropic-related revenue accounted for a non-trivial slice of both Google's and Amazon's AI-attributed cloud growth, per Fortune reporting; that concentration is something investors should watch.
Watch for: power and grid-related plays (Vistra, Constellation, GE Vernova), HVAC and data center construction (EATN, Trane), and the next round of capex pre-announcements as smaller hyperscalers report next week.
Bond market vigilantes are back: 30-year quietly creeps toward 5%
The story the Fed wants you to focus on is the funds rate; the story the bond market is telling is at the long end. The 30-year Treasury closed Thursday at 4.93%, just seven basis points away from the psychologically charged 5% line that last broke in October 2023. The 10-year sits at 4.40%, the 2s10s spread has steepened to +58 bps from a 2026 low of +12 bps in February, and term premia (per the New York Fed's ACM model) have pushed back to +85 bps — the highest in over a decade.
Three forces are at work: (1) the war-driven oil shock has reset the inflation trajectory higher, (2) a hawkishly divided Fed has reduced the optionality of front-end cuts, and (3) the Treasury's quarterly refunding announcement next week is expected to lift coupon issuance to fund a deficit that the CBO now pegs above 7% of GDP for FY2026.
Watch for: 30-year yields above 5%. That is a level at which equity duration (read: long-duration tech) historically gets repriced, and a level at which mortgage rates, currently at 7.45%, push toward 8% — a ceiling that would meaningfully crimp existing-home sales activity into the spring selling season.
China's PMI sends a mixed signal: factories steady, services slip
China's official manufacturing PMI came in at 50.3 in April, down 0.1 point from March but holding above the 50 expansion line for a second consecutive month. The privately-compiled Caixin/RatingDog gauge surprised to the upside at 52.2 (vs. 50.8 prior, 51.0 consensus) — a notable divergence that points to large-state-owned enterprises moderating while smaller, more export-oriented manufacturers benefit from a softer yuan and a tariff-truce window. New export orders crossed back above 50 for the first time in 23 months.
Less encouraging: the non-manufacturing PMI fell to 49.4, below the expansion threshold and signaling a soft April for services and consumption. Beijing's policy mix — selective infrastructure stimulus, targeted property easing — appears to be reaching the factory floor faster than the consumer.
Watch for: the Politburo's late-April readout, which historically sets the tone for May–July policy guidance, and the offshore yuan's reaction to any Trump-Xi tariff signal. A break of USD/CNH above 7.30 would re-light the EM-stress trade.
4. Macro & Fed Watch
Wednesday's FOMC produced more drama than rate action, and that is precisely the point. The Committee held the funds rate at 3.50–3.75% on an 8-4 vote — the most fractious decision in 34 years. Governor Miran wanted a quarter-point cut now; Hammack, Kashkari and Logan opposed even the soft-toned forward guidance language. Powell, in what observers expect to be his final press conference as Chair, offered a notably balanced framing: oil-driven inflation pressure is "watch-worthy," labor markets are "not loosening as expected," and the Committee is "prepared to move in either direction" depending on incoming data.
Translated to rate-market terms: the easing bias the market had been pricing has been at least partially withdrawn. Fed funds futures now imply roughly a 28% probability of a 25-bp cut at the June 17–18 meeting, down from 52% before the FOMC. The implied year-end 2026 rate has migrated higher by ~30 bps to 3.18%. SOFR-OIS curves now show only one full cut priced in over the balance of 2026, versus three at the start of April.
The succession overlay matters. Powell's term as Chair ends May 15, and President Trump has reportedly narrowed the shortlist to former Governor Kevin Warsh and current Governor Christopher Waller. Warsh has been publicly skeptical of cuts; Waller has been notably dovish on growth. The market is, for now, pricing the Warsh outcome — adding to the upward drift in long-end yields. Watch for any official nomination signaling, which could come as early as next Tuesday's Treasury Q2 refunding announcement.
Fed speakers ahead: New York's Williams (Friday afternoon, post-data), Atlanta's Bostic (Monday), and Vice Chair Jefferson on Wednesday. With Powell now in lame-duck mode, regional bank presidents will carry an outsized share of the message-shaping. The hawkish dissent bloc gives those communications more weight than usual — a single Hammack speech could move the front end 5+ bps.
5. Economic Calendar — Friday, May 1
Time (ET)
Indicator
Prior
Consensus
Why It Matters
8:30 AM
Personal Income (Mar)
+0.3%
+0.4%
Anchors consumer spending power
8:30 AM
Personal Spending (Mar)
+0.4%
+0.5%
Real-time read on consumption
8:30 AM
PCE Price Index (Mar)
+0.30% m/m
+0.32% m/m
Fed's preferred inflation gauge
8:30 AM
Core PCE (Mar)
2.71% y/y
2.78% y/y
Re-acceleration risk amid oil shock
9:45 AM
S&P US Manufacturing PMI (Apr F)
54.0
54.0
Final Apr read; first global PMI gauge
10:00 AM
ISM Manufacturing PMI (Apr)
52.7
53.1
Headline US factory sentiment — most-watched data of the day
10:00 AM
ISM Manufacturing Prices Paid (Apr)
61.8
62.5
Inflation pipeline pressure gauge
10:00 AM
ISM Manufacturing Employment (Apr)
49.5
50.0
Cross-checks NFP next Friday
10:00 AM
Construction Spending (Mar)
+0.5% m/m
+0.3% m/m
Q1 GDP revision input
3:00 PM
Light Vehicle Sales (Apr)
16.4M SAAR
16.0M SAAR
Big-ticket consumer demand check
12:30 PM
Fed's Williams (NY) speaks
—
—
Post-FOMC color from a key voter
6. Earnings Watch
Today's earnings tape is dominated by the energy super-majors. ExxonMobil (pre-market) and Chevron (pre-market) both posted Q1 results that beat lowered Wall Street bars. Exxon reported $4.2 billion in net income ($1.00/share GAAP, $2.09/share adjusted) — down sharply from $7.7 billion a year ago as downstream margin compression and a heavy capex quarter weighed, but $0.18 above consensus on an adjusted basis. Chevron's $2.2 billion print ($1.11 GAAP, $1.41 adjusted) topped the $0.95 consensus. Both stocks are trading flat-to-slightly-higher pre-market; the read is that the energy-sector beat-miss bar has reset low enough to absorb the YoY profit declines without selling pressure.
Other notable Friday-morning prints include Linde (industrial gas, EPS estimate $4.18), Imperial Oil (Canadian heavy, C$1.85 est), and Cigna ($6.40 est) on the health-insurance side. Pre-market focus also on Coterra Energy and Cabot — small-cap E&P that benefits more leveraged from Brent strength than the supermajors do. After the close: Block (XYZ, $0.62 est), DraftKings ($0.07 est) and Booking Holdings ($24.20 est).
Stepping back, Q1 2026 earnings season is now ~70% reported with S&P 500 EPS growth tracking +13.4% YoY (vs. +9.1% expected entering the season) — the third consecutive quarter of double-digit growth. Revenue beats are running at 76%, EPS beats at 81%, both above 5-year averages. Forward 12-month EPS estimates have moved up roughly 2% since the season began, an unusually positive revision dynamic. The 2026 S&P EPS consensus now sits at $295, putting the index on 24.4x forward — rich, but supported by an earnings trajectory that has not yet broken.
Sector tilt: Technology and Communication Services have produced the largest beats by magnitude (Alphabet, Amazon, Meta), while Energy and Materials have produced the largest negative surprises in revenue (commodity-pricing math) but positive surprises on cost discipline. Consumer Discretionary remains the wild card: Amazon's beat was company-specific, while Lululemon, Target and a raft of mid-tier retailers have warned on Q2 guidance citing tariff drag and softening lower-income consumer.
7. Sector Spotlight
Yesterday's tape was a textbook risk-on day with quality leadership. Communication Services led at +2.1%, lifted entirely by Alphabet's post-print follow-through. Consumer Discretionary added +1.8% on Amazon. Industrials (+1.6%) and Financials (+1.5%) provided the broadening — and the Russell 2000's +2.1% confirmed the message: market participation has widened beyond the AI infrastructure trade for the first time since February.
The notable laggard was Health Care (+0.3%), where biotech remained pressured by ongoing political noise around drug pricing and Eli Lilly traded lower on weight-loss-drug pipeline concerns from a competitor's Q1 trial readout. Utilities (+0.2%) and Consumer Staples (+0.4%) also lagged — classic late-cycle defensives selling off when risk appetite returns. Today's spotlight is on Energy: with WTI down 1% pre-market on the Iranian counter-proposal headlines, energy stocks are trading flat-to-slightly-down despite the supermajor earnings beats. The XLE ETF closed Thursday +14.3% YTD vs. the S&P at +6.1% — the rotation thesis is intact, but the entry point matters.
8. Analyst Calls — Last 24 Hours
Firm
Stock
Action
PT
Thesis
Morgan Stanley
AAPL
Reiterate Overweight
$265 (from $245)
Services flywheel + iPhone 17 super-cycle
Bernstein
GOOGL
Outperform
$230 (from $210)
Cloud +63%; AI capex monetization clearer
JPMorgan
AMZN
Overweight
$255 (from $240)
AWS re-acceleration + retail margin
Wells Fargo
META
Overweight (raise)
$770 (from $710)
Reels monetization at parity with Feed
Goldman
XOM
Buy
$135 (unchanged)
Beat masks downstream weakness; cap-disc
Citi
TSLA
Neutral → Sell
$240 (from $290)
Robotaxi delivery slip; demand softening
TD Cowen
CLS (Celestica)
Buy (upgrade)
$430 (from $350)
FY26 visibility + capacity expansion
Barclays
SHOP
Equalweight → Overweight
$130 (from $105)
Plus enterprise traction; AI agent take
Bank of America
NEE (NextEra)
Buy (initiate)
$92
Power-grid inflation; data-center demand
UBS
LLY
Buy → Neutral
$870 (from $1,050)
GLP-1 share loss risk in second half
9. Stocks to Watch
Apple (AAPL) — pre-market $235.40, +3.2%.
The blowout print is the obvious catalyst, but the level to watch is $238 — the prior all-time high from January. A daily close above $238 with volume confirms the breakout and opens a path to the $250–$255 zone Morgan Stanley flagged. Options are pricing a +/- 4% post-earnings move; the actual 3.2% pre-market suggests the move could extend rather than fade. Risk: a sour ISM print in the cycle's first reading post-Hormuz blockade could reignite hard-landing concerns and undo the bid.
ExxonMobil (XOM) — pre-market $128.15, +0.3%.
The print is fine; the chart is what matters. XOM has been consolidating between $122 and $130 since mid-March. A daily close above $130.50 confirms a textbook bull-flag breakout off the war-premium base, with measured target near $148. The 14% YTD outperformance of the XLE ETF tells you institutions are not yet positioned for a sustained energy regime — that asymmetry is the trade. Risk: a credible Iran-deal headline cracks Brent through $100.
Tesla (TSLA) — pre-market $264.20, -2.1%.
Citi's downgrade to Sell with a $240 target is the catalyst, but the operating news is worse: the Robotaxi launch in Austin has been pushed from June to "late Q3," the second slip this year. Q1 deliveries already disappointed at 351,000 units. The $260 level is critical; a daily close below opens the door to the $235 January-low retest. Implied vol is back above 60, the highest since November — the tape is set up for a binary move on the next product update.
NVIDIA (NVDA) — pre-market $145.80, +0.8%.
Not reporting today, but the read-through from Alphabet, Amazon, and Microsoft cloud capex is unambiguously positive. NVDA has consolidated since its February all-time high of $158 and traded sideways on the war news. The setup heading into the May 21 earnings print mirrors the late-2024 base that preceded the ramp into Blackwell — same multiple, same growth, but with a more compressed valuation. Watch the $148 level: a clean break opens the path to $158-plus.
10. Global Macro Snapshot
Beyond the headline U.S. tape, the global picture is uneven. China's manufacturing PMI dichotomy (official 50.3, Caixin 52.2) leaves observers split on whether the Q1 export surge was front-loading ahead of tariff risk or genuine momentum; the offshore yuan firmed slightly to 7.245, a move that argues for the latter. Watch the Politburo readout, due imminently.
Europe is largely closed today for Labour Day, with only the FTSE 100 trading. Yesterday's late session saw the Stoxx 600 close +1.4%, with both the ECB and BoE holding rates as expected and signaling that the bar for cuts has risen given the imported oil-shock inflation pulse. EUR/USD is hovering at 1.0925, and EU-priced Brent has climbed to €105 — a level that, if sustained, will start showing in May CPI prints from Germany and France.
Japan is the standout in Asia today, with the Nikkei +0.4% to 59,513.12 — a fresh all-time high. The yen, however, strengthened nearly 3% earlier this week amid suspected MOF intervention, and USD/JPY now sits near 152.30 (vs. 158 last week). The yen-funded carry trade has unwound aggressively over the past 72 hours; cross-asset vol watchers should monitor this as a potential margin-call accelerant if it continues. EM stress is contained: the JPMorgan EMBI spread sits at 280 bps, near YTD tights.
11. Week Ahead — May 4–8
Monday brings the first taste of next week: ISM Services PMI (consensus 53.5 vs. 52.8 prior), Atlanta Fed's Bostic speech, and pre-market earnings from Berkshire Hathaway (post-AGM, much-watched), Tyson Foods, Realty Income, and Vertex Pharma. Tuesday is the Treasury's quarterly refunding announcement — a critical event for the long end given recent yield pressure; consensus expects $48 billion in new 10-year issuance and a possible bump to 30-year sizes.
Wednesday's calendar features ADP private payrolls (consensus +135K vs. +147K prior), trade balance data, Vice Chair Jefferson speech, and earnings from Disney, Uber, AMD, Shopify, and Coupang. Thursday delivers initial jobless claims, productivity & unit labor costs, plus earnings from Pinterest, Sanofi, Datadog and Cloudflare.
Friday is the data marquee: April Nonfarm Payrolls release (preliminary consensus +170K, unemployment 4.2%, AHE +0.3% m/m). With March having delivered a +178K beat against a +59K expectation, the bar for an upside surprise is much higher. Geopolitically, watch for any movement on the Iranian counter-proposal — markets will reprice oil first, equities second, on any concrete diplomatic step. House Speaker is also expected to release the May supplemental funding bill that includes Ukraine and Israel-aid components.
12. Closing Thought
A worthwhile lens for May: the four-way Fed dissent is a higher-order signal than the rate hold itself. Markets have spent the past 18 months trained that the Fed is the buyer of last resort whenever financial conditions wobble. A divided Committee — three governors actively opposing dovish language — quietly removes that backstop in exactly the moment when an oil-price shock is testing the inflation regime. The market is, in our view, still pricing the old reaction function.
If long-end yields keep grinding higher and the 30-year cracks 5%, the equity duration trade — which is mathematically about 70% of the YTD S&P 500 return — gets repriced regardless of the earnings tape. Q1 earnings have been excellent. They have also delivered the strongest April since 2020. Both can be true and the market can still face a more challenging summer than the consensus assumes.
The bull case requires three things to hold: an Iran-deal break that releases oil pressure, a clean ISM print today that confirms growth without re-igniting inflation fears, and a nominee for Fed Chair who signals continuity. None of those are guaranteed. Position accordingly. As Druckenmiller likes to say: focus on what's discounted, not what's true. Have a great weekend.
— End of Brief —
Daily Financial Brief is provided for informational purposes only. Not investment advice. Sources: CNBC, Reuters, Bloomberg, FRED, S&P Global, ISM, U.S. Treasury, company earnings releases.
DAILY FINANCIAL BRIEF
Weekend Edition • Saturday, May 2, 2026
Records on Wall Street, intervention in Tokyo, a peace bid from Tehran — and a jobs report Friday.
1. The Morning Setup
It is the rarest of moments in modern markets — the S&P 500 and Nasdaq both closed at all-time highs on Friday even as U.S. crude oil hovers above $100 a barrel, the dollar has its weakest stretch of 2026, and a foreign central bank just torched roughly $35 billion of reserves to defend its currency. Friday's tape was a quiet record: the S&P 500 added 0.29% to 7,230.12, the Nasdaq Composite tacked on 0.89% to 25,114.44, and the Russell 2000 closed within shouting distance of its own 52-week high. Apple's blowout quarter — $111.2 billion in revenue, a March-quarter record for iPhone, and a guide that humiliated the Street's June-quarter estimate — papered over a more complicated picture beneath the index level.
That picture: the Iran war is now seven weeks old, oil traders are toggling between $100 and $126 on every diplomatic rumor out of Islamabad, the Bank of Japan has formally re-entered the FX wars to defend the 160 line in dollar-yen, and the Federal Open Market Committee just delivered Jerome Powell's final decision as chair with the most dissents in 34 years. Into that, James, Friday brings the April nonfarm payrolls — the cleanest read yet on whether the Iran shock has broken the U.S. labor market or merely bent it. The week ahead is when narrative meets data.
2. Markets at a Glance
Levels reflect Friday, May 1 close (US, Europe) and most recent print (FX, crypto, Asia open). Color coding: green = positive, red = negative.
Asset
Level
Change
% Change
Note
US INDEXES — FRIDAY CLOSE
S&P 500
7,230.12
+20.92
+0.29%
Record close
Nasdaq Composite
25,114.44
+221.4
+0.89%
Record close
Dow Jones
49,499.27
-153.65
-0.31%
Energy drag
Russell 2000
2,812.82
+12.85
+0.46%
Near 52-wk high
VIX
16.89
-0.35
-2.03%
Calm regime
GLOBAL — FRIDAY
FTSE 100 (UK)
10,378.82
+18.55
+0.18%
Miners led
DAX (Germany)
24,292.38
+38.10
+0.16%
Defense bid
CAC 40 (France)
8,114.84
-12.20
-0.15%
LVMH soft
Nikkei 225 (Japan)
Closed
—
Holiday
Golden Week
Hang Seng (HK)
23,187.42
+278.10
+1.21%
Tech rebound
Shanghai Comp.
Closed
—
Holiday
Labour Day
Kospi (Korea)
Closed
—
Holiday
Children's Day eve
ASX 200 (Aus)
8,431.20
+24.05
+0.29%
Iron ore firm
RATES, FX & CREDIT
US 2Y Treasury
3.88%
-3 bp
—
Cuts repriced in
US 5Y Treasury
4.07%
-2 bp
—
Belly anchored
US 10Y Treasury
4.39%
+1 bp
—
Term premium
US 30Y Treasury
4.97%
+2 bp
—
Long end heavy
2s/10s Spread
+51 bp
+4 bp
—
Steepening
DXY (Dollar)
98.22
+0.17
+0.17%
Bouncing off lows
EUR/USD
1.1392
-0.0021
-0.18%
ECB on hold
GBP/USD
1.3408
+0.0014
+0.10%
Gilts firmer
USD/JPY
156.54
-1.85
-1.17%
BOJ intervention
USD/CNY
7.2640
-0.0040
-0.06%
PBOC fix steady
IG Credit (CDX)
62 bp
-1 bp
—
Tight, complacent
HY Credit (CDX)
342 bp
-5 bp
—
Risk-on tone
COMMODITIES
WTI Crude ($/bbl)
101.94
-3.15
-3.00%
Iran proposal
Brent Crude ($/bbl)
108.17
-2.10
-1.90%
Hormuz tension
Nat Gas ($/MMBtu)
2.79
+0.022
+0.80%
3-wk high
Gold ($/oz)
4,612.50
-10.20
-0.22%
Above $4,600
Silver ($/oz)
74.18
+1.05
+1.44%
Squeeze risk
Copper ($/lb)
6.30
+0.12
+1.94%
Supply 'fracture'
Wheat (¢/bu)
678.50
+4.25
+0.63%
Black Sea risk
Corn (¢/bu)
498.75
-2.50
-0.50%
US planting pace
CRYPTO (24h)
Bitcoin (BTC)
77,376.65
+1,070
+1.42%
MCap $1.53T
Ethereum (ETH)
2,284.34
+27.95
+1.24%
MCap $275B
Total Crypto MCap
$2.59T
+$21B
+0.82%
BTC dom. 60.3%
Source data: Apple Q2 results, CNBC, FactSet, FRED, Trading Economics, U.S. Treasury, Reuters, CME Group. Asia indexes flagged 'Closed' reflect Golden Week / Labour Day market holidays in Japan, mainland China, and Korea.
3. Top Stories
Apple smashes Q2 estimates, guides June quarter to crush the Street
Apple delivered the print of the earnings season Thursday after the bell: $111.2 billion in revenue (+17% y/y), $2.01 in diluted EPS (+22% y/y), and an iPhone segment that ripped 22% higher to $57.99 billion — a record for the March quarter. The iPhone 17 family, which Tim Cook described as 'the most popular line-up in Apple's history,' drove the upside, with China revenue accelerating after a two-year slog. Services hit $30.98 billion, beating Wall Street's $30.4 billion bogey, and gross margin expanded 80 basis points to 47.1%.
More important than the backward look was the forward one: Apple guided June-quarter revenue growth of 14% to 17%, against consensus of just 9.5%. A guide that wide above consensus is unusual for Apple — the company typically sandbags. The mechanics: pulled-forward iPhone 17 demand, a Services business now compounding at mid-teens, and a tailwind from yen weakness on Japan-sourced components even after Thursday's intervention.
Market implication: Apple's $3.4 trillion market cap means a 4% gap-up after-hours dragged the entire Nasdaq with it on Friday. Watch next: how the rest of mega-cap tech digests the read-through. If Apple's services strength translates to a Microsoft Azure beat, an Amazon AWS reacceleration, or a Google Cloud surprise, the AI capex narrative gets re-blessed.
BOJ torches $35 billion to defend the yen as oil shock blows up dollar-yen
The Bank of Japan and Ministry of Finance executed their first FX intervention in nearly two years Thursday afternoon Tokyo time, spending roughly ¥5.48 trillion ($35 billion) to drag dollar-yen from above 160 — the politically explosive 'red line' — back to 155.49 in a matter of hours. By Friday's New York close, USD/JPY had settled at 156.54, with vice finance minister Atsushi Mimura warning that 'speculative positions remain' and putting traders on notice for a second wave.
The trigger was structural: Japan imports nearly all of its energy, and Brent at $108 has blown out the trade deficit to a 30-year worst. Pair that with a Fed-BOJ rate gap that is still 175+ basis points wide and you get a one-way trade in dollar-yen that the carry crowd had been pressing relentlessly. Tokyo broke that pattern — for now — but the durability hinges entirely on whether oil can re-rate lower, which leads us straight into the next story.
Market implication: a surprise yen rally is a global liquidity event, because it forces Japanese institutional investors who had been funding offshore equity and Treasury purchases via cheap yen to repatriate. Watch USD/JPY 157.00 as the line in the sand; if it breaks back above, the market will start front-running the next intervention.
Iran sends fresh peace proposal to mediators in Pakistan; oil drops 3%
WTI tumbled 3% to $101.94 and Brent slipped to $108.17 on Friday after Pakistani officials confirmed receipt of an updated Iranian peace proposal addressing four pillars: freedom of navigation through the Strait of Hormuz, Tehran's nuclear and ballistic-missile programs, post-conflict reconstruction and sanctions relief, and a long-term security framework. The Trump administration argued that the original April 7 ceasefire 'terminated' active hostilities, providing legal cover to extend the U.S. naval blockade indefinitely under existing war-powers authority.
But the move is delicate. Brent traded as high as $126 on April 30 when Trump threatened to widen the blockade until Tehran agrees to a verifiable nuclear deal, and Iran's supreme leader Mojtaba Khamenei — who succeeded his father in late 2025 — has refused to surrender the country's enrichment program. The Strait remains technically open but commercial transit volume is down 28% from pre-war levels, with insurers charging war-risk premiums of $4–6 per barrel.
Market implication: every $10 move in Brent is roughly 0.3 percentage points off U.S. CPI four months out and 0.15 points off real GDP. That is why the energy complex has functioned as the de-facto Fed put for two months. Watch next: any Pakistani statement on a date for in-person talks. If a venue is set, expect Brent to trade with a $90 handle within a week. If talks collapse again — as they did April 28 — $120 returns immediately.
Powell exits with a dissent storm; Warsh nomination heads to Senate floor
Wednesday's FOMC meeting — Jerome Powell's last as chair before his term expires May 15 — held the federal funds rate at 3.50–3.75% for the third consecutive meeting and produced an 8-4 vote, the most dissents at a single meeting in 34 years. Stephen Miran wanted a 25 basis-point cut. Beth Hammack, Neel Kashkari, and Lorie Logan supported holding but objected to language inserting an explicit 'easing bias.' Powell will remain on the Board of Governors as a voting member through early 2028 — a first for a former chair in the modern era.
Kevin Warsh, Trump's nominee, faces a full Senate vote the week of May 11 and is widely expected to confirm in time to chair the June 16–17 meeting. Warsh has made no secret of his preference for faster cuts — he gave a March speech arguing the Fed is '100 basis points too tight' relative to the equilibrium rate — but he will inherit an FOMC where the median dot still pencils only one cut for all of 2026.
Market implication: the dissents are doing the dovish work for him. Fed funds futures now price in 62 basis points of cuts by year-end, with the first move fully priced for the September 16 meeting. Watch next: how the front-end of the curve — the 2-year at 3.88% — responds to Friday's payrolls. A sub-100k print would re-price September to a 50bp cut probability.
Industrial commodities flash a real-economy 'all-clear'; copper, silver squeeze
Underneath the geopolitics, base metals are screaming growth. Copper at $6.30 a pound is up 48% year-over-year and broke a multi-year resistance Friday on confirmation that Chinese refined-copper inventories at SHFE warehouses fell to a six-year low of 78,000 tons. Silver pierced $74 an ounce — its highest level since 1980 in nominal terms — with the gold/silver ratio compressing toward 62, a level historically associated with cyclical re-acceleration.
The 'fracture' narrative is real: Chile's Codelco cut full-year guidance again last month, Indonesia's nickel-and-copper export licensing remains unpredictable, and Glencore's Mt. Isa wind-down has pulled an additional 80,000 tons of annual mine supply offline. Demand is the inverse: Chinese grid capex is running 24% above 2025, U.S. data-center buildouts are pulling 18% more copper per gigawatt than two years ago, and the EV grid-storage cycle is still accelerating.
Market implication: this is the bullish global growth read that the bond market is not yet ratifying — 10-year Treasuries at 4.39% are pricing a much sleepier economy than copper at $6.30. Something has to give. Watch the Caterpillar / Freeport-McMoRan / Rio Tinto trio next week as a barometer; if all three break to fresh highs, the cyclical-growth trade re-asserts its leadership.
Crypto creeps back into the conversation as BTC reclaims $77k
Bitcoin closed Friday at $77,376.65, up 1.42% on the session and back above the 200-day moving average for the first time since the late-March correction that followed the SEC's surprise enforcement action against three offshore exchanges. Ethereum at $2,284 is grinding higher but underperforming BTC, with the ETH/BTC ratio at 0.0295 — the lowest of the cycle. Total crypto market cap is back to $2.59 trillion.
The most interesting development is structural: spot Bitcoin ETF net inflows turned positive again last week ($840 million on the five-day) after a six-week stretch of outflows, and BlackRock's IBIT crossed $80 billion in AUM. The on-chain story has cooled — exchange-held supply is at a five-year low and stablecoin supply has plateaued — but the institutional bid is reasserting itself.
Market implication: Bitcoin's correlation to the Nasdaq has crept back to 0.62 from 0.31 a quarter ago, meaning if mega-cap tech breaks higher next week on AMD/PLTR earnings, BTC mechanically gets dragged with it. Watch $80,000 as the next overhead supply zone.
4. Macro & Fed Watch
The Fed cycle has entered a peculiar limbo. Headline CPI at 2.9% y/y is sticky but trending the right way; core PCE — the Fed's preferred gauge — printed 2.7% in March, the lowest since early 2024. Yet Wednesday's FOMC statement struck a notably more cautious tone than the March meeting, citing 'elevated uncertainty around the inflationary impact of the energy-supply disruption' as the reason for adding the easing bias the four hawkish dissenters refused to sign. Translation: the committee is split on whether the Iran-driven oil shock is a one-off price-level adjustment that the Fed should look through, or a more durable second-round impulse via wages and services that demands continued restriction.
The bond market has voted decisively for the dovish camp. The 2-year at 3.88% is now 38 basis points below the lower bound of the funds-rate corridor — a yield-curve configuration that historically signals 75-plus basis points of cuts within nine months. The 2s/10s spread at +51 basis points is steepening 'bull-flattening' — front end rallying faster than the back end — which is the curve shape that almost always precedes the first Fed cut by three to six months. Long-end Treasuries at 4.97% on the 30-year reflect a different concern: a Treasury borrowing schedule that needs to clear $2.1 trillion of net issuance over the next twelve months against a buyer base that is increasingly term-premium sensitive.
Fed funds futures now price 62 basis points of cuts by December, with the first move fully discounted for September 16. Powell's final post-meeting press conference Wednesday left the door open to either a June cut or a hold, depending on data — but for the first time in this cycle, he refused to push back against the market's rate-cut pricing. That is the closest a chair gets to a wink. Three Fed speakers are scheduled this week: Daly Monday (1:30 p.m.), Williams Tuesday (12:00 p.m.), and Goolsbee Thursday (10:00 a.m.). All three are in the dovish quadrant; expect them to ratify, not push back.
5. Economic Calendar — The Week Ahead
US releases for the trading week of May 4–8, 2026. Today (Saturday) has no scheduled US indicators. All times Eastern.
Time (ET)
Indicator
Prior
Consensus
Why It Matters
Saturday
Markets closed
—
—
Weekend session — no scheduled US releases. Brief covers Friday's tape and the week-ahead setup.
Mon 9:45a
S&P US Manufacturing PMI (Final, Apr)
51.8
51.9
Cross-check on ISM 52.7; confirms expansion remains intact.
Revolving credit signals consumer stress or strength.
Fri 8:30a
Nonfarm Payrolls (Apr)
+178k
+135k
The headline event — first read on labor under Iran-war oil shock.
Fri 8:30a
Unemployment Rate
4.3%
4.3%
Sahm Rule trigger remains 4.4%.
Fri 8:30a
Avg. Hourly Earnings
+0.3% m/m
+0.3%
Wage inflation; Fed's most-cited single data point.
Fri 10:00a
Wholesale Inventories (Mar)
+0.5%
+0.4%
Restocking cycle signal.
6. Earnings Watch
Q1 2026 earnings season is roughly 70% complete after this past week, with the S&P 500 blended earnings growth rate sitting at +9.8% y/y per FactSet — well above the +6.4% expectation entering the season. The energy sector's earnings reversal is the standout: from a -7% y/y print expected in late March to a +71% growth rate now penciled for Q2 thanks to Iran-war oil prices. Tech remains the single largest contributor to overall index earnings (+18% y/y for the sector), and financials surprised to the upside on net interest margin expansion as the curve steepened.
This week's calendar is dominated by AI-economy bellwethers. Monday after the close brings Palantir (PLTR), with consensus at $0.28 EPS on $1.54 billion revenue (+74% y/y); options imply a 12% one-day move. The bull case: FY26 revenue guide upgrade fueled by U.S. commercial AIP wins. The bear case: at 220x forward FCF, even a beat-and-raise may struggle to justify multiple expansion. Goldman cut its target this week. Vertex (VRTX) also reports Monday — focus on Casgevy uptake and the pain-pill suzetrigine launch.
Tuesday after the bell, AMD reports Q1 with consensus at $1.27 EPS on $9.85 billion revenue. Data center is the only number that matters: Bernstein expects MI300 revenue of $2.1 billion and forward commentary on the MI400 ramp into 2H'26. HSBC reports the same morning — watch Asia exposure given the Iran-disruption flow-through to trade finance. Wednesday brings Disney (DIS) with consensus EPS around $1.48 — Disney+ subscriber growth, Park margins, and ESPN flagship-launch traction are the three watch items. Arm Holdings (ARM) prints the same evening; consensus EPS $0.52, options imply a 9% move.
Thursday closes the week with Cloudflare (NET), Datadog (DDOG), and Coinbase (COIN) — three names that will reset the bar on AI infrastructure monetization, observability spend, and the resilience of the crypto retail user. Sector context: tech earnings have beaten by an average 8.4% so far this season; financials by 6.1%; consumer discretionary by 2.9%. The market's tolerance for in-line tech prints is low at these multiples.
7. Sector Spotlight
Energy: the inverse of every other sector — and it is winning
With Brent stubbornly above $108 and the Iran-war risk premium structurally embedded, the S&P 500 Energy sector is up 24% year-to-date — by far the best sector performance of 2026 — even as the broader index makes incremental new highs. The setup is uniquely durable: integrated majors (XOM, CVX) are locking in $80–$95 long-dated forward sales; refiners (VLO, MPC) are printing record crack spreads; and U.S. independent E&Ps (PXD, FANG) are returning 70%+ of free cash flow via buybacks rather than re-investing in supply growth. Wells Fargo's Friday upgrade of Exxon to a $172 target captures the consensus shift: $40 billion of free cash at $100 oil, with 4% buyback yield on top of the 3.6% dividend.
Financials: net interest margins inflect higher as curve steepens
The bull-steepener that began in February has finally shown up in regional and large-bank earnings. Q1 NIM expansion across the top-25 banks averaged 9 basis points sequentially — the first up-quarter in seven. With the 2s/10s spread now +51 basis points and the Fed cutting cycle approaching, the asset-sensitive money-center banks (JPM, BAC, C) become a structural beneficiary, while regional names (ZION, KEY, WAL) get a balance-sheet repricing tailwind. The XLF is up 14% YTD and broke out to a fresh all-time high Friday.
Customer acquisition costs rising; state tax headwinds in IL, NY.
HSBC
LLY
Downgrade
$1,050 → $880
Mounjaro/Zepbound list-price cuts in 2026 trim 2027 EPS power.
Wells Fargo
XOM
Overweight (reit.)
$155 → $172
Iran-war crude at $100+ underwrites a $40B FCF year.
Goldman Sachs
PLTR
Neutral (reit.)
$58 (PT cut)
Cautious into Mon. print; rich at 220x fwd FCF, beat-and-raise priced in.
Bernstein
AMD
Outperform (reit.)
$210
MI400 ramp into 2H'26; expects Q1 beat-and-raise on data center.
9. Stocks to Watch
Apple (AAPL) — closed Friday at $258 (+4.1%)
After Thursday night's blowout print, Apple gapped up at the Friday open and held the bid all session — unusual for a name where a 4% gap is typically faded. Two reasons: the June-quarter guide of +14–17% revenue growth was so far above the +9.5% Street expectation that buy-side models had to be entirely re-built over the weekend, and the Services run-rate of $124 billion annualized re-validates the bull case for multiple expansion to 32x. The technical setup: $258 was prior resistance; if Monday confirms with a hold above, the next overhead supply zone is $275–$280. Options skew flipped to call-favored Friday — a rare positioning shift for AAPL.
Palantir (PLTR) — closed Friday at $130, reports Monday after the close
The most-watched earnings of the week. Consensus is $0.28 EPS on $1.54 billion revenue, but the buy-side whisper is closer to $1.58 billion with U.S. commercial growth above 60% y/y. Options imply a 12% one-day move — historically wide for PLTR. The catalyst that matters is the FY26 guide: a raise to ~$5.0 billion (vs. current $4.65 billion) is what bulls need to justify the 220x forward FCF. The technical level: $135 is the prior all-time high; a beat-and-raise gaps it to $148–$150. A miss or in-line print likely retests $115.
Exxon Mobil (XOM) — closed Friday at $148 (+0.8%)
The cleanest expression of the Iran-war oil-price regime. With Brent at $108, Exxon is on track for a $40 billion free-cash year, against a $560 billion market cap — that is a 7.1% FCF yield with 4% being returned via buybacks and 3.6% via dividend. Wells Fargo's Friday raise to a $172 target is among the highest on the Street, but consensus has been migrating higher all month. The technical: $150 is psychological resistance; a clean break opens $165–$170 over the coming weeks. Watch any Iran headline as the swing factor — XOM still trades with a 0.7 beta to front-month Brent.
AMD (AMD) — closed Friday at $172, reports Tuesday after the close
The AI-capex bellwether of the cycle and the cleanest data-center pure-play after Nvidia. Q1 consensus is $1.27 EPS on $9.85 billion revenue, with data center segment expected at $4.6 billion (+95% y/y). The number that matters most is MI300 revenue — Bernstein at $2.1 billion is the high end of the buy-side range. Forward commentary on the MI400 ramp into 2H'26 will set the stock either to a new ATH around $200 or to a re-test of the 200-day moving average at $148. Options imply a 7.5% one-day move; positioning is balanced into the print, with a slight short-gamma tilt.
10. Global Macro Snapshot
China's Labour Day holiday has shut down both Shanghai and Shenzhen exchanges through Tuesday, so the early-week tape will lean heavily on Hong Kong as the read-across vehicle. April Caixin Manufacturing PMI on Wednesday and Caixin Services Wednesday will be the first major data; consensus expects 50.4 and 51.8 respectively, both modest expansions. The PBOC fixed the yuan at 7.2640 Friday — a hair stronger than expectations — signaling reluctance to let CNY weaken further into the Iran-driven dollar squeeze. Property remains the structural drag: 70-city home prices fell 6.1% y/y in March.
Europe's story is increasingly defense-driven. Germany's coalition cleared a €350 billion supplemental defense budget last week, with Rheinmetall, Hensoldt, and Renk all extending YTD gains above 80%. The ECB on hold at 2.25% with markets pricing one cut by year-end — far more conservative than the Fed pricing. UK inflation prints Wednesday with consensus at 2.4% y/y, in line with the Bank of England's revised projection. Emerging-market stress is concentrated in Turkey (lira at 38.5/USD, fresh ATL) and South Africa (rand 19.8/USD on coalition-government wobble). Brazil and India remain bid on dollar weakness.
11. Week Ahead Preview
The week's calendar reduces to a single thesis test: does the U.S. labor market crack under the Iran-war oil shock, or does it merely bend? Friday's nonfarm payrolls print is the first labor data fully incorporating the supply-side disruption. Consensus has stepped down to +135k from +178k in March, but the whisper number after this morning's Challenger layoff data is closer to +95k. A sub-100k print pulls forward the September Fed cut to a coin-flip June cut, steepens the curve another 10–15 basis points, and re-energizes the small-cap and regional-bank trade. A +175k upside surprise does the opposite — bear-flattens the curve and challenges the 'cuts are coming' narrative the equity market has been front-running.
Earnings-wise, the AI-capex chain (Palantir Monday, AMD Tuesday, Arm Wednesday, Cloudflare/Datadog Thursday) will set the tone for a sector that drove 65% of S&P 500 returns YTD. Disney Wednesday is the consumer-discretionary read. Geopolitically, watch for any Pakistani statement on a venue and date for U.S.–Iran direct talks; Trump's response to the latest proposal could come at any time, and a 'no deal' tweet could send Brent back to $120 within hours. The G7 finance ministers meet Thursday–Friday in Quebec — likely to issue a coordinated statement on FX volatility and global energy supply. And the week closes with Saudi Aramco's quarterly dividend declaration Sunday — a barometer of OPEC+ confidence.
12. Closing Thought
The risk the market may be most underpricing is not a recession or a hot inflation print — it is a regime shift in correlations. For two decades, the 60/40 portfolio worked because stocks and bonds were negatively correlated: when growth scared, bonds rallied; when growth surprised, equities ran. That regime broke briefly in 2022 and is breaking again now, in a different way. Friday's tape — record-high stocks alongside falling Treasury yields, a falling dollar, rising gold, rising silver, rising copper, rising Bitcoin, falling oil, intervened-into yen — is the tape of a market where every asset is bid for a different reason and no asset is hedging anything else. That is what you would expect if the marginal buyer of every asset class is a sovereign or central bank rotating reserves, not a private allocator pricing risk.
The 1970s parallel keeps getting raised, but the better one might be the late 1960s — the last time a long bull run was punctuated by a foreign-policy shock that re-wrote the inflation, dollar, and gold setup all at once. In that cycle, the tape held up for another 18 months before the correlations reset violently. The lesson is not to be bearish; it is to be diversified in a way that does not assume the diversification of the last 25 years still works. Cash at 5%, Treasuries, gold, and high-quality cyclicals all get a seat at the table now. Have a great weekend, James.
Sources & Disclosures
Data drawn from CNBC, Reuters, FactSet, Trading Economics, Federal Reserve, U.S. Department of the Treasury, Bureau of Labor Statistics, Apple Inc. press releases, Yahoo Finance, Bloomberg, OilPrice.com, CoinMarketCap, MarketBeat, Benzinga, ISM Report on Business, Bank of Japan, and CME Group. Levels and percentage changes reflect Friday, May 1, 2026 closing prints unless otherwise noted. This brief is informational and is not investment advice; figures are rounded for readability and may differ slightly across data vendors.
THE BROOKSIDE BRIEF
A morning briefing on markets, macro, and the day ahead
Wednesday, May 20, 2026 • 9:30 AM ET
1. THE MORNING SETUP
Good morning, and welcome to the most consequential trading day of the quarter. After the closing bell tonight, Nvidia will report — and with it, deliver the single most important verdict the market will hear on whether the AI capital-expenditure supercycle is still accelerating or finally plateauing. The setup is electric: the stock has rebounded 1.6% pre-market to $224 and dragged the entire semiconductor complex up with it (Intel +4.8%, Marvell +4.7%, Micron +3.4%), snapping what had been a grim three-day slide.
That slide has a name, and it is the long bond. The 30-year Treasury yield hit 5.198% yesterday — its highest level since July 2007, nearly nineteen years. A Bank of America fund manager survey out this morning shows 62% of respondents now expect the 30-year to eventually reach 6%, a level last seen in 1999. The S&P 500 fell for a third straight session Tuesday, closing at 7,353.61, as the relentless climb in yields overwhelmed an otherwise calmer oil tape. This is the central tension of the moment: a still-humming earnings story colliding with a bond market that is rapidly repricing the entire cost of capital.
There is real news beyond Nvidia today. Powell speaks at 9:00 a.m. at the Atlanta Fed — his first remarks since the hot CPI/PPI prints. The Treasury sells $16 billion of 20-year bonds at 1:00 p.m., a genuine stress test of demand at these levels. And the retail read continues: Lowe's beat this morning, Target reports before the open. But make no mistake — everything today is a warm-up act for 4:20 p.m., when Jensen Huang steps to the microphone.
2. MARKETS AT A GLANCE
U.S. Equity Futures (pre-open)
Asset
Last
Change
% Chg
S&P 500 (ES)
7,383
+30
+0.40%
Nasdaq 100 (NQ)
25,975
+180
+0.70%
Dow (YM)
49,470
+105
+0.21%
Russell 2000 (RTY)
2,242
+8
+0.36%
Prior Close (Tuesday, May 19)
Asset
Last
Change
% Chg
S&P 500
7,353.61
-49.44
-0.67%
Nasdaq Composite
25,870.71
-220.02
-0.84%
Dow Jones Industrial Avg.
49,363.88
-322.24
-0.65%
Russell 2000
2,233.90
-4.15
-0.19%
VIX
21.6
+1.2
+5.9%
Rates & FX
Asset
Last
Change
% Chg
UST 2-Year
4.39%
+3 bps
—
UST 10-Year
4.67%
+7 bps
—
UST 30-Year
5.19%
+7 bps
19-yr high
DXY (Dollar Index)
99.45
+0.27
+0.27%
EUR/USD
1.0708
-0.0034
-0.32%
USD/JPY
158.90
+0.70
+0.44%
Commodities & Crypto
Asset
Last
Change
% Chg
WTI Crude (Jun)
$102.40
-$0.70
-0.68%
Brent Crude (Jul)
$106.10
-$0.75
-0.70%
Gold (spot)
$1,755
-$7
-0.40%
Silver (spot)
$20.18
-$0.14
-0.69%
Bitcoin
$77,150
-$1,270
-1.62%
Asia & Europe
Asset
Last
Change
% Chg
Nikkei 225
38,205
-180
-0.47%
Hang Seng
21,025
-55
-0.26%
Australia ASX 200
8,455
-23
-0.27%
Stoxx Europe 600
556.10
-1.10
-0.20%
FTSE 100
8,705
+10
+0.11%
DAX
19,860
-60
-0.30%
3. TOP STORIES
Nvidia Reports Tonight — The AI Trade's Make-or-Break Moment
At 4:20 p.m. ET, Nvidia delivers Q1 FY27 results, with the Street looking for $1.76 in EPS (up from $0.96 a year ago) on revenue of $79.04 billion — a 78% year-over-year jump. But as every desk note this morning reiterates, the print is about guidance, not the quarter. Consensus for Q2 FY27 revenue sits near $87 billion; the bull case wants $90B-plus, and the whisper number for data-center revenue is $74 billion. The options market is pricing a ±7.2% move — roughly $250 billion of market cap in either direction. Nvidia rebounded 1.6% to $224 pre-market, leading a broad semiconductor bid (SMH +2.2%) that has lifted the entire tape out of its three-day funk. The risk symmetry is brutal: a beat-and-raise likely reignites the year-end chase, while any guidance wobble — especially on China or gross margins — confirms the rotation out of megacap growth that has been quietly underway for two weeks.
30-Year Yield Hits 19-Year High — Fund Managers Eye 6%
The long bond yield touched 5.198% Tuesday, its highest since July 2007, and is holding near 5.19% this morning. The move is no longer a curiosity — it is the dominant macro force in the market. A BofA global fund manager survey released today found 62% of respondents expect the 30-year to eventually reach 6%. The mechanical consequences are spreading: the 30-year fixed mortgage rate has climbed to 7.91%, the highest of the cycle; auto-loan and small-business borrowing costs are following; and the equity risk premium — the excess yield stocks offer over bonds — has compressed to its thinnest since 2002. Today's $16B 20-year auction at 1:00 p.m. is the immediate test. A weak result would send the long end higher still and could overshadow even Nvidia.
Lowe's Beats; Target on Deck — Consumer Read Stays Resilient
Lowe's reported Q1 net sales of $23.1 billion (up from $20.9B a year ago), net income of $1.63 billion, and adjusted EPS of $3.03 — ahead of estimates. Comparable sales rose 0.6%, with online sales up a striking 15.5% and continued strength in Pro, appliances, and home services. Management guided full-year adjusted EPS to $12.25–$12.75. Coming a day after Home Depot's beat, the read-through is clear: the rate-sensitive home-improvement consumer is bending but emphatically not breaking. Target reports before the open this morning; the bar is low after a 22% YTD decline, with management having guided Q1 EPS to roughly flat versus last year's $1.30 and full-year EPS to $7.50–$8.50. A clean Target print could trigger an outsized relief rally given how bearishly the stock is positioned.
Powell Speaks at 9:00 — First Remarks Since the Inflation Shock
Chair Powell opens the Atlanta Fed's financial markets conference at 9:00 a.m. ET, his first public remarks since the April CPI (+3.8% Y/Y) and PPI (+6.0% Y/Y) prints upended the rate outlook. The market is desperate for signal on whether the Committee views the energy-driven inflation surge as transitory or structural. Any deviation from the careful April 29 statement language — particularly the phrase that inflation is elevated 'in part reflecting the recent increase in global energy prices' — will move the front end of the curve hard. With the long bond already at a 19-year high, Powell has every incentive to sound measured. Whether the market lets him is another question.
Oil Stabilizes Near $102 as Iran Diplomacy Limps Forward
WTI is holding near $102 and Brent near $106 this morning, consolidating after Monday's sharp drop on news that President Trump shelved a planned strike. Iran submitted an updated peace proposal to mediators in Pakistan, but the White House reportedly considers it insufficient, and Tehran's Tasnim agency says U.S. conditions remain 'overly demanding.' The Strait of Hormuz remains partially restricted, with tanker traffic well below normal. For now, oil has stopped being the marginal driver of the tape — the bond market has taken that mantle — but the deadlock means the energy inflation premium has not gone away. A collapse in talks would put $115 Brent back in play within days.
4. MACRO & FED WATCH
Two Fed events bracket the next 30 hours: Powell at 9:00 a.m. today, and the April 28–29 FOMC minutes tomorrow at 2:00 p.m. The minutes are the bigger market event. They will reveal how deep the four-way dissent ran — Hammack and Logan pushed for a hike, Kashkari wanted optionality — and whether the Committee's confidence that 'longer-run inflation expectations remain anchored' is fraying. With the 30-year at a 19-year high, the bond market is effectively front-running a hawkish read.
Fed funds futures now price a 41% probability of a hike by December (up from 38% Monday and 12% a month ago) and effectively 100% by March 2027. The repricing has been violent and one-directional. The only thing that reliably reverses it would be a genuine growth scare — which is why Friday's flash PMIs, and any softening in the labor data, suddenly matter more than they have in months. For now, the curve is bear-steepening: the 2s30s spread has widened to 80 basis points, the steepest since 2021.
5. ECONOMIC CALENDAR — REST OF WEEK
Day
Time (ET)
Release
Consensus / Actual
Wed 5/20
Before open
Lowe's (LOW) Q1 — BEAT ✓
Actual: adj $3.03 / $23.1B
Wed 5/20
Before open
Target (TGT) Q1
EPS ~$1.30 / Rev $24.5B
Wed 5/20
9:00 AM
Powell remarks — Atlanta Fed
—
Wed 5/20
1:00 PM
20-Yr Treasury auction ($16B)
—
Wed 5/20
After close
Nvidia (NVDA) Q1 FY27
EPS $1.76 / Rev $79.0B
Thu 5/21
8:30 AM
Building Permits / Housing Starts (Apr)
1.44M / 1.36M
Thu 5/21
8:30 AM
Initial Jobless Claims
228K
Thu 5/21
8:30 AM
Philly Fed Mfg. (May)
-2.0
Thu 5/21
Before open
Walmart (WMT) Q1
EPS $0.66 / Rev $171B
Thu 5/21
10:00 AM
Existing Home Sales (Apr)
4.10M
Thu 5/21
2:00 PM
FOMC Minutes (Apr 28–29)
—
Fri 5/22
9:45 AM
S&P Global Flash PMIs (May)
Mfg 49.2 / Svc 51.3
6. EARNINGS WATCH
The week's two storylines — AI capex and the rate-pressured consumer — both crest today. On the consumer side, Lowe's beat (adj. $3.03, comps +0.6%, online +15.5%) confirms the Home Depot read: home-improvement demand is stabilizing even with mortgage rates near 8%. Target before the open is the wild card; sentiment is washed out, short interest elevated, and the options market implies a ±8.5% move. A beat plus reaffirmed guidance is the recipe for a squeeze.
But the marquee event is Nvidia tonight. The setup matters as much as the number: with the stock having bounced off a multi-week low, positioning is no longer one-sided, which raises the bar for a clean upside reaction. Watch three things on the call — Q2 revenue guidance (>$90B is the bull line), gross margin trajectory (Blackwell ramp costs), and any commentary on China H20 shipments. Walmart Thursday closes the retail trifecta; consensus $0.66 / $171B with ex-fuel U.S. comps seen +3.86%. Roughly 95% of the S&P 500 has now reported Q1, with blended growth at +11.4% and 76% beating on EPS.
7. SECTOR SPOTLIGHT: SEMICONDUCTORS
All eyes — and an outsized share of index weight — sit on the chips today. The iShares Semiconductor ETF (SMH) is up 2.2% pre-market, with the rebound notably broad: Intel +4.8%, Marvell +4.7%, Micron +3.4%, Broadcom +2.1%, AMD +1.9%. The breadth matters because it suggests the bid is a genuine pre-Nvidia risk-on rotation rather than a narrow Nvidia-only trade. Year-to-date, the SOX index is up just 3% — a striking underperformance versus the AI narrative, and a sign that the group has already de-rated meaningfully on rate and China-export concerns.
The asymmetry into tonight is the whole story. The semis carry roughly 11% of S&P 500 weight; a 7% Nvidia move translates to roughly 30 S&P points on its own, before the sympathy moves in AMD, Broadcom, and the hyperscalers (MSFT, GOOGL, META, AMZN) that buy Nvidia's chips. This is the rare single corporate event with genuine index-level consequences — closer to a Fed day than an ordinary earnings report.
8. ANALYST CALLS DRIVING ACTION
Notable upgrades / target hikes: Most-accurate analysts revised Nvidia targets higher into the print — Morgan Stanley to $245 (from $230), Cantor to $260 (from $220), and Melius to $275, the Street high. Citi reiterated Buy on Lowe's (LOW) with a $290 PT post-earnings. Evercore upgraded Intel (INTC) to In-Line with a $120 PT on foundry-order momentum. KeyBanc raised Micron (MU) to Overweight on HBM pricing power.
Notable downgrades / target cuts: Wells Fargo cut its 30-year-rate-sensitive REIT coverage, downgrading Realty Income (O) and Federal Realty (FRT) to Equal-Weight. Barclays trimmed homebuilder targets across the board (DHI, LEN, PHM) on the mortgage-rate spike. Goldman cut long-duration tech names UiPath (PATH) and Snowflake (SNOW) on multiple compression from higher discount rates.
9. STOCKS TO WATCH
Nvidia (NVDA) — Pre-market $224, up 1.6%. Reports after close. Implied move ±7.2%. Q2 guidance above $90B is the bull line; watch China H20 commentary and Blackwell gross margins.
Target (TGT) — Reports before open. Implied move ±8.5%. Washed-out sentiment + low bar = squeeze setup on any clean print.
Lowe's (LOW) — Up ~3% pre-market on the beat. Watch follow-through above the $250 level.
Intel (INTC) — +4.8% pre-market to $115.58, leading the chip rebound on foundry-order momentum and the Evercore upgrade.
Micron (MU) — +3.4% on the KeyBanc upgrade and HBM pricing tailwinds; a key Nvidia-supply-chain proxy into tonight.
Homebuilders (DHI, LEN, PHM) — Under pressure as the 30-year mortgage rate hits 7.91%. Barclays target cuts add to the bearish tone.
TLT (20+ Yr Treasury ETF) — At a fresh 52-week low. The single cleanest expression of the long-bond stress; watch the 1:00 p.m. 20-year auction for the next leg.
10. GLOBAL MACRO SNAPSHOT
Europe: Stoxx 600 modestly lower, tracking the U.S. rates move; the German 10-year Bund yield climbed to 2.78%, a fresh multi-month high, in sympathy with Treasuries. UK April CPI printed +3.3% Y/Y this morning, a touch hotter than the 3.2% consensus, reinforcing the global inflation-stickiness narrative. ECB's Lagarde speaks tomorrow at the Brussels Forum.
Asia: Markets reopened after Monday's holidays and traded modestly lower — Nikkei -0.47%, Hang Seng -0.26% — as the global bond selloff weighed. Japan's stronger-than-expected Q1 GDP (+2.1% annualized) keeps a June BoJ hike on the table; the yen held near 158.90.
Emerging markets: The renewed dollar bid is pressuring EM FX again after Monday's reprieve. Turkey's central bank decision tomorrow is the regional focus; consensus is for the benchmark to hold at 50%. India's Sensex remains the EM outperformer, up 2% over the past month.
11. WEEK AHEAD PREVIEW
The next 30 hours carry more event risk than the rest of the month combined.
(1) Tonight, after close — Nvidia. Q2 guidance above $90B reignites the AI trade and likely the broad tape; below $87B confirms the rotation out of megacap growth.
(2) Tomorrow 2:00 p.m. — FOMC minutes. The read on how serious the hike camp is. A hawkish set of minutes pushes the 30-year toward 5.25%+.
(3) Friday 9:45 a.m. — flash PMIs. The first hint of whether the rate and energy shock is finally crimping growth — the one development that could reverse the relentless bond selloff.
Also on deck: Walmart Thursday (the consumer's marquee print) and Powell today at 9:00.
12. THE CLOSING THOUGHT
Markets love a clean narrative, and today they have an unusually pure one: a single company, reporting after a single bell, will tell us whether the defining investment theme of the decade is still intact. But the more important story may be the quieter one playing out in the bond market, where the 30-year yield just hit a level not seen in nineteen years and fund managers are openly discussing 6%. If Nvidia delivers and the AI trade roars back, the celebration could be short-lived — because a 6% long bond eventually breaks something, whether it is housing, leveraged credit, or the equity multiple itself. Tonight we learn about the numerator. The denominator, sitting at 5.19% and climbing, is the part that should keep you up at night. Trade it carefully.
— The Brookside Brief • Compiled 9:30 AM ET • Sources: WSJ, CNBC, CNN, Bloomberg, Reuters, Kiplinger, TradingEconomics, S&P Global, BLS, U.S. Treasury —
Good morning. Yesterday's session ranks among the strangest of the cycle: the macro data delivered exactly what the bulls had asked for — May core CPI printed at +0.2% month-over-month against +0.3% consensus, the softest reading since January — and the equity market promptly took its second-largest one-day decline of the quarter. The Dow dropped 901.52 points (-1.87%) to 49,918.78, falling below the 50,000 line; the S&P 500 lost 1.62% to 7,266.99; the Nasdaq Composite slid 1.98% to 25,169.50. The dovish inflation surprise was real, and the bond market correctly rewarded it — the 10-year yield closed at 4.45%, down seven basis points. But two corporate stories overwhelmed the macro relief.
First, Oracle. The company beat on EPS ($1.96 vs $1.62 consensus, +15.3% Y/Y) but lifted annual capex to $55.7 billion from prior $50 billion guidance — and the stock plunged 7% after-hours on the disclosure. The buy-side concern is not the absolute capex figure; it is what the unbudgeted $5.7 billion increment implies about AI-infrastructure margin trajectory and the rate at which OCI revenue is converting to operating profit. The read-through hit the entire hyperscaler complex: Microsoft, Alphabet, and Meta all closed lower in sympathy. Second, Iran-Israel tensions flared again overnight, with crude extending its bid — WTI back near $95, Brent above $97. The combination broke the soft-CPI rally before it began.
Today's setup is a stress test. PPI lands at 8:30 a.m. — consensus a hot +0.7% m/m headline and +0.4% core, the highest expected supply-chain inflation in twelve months. The ECB rate decision and SpaceX IPO pricing both arrive after the U.S. close. Adobe reports tonight with a $25 billion buyback announcement as the backstop. And the SpaceX book closed Wednesday four times oversubscribed — more than $250 billion in orders against the $75 billion offered, the strongest institutional book of any IPO in modern memory. The Sector Spotlight (Section 7) connects these two stories: the simultaneous AI-capex digestion in the public market and the AI-equity-supply euphoria in the IPO book.
2. MARKETS AT A GLANCE
U.S. EQUITY FUTURES (PRE-OPEN)
Asset
Last
Change
% Chg
S&P 500 (ES)
7,287
+20
+0.27%
Nasdaq 100 (NQ)
25,260
+90
+0.36%
Dow (YM)
49,975
+55
+0.11%
Russell 2000 (RTY)
2,256
+5
+0.22%
PRIOR CLOSE (WEDNESDAY, JUNE 10 — SOFT CPI, HARD SELL)
Asset
Last
Change
% Chg
S&P 500
7,266.99
-142.21
-1.62%
Nasdaq Composite
25,169.50
-794.60
-1.98%
Dow Jones Industrial Avg.
49,918.78
-901.52
-1.87%
Russell 2000
2,251.30
-39.10
-1.71%
VIX
22.4
+3.0
+15.5%
RATES & FX
Asset
Last
Change
% Chg
UST 2-Year
4.32%
-6 bps
soft CPI
UST 10-Year
4.45%
-7 bps
soft CPI
UST 30-Year
4.94%
-6 bps
—
10-Yr TIPS (real)
2.18%
-4 bps
—
DXY (Dollar Index)
98.30
-0.25
-0.25%
EUR/USD
1.0815
+0.0015
+0.14%
USD/JPY
156.40
-0.30
-0.19%
COMMODITIES & CRYPTO
Asset
Last
Change
% Chg
WTI Crude (Jul)
$95.10
+$2.30
+2.48%
Brent Crude (Aug)
$97.15
+$1.95
+2.05%
Gold (spot)
$1,828
+$10
+0.55%
Silver (spot)
$21.40
+$0.18
+0.85%
Bitcoin
$82,800
-$1,100
-1.31%
ASIA & EUROPE
Asset
Last
Change
% Chg
Nikkei 225
38,720
-695
-1.76%
Hang Seng
21,720
-280
-1.27%
Australia ASX 200
8,318
-132
-1.56%
Stoxx Europe 600
562.40
-4.90
-0.86%
FTSE 100
8,755
-60
-0.68%
DAX
20,180
-195
-0.96%
3. TOP STORIES
Oracle Beats on EPS but Capex Jumps to $55.7B — Stock −7% After Hours
Oracle's Q4 was the textbook 'good news, bad reaction' print. EPS of $1.96 beat $1.62 consensus by 21% on revenue of $15.9 billion (+8% Y/Y). RPO crossed $138 billion, comfortably above the buy-side's $135B threshold. OCI revenue grew 56% year-over-year. By any historical measure these are exceptional numbers. But management lifted full-year capex guidance to $55.7 billion from the prior $50 billion — an $5.7B overshoot driven entirely by AI-infrastructure build-out — and the stock fell 7% after the close. The concern is not absolute spend; it is the implied trajectory of free-cash-flow conversion. If AI capex consistently outruns guidance by 10%+, the operating-margin path the market had been modeling breaks down. The hyperscaler complex finished Wednesday lower in sympathy: Microsoft -2%, Alphabet -3%, Meta -2.5%.
The SpaceX book closed Wednesday with institutional demand running between 3.5x and 4x the $75 billion offered — orders totaling more than $250 billion. Pricing is set for after today's close at the fixed $135 per share; trading begins Friday on Nasdaq and Nasdaq Texas under ticker SPCX. Allocations will favor long-term holders, with roughly 30% reserved for retail. The gray market — where pre-listing trades occur informally — is reportedly showing a modestly shrinking premium versus 24 hours ago, which a few desks are reading as a hint that the first-day pop could underwhelm the most aggressive flippers. But a 4x oversubscribed book with $250B+ of indicated demand is, by any measure, an extraordinary institutional vote of confidence in the AI-capex story.
Soft Core CPI Was Real — But the Selloff Was About Oracle, Not Inflation
May headline CPI printed at +0.5% m/m as expected; core CPI at +0.2% m/m (vs +0.3% consensus) was the softest reading since January and a clean dovish surprise. The Cleveland Fed's services-ex-shelter sub-component also cooled. By the conventional script, a soft core print on a CPI Wednesday should have lifted the duration-sensitive growth complex and sent yields sharply lower. Yields did fall (10-year -7 bps to 4.45%) — but the equity market sold off anyway because the marginal catalyst was Oracle's capex shock, not the inflation data. This is an important lesson: the bond market and the equity market can interpret the same day in very different ways when company-specific signals diverge from the macro signal. The dovish CPI remains structurally bullish for risk; the operating concern around AI infrastructure is now a separate, valid risk to monitor.
PPI This Morning, ECB This Afternoon
Two more data prints into the SpaceX pricing. PPI at 8:30 a.m. ET is expected at +0.7% m/m headline and +0.4% core — both hot relative to recent history and a function of the May oil bid. A core PPI miss to the downside (sub-0.3%) would extend the soft-CPI relief; an in-line or upside print would suggest the energy pass-through to producer prices is still running. The ECB rate decision arrives at 8:15 a.m.; consensus is a hold at the current 2.5% deposit rate, with President Lagarde's press conference at 8:45 the more important communication moment.
Iran-Israel Tensions Reignite; Oil Up 2.5%
Overnight reports indicated fresh Iranian missile launches toward Israeli air bases and Israeli retaliatory strikes inside Iran. The Strait of Hormuz remains effectively closed; the additional escalation pushed WTI up 2.48% to $95.10 and Brent up 2.05% to $97.15. The renewed Middle East tape was the second leg of yesterday's equity selloff, alongside Oracle. Gold extended its haven bid at $1,828; the dollar softened modestly on rate-differential math as Treasury yields fell faster than European yields.
4. MACRO & FED WATCH
Yesterday's soft core CPI is genuinely the most constructive inflation data point we have had in two months. December-hike odds dropped from 31% to 24% on the print. The June 17-18 FOMC remains a near-certain hold; Chair Warsh's first dot plot will now have the unenviable task of reconciling (a) the hot May NFP, (b) the soft May core CPI, and (c) Brent at $97 with Hormuz closed. We expect a median dot consistent with one rate cut by year-end and an opening communication that emphasizes both the 'remaining uncertainty around the inflation path' and 'a labor market that remains solid.' Market reaction will depend almost entirely on whether the 2027 dots cluster around 75 bps of cuts or 25 bps.
Today's PPI is the second piece. The headline is expected hot at +0.7% m/m on the back of the energy bid; the core read is what matters for the Fed conversation. If core PPI comes in at +0.4% as consensus or higher, the soft CPI begins to look like a one-month aberration rather than a trend. The 10-year auction Wednesday came in modestly weak (a 1.7-basis-point tail), which suggests duration appetite is real but not unlimited; today's 30-year auction at 1:00 p.m. will be a cleaner read.
5. ECONOMIC CALENDAR — THIS WEEK
Day
Time (ET)
Release
Consensus / Actual
Mon 6/8
1:00 PM
Apple WWDC — released
Gemini deal; AAPL -1.89%
Wed 6/10
8:30 AM
CPI (May) — released
Core +0.2% m/m ✓ SOFT (vs +0.3% est)
Wed 6/10
After close
Oracle (ORCL) — BEAT, CAPEX SHOCK
Stock -7% AH on $55.7B capex
Thu 6/11
8:15 AM
ECB Rate Decision
Hold at 2.5%
Thu 6/11
8:30 AM
PPI (May)
Headline +0.7% / Core +0.4% m/m
Thu 6/11
8:30 AM
Initial Jobless Claims
225K
Thu 6/11
1:00 PM
30-Yr Treasury auction
—
Thu 6/11
After close
Adobe (ADBE) — $25B buyback
Firefly metrics key
Thu 6/11
Late PM
SpaceX (SPCX) IPO pricing
$135 / $1.77T (4x oversub)
Fri 6/12
Open
SpaceX (SPCX) trading debut
Nasdaq + Nasdaq Texas
Tue 6/17–Wed 6/18
2:00 PM
FOMC + dot plot — KEY
Warsh's first
6. EARNINGS WATCH
Adobe's print tonight carries unusual weight after the Oracle reaction. Consensus is $5.07 EPS / $5.83B revenue, with Firefly run-rate disclosure the marquee number — the bulls want $400M+ annualized; consensus implies ~$300M. Critically, Adobe has paired the print with a freshly announced $25 billion buyback authorization, which provides a meaningful share-price backstop even if the operating commentary disappoints. The setup is: a decent print plus the buyback support extends the AI-software relief; a wobble on Firefly monetization combined with any capex guidance increase risks a CrowdStrike-style double-digit decline.
Beyond Adobe, the calendar thins meaningfully into next week's FOMC. Smucker, Kroger, and Restoration Hardware are the consumer prints worth tracking. Big-bank Q2 reporting begins July 14 with JPMorgan, Wells Fargo, and Citi. The intervening four-week window is macro-dominated.
7. SECTOR SPOTLIGHT: THE AI-CAPEX RECKONING MEETS THE IPO EUPHORIA
Yesterday surfaced a tension that has been building since Dell's $51 billion AI-server backlog disclosure two weeks ago: the simultaneous extraordinary demand for AI-themed equity supply and the operational reality that AI infrastructure is meaningfully more capital-intensive than the buy-side had modeled. Oracle's $55.7B capex disclosure — $5.7B above prior guidance — is not a one-off. It follows similar capex-raise patterns from Microsoft (Q1 capex guide lifted in April), Meta (capex run-rate now above $50B/year), and the persistent supply-chain bottleneck flagged in Citrini Research's humanoid piece yesterday. The arithmetic underlying the AI build-out is becoming punishing in the near term, even as the long-term thesis remains intact.
WHY CAPEX MATTERS MORE THAN YOU MIGHT THINK
Capital expenditure — money spent today on durable assets like data centers, GPUs, and transmission lines — does not flow through to the income statement immediately. It is depreciated over years. But it consumes cash flow now, even as the revenue it enables typically lags by 12 to 36 months. A company growing both revenue and capex at 50% looks fine on the surface; the same company with capex running 65% growth while revenue grows 50% is silently compressing its free-cash-flow margin every quarter. Oracle's $55.7B versus $50B guide implies the FCF margin path the buy-side had modeled is roughly 3-4 percentage points lower than expected. On a stock priced for ~30% FCF margins, that is a meaningful re-rating event — which is exactly what the 7% after-hours decline reflected.
Now consider the SpaceX book. Four times oversubscribed. More than $250 billion in indicated institutional demand. By any historical comparison — Saudi Aramco's 2019 listing was 4.6x oversubscribed; Facebook's 2012 IPO was 25x — this is an extraordinary institutional vote of confidence in the AI-capex thesis. The contradiction is striking: the public market sold Oracle 7% on a $5.7B capex overrun while the institutional book for SpaceX (whose S-1 cites $28.5 trillion in TAM, much of it AI-dependent) cleared at four times the offered supply.
We think this resolves in one of two ways over the next six months. Either (a) SpaceX, Anthropic, and OpenAI all trade meaningfully above their IPO marks for an extended period, which validates the cost-of-equity assumption underlying the broader AI capex cycle and vindicates the Aschenbrenner-style thesis — at which point the Oracle capex shock looks like noise; or (b) the IPO complex trades poorly within three-to-six months, the implied cost of equity for AI infrastructure rises sharply, and the entire complex re-rates lower as both capex guidance and equity supply confront the discipline Damodaran described last week. We genuinely do not know which path plays out — but we know that SPCX's first six months of trading is the most important data set the market will produce in 2026 outside the FOMC.
The investable implications. First, the AI-power complex (CEG, VST, TLN, GEV, ETN, PWR) continues to look attractive precisely because the cash flows are contracted: nothing Oracle does on capex changes the value of Constellation's multi-decade Microsoft PPA. Second, the physical-AI picks-and-shovels we walked through yesterday (Harmonic Drive, Cognex, Teradyne, Symbotic) are positioned similarly — specialized inputs with concentrated supply and limited capex exposure. Third, within the hyperscaler complex, we are increasingly inclined to favor the names with the cleanest capex-to-revenue conversion (Microsoft, Alphabet) over the names with the largest absolute capex programs still being announced (Oracle, Meta in the current environment).
8. ANALYST CALLS DRIVING ACTION
Notable upgrades / target hikes: Citi raised Microsoft (MSFT) PT to $560 from $530 on the AI-capex/OCI read-through. Morgan Stanley raised Constellation Energy (CEG) PT to $430. Goldman raised Cognex (CGNX) PT to $62 on humanoid-vision exposure. Bernstein reiterated Outperform on Talen Energy (TLN) at $415.
Notable downgrades / target cuts: A flood of Oracle (ORCL) PT cuts overnight — Wells Fargo to $135 from $170, JPMorgan to $145, Citi to $150. Several desks revised Snowflake (SNOW) and Datadog (DDOG) lower in sympathy. Wedbush cut Lululemon (LULU) PT to $200 on softening international comp data. Defense primes (LMT, RTX) bumped higher on the Iran escalation.
9. STOCKS TO WATCH
SpaceX (SPCX) — Prices tonight at $135 (4x oversubscribed book). Trades Friday on Nasdaq + Nasdaq Texas. The defining single-name event of June.
Adobe (ADBE) — Reports tonight. $25B buyback announced. The post-Oracle AI-software re-test with a meaningful share-price backstop.
Oracle (ORCL) — Watch the $200 level pre-market; a hold and reversal off the low would suggest the capex shock is digested.
Microsoft (MSFT) / Alphabet (GOOGL) — Cleaner capex-to-revenue conversion. Citi MSFT to $560.
Tesla (TSLA) — Optimus gen-3 production headline still in focus; SPCX trading Friday creates new Musk-empire comparable.
Europe: A soft open, tracking the U.S. selloff. ECB rate decision at 8:15 a.m. is the morning event; consensus is a hold at 2.5%, with Lagarde's press conference at 8:45 the more important communication. Stoxx 600 is down 0.86%, with banks and industrials leading the decline.
Asia: An ugly session — Nikkei -1.76%, Hang Seng -1.27% — as the Oracle AH news plus Wednesday's U.S. selloff hit the chip and AI-supply complex hard. TSMC, SK Hynix, Tokyo Electron all down 2-3%. Notably, Harmonic Drive Systems (TYO: 6324) held up relatively well at -1.0% — a small but real divergence between the broader chip complex and the robotics picks-and-shovels names.
Emerging markets: The combination of higher oil, risk-off, and stronger dollar is pressuring the EM complex. India's rupee weaker; the won and rupiah both softer. Brazil and Mexico holding on commodity terms-of-trade.
11. WEEK AHEAD PREVIEW
The remainder of this week is defined by SpaceX.
(1) Today 8:30 a.m. — PPI. A soft core print extends the CPI relief.
(2) Today 8:15 — ECB hold expected; Lagarde at 8:45.
(3) Today after close — Adobe + SpaceX pricing. Adobe's Firefly metrics; SPCX's final book.
(4) Friday open — SpaceX begins trading. The single most important price-discovery event of June. Watch the gray-market premium evolution into the open.
FOMC June 17–18: Warsh's first dot plot. The macro confirmation of the dovish CPI read.
12. THE CLOSING THOUGHT
There is a useful framework for understanding what happened yesterday: the macro data improved, the micro reality disappointed, and the equity market chose to weight the micro. That is the right call when the marginal corporate signal is decisive — and Oracle's $55.7B capex disclosure was genuinely decisive for the buy-side's AI-infra operating model. But it is worth holding two thoughts at once. First, the CPI relief was real, and the bond market's seven-basis-point rally captured it correctly. Second, the $250 billion SpaceX book is also real, and however much capex discipline you bring to AI valuations, an institutional book that size on a single name is a vote of confidence in the structural story that even Damodaran's discipline cannot fully discount. We remain on the AI-power picks-and-shovels and the physical-AI specialty suppliers as the cleanest expression of the long-term thesis with the smallest exposure to either capex shocks or first-day IPO disappointments. Trade it carefully — and watch SPCX's open tomorrow.
THE BROOKSIDE BRIEF · COMPILED 9:30 AM ET · SOURCES: WSJ, CNBC, BLOOMBERG, REUTERS, BLS, BEA, ECB, ASWATH DAMODARAN SUBSTACK, CITRINI RESEARCH SUBSTACK, NEXT FINANCIAL SUBSTACK, U.S. TREASURY
Good morning, and welcome to a Friday with two genuinely historic events on the tape. Sometime later this morning — likely between 11:00 a.m. and 1:00 p.m. ET after an extended price-discovery process — SpaceX will begin trading under SPCX on the Nasdaq at an IPO price of $135 per share and a starting valuation of $1.77 trillion. Prediction markets are now assigning roughly 83% probability to a first-trade between $150 and $200, implying an intraday market cap of $2.0 to $2.6 trillion. By any measure, this is the largest IPO in history. By any measure, the institutional book — closed Wednesday at four-times oversubscribed, with $250B+ of indicated demand — vindicates the Aschenbrenner-style trillion-dollar-capex thesis we have been tracking.
But the macro story is, if anything, bigger. Yesterday afternoon, President Trump called off planned U.S. strikes against Iran and signaled that 'the U.S. is going to soon sign a deal' with Tehran. Markets exploded higher on the news: the Dow climbed 929.97 points (+1.86%), the S&P added 1.75%, and the Nasdaq Composite gained 2.54%. Overnight, the peace signal has held — fresh reporting suggests a 'provisional agreement to end the war' is imminent — and oil has cratered. WTI is down 3.97% to $84.23, Brent off 3.84% to $86.91. Treasury yields have dropped in sympathy: the 10-year is at 4.36%, the 30-year at 4.85%, the 10-year TIPS real yield at 2.10%. After a hot PPI miss yesterday (headline +1.1% vs +0.7% est), the bond market is effectively choosing the Iran-peace story over the inflation print.
Today's Sector Spotlight (Section 7) is dedicated to that choice. We have spent the past week walking through real-rate mechanics; today's tape — an oil collapse from $97 to $87 in 24 hours combined with a yield drop — is the textbook example of what we mean when we describe the Iran tape as a real-rate input. The cleanest single-day shift in inflation expectations since April is happening in front of us. And it is happening on the same day the largest IPO in history begins trading. Watch carefully.
2. MARKETS AT A GLANCE
U.S. EQUITY FUTURES (PRE-OPEN)
Asset
Last
Change
% Chg
S&P 500 (ES)
7,438
+44
+0.59%
Nasdaq 100 (NQ)
25,990
+180
+0.70%
Dow (YM)
51,105
+255
+0.50%
Russell 2000 (RTY)
2,322
+11
+0.49%
PRIOR CLOSE (THURSDAY, JUNE 11 — IRAN PEACE RALLY)
Asset
Last
Change
% Chg
S&P 500
7,394.30
+127.31
+1.75%
Nasdaq Composite
25,809.66
+640.16
+2.54%
Dow Jones Industrial Avg.
50,848.75
+929.97
+1.86%
Russell 2000
2,308.20
+56.90
+2.53%
VIX
18.2
-4.2
-18.8%
RATES & FX
Asset
Last
Change
% Chg
UST 2-Year
4.24%
-8 bps
Iran peace
UST 10-Year
4.36%
-9 bps
Iran peace
UST 30-Year
4.85%
-9 bps
Iran peace
10-Yr TIPS (real)
2.10%
-8 bps
—
DXY (Dollar Index)
98.15
-0.15
-0.15%
EUR/USD
1.0830
+0.0015
+0.14%
USD/JPY
155.90
-0.50
-0.32%
COMMODITIES & CRYPTO
Asset
Last
Change
% Chg
WTI Crude (Jul)
$84.23
-$3.48
-3.97%
Brent Crude (Aug)
$86.91
-$3.48
-3.84%
Gold (spot)
$1,810
-$18
-0.98%
Silver (spot)
$21.30
-$0.10
-0.47%
Bitcoin
$85,200
+$2,400
+2.90%
ASIA & EUROPE
Asset
Last
Change
% Chg
Nikkei 225
39,290
+570
+1.47%
Hang Seng
21,980
+260
+1.20%
Australia ASX 200
8,430
+112
+1.35%
Stoxx Europe 600
566.80
+4.40
+0.78%
FTSE 100
8,810
+55
+0.63%
DAX
20,335
+155
+0.77%
3. TOP STORIES
SpaceX Debuts Today: $135 IPO Price, $150–200 Open Range Implied
SPCX begins trading sometime this morning on Nasdaq and Nasdaq Texas after an extended price-discovery period — Nasdaq market-makers are guiding for a first trade likely between 11:00 a.m. and 1:00 p.m. ET. The IPO priced last night at the fixed $135 per share, with 555.6 million shares sold for a $75 billion raise — the largest U.S. IPO in history. Polymarket and other prediction venues are assigning ~83% probability to a first-trade between $150 and $200, implying a $2.0 to $2.6 trillion intraday market capitalization. The four-times-oversubscribed institutional book ($250B+ in orders) gives the syndicate real ammunition to defend a premium open. One wrinkle worth tracking: Senator Elizabeth Warren publicly urged the SEC to delay the listing yesterday on investor-protection concerns related to the dual-class voting structure. The letter is unlikely to affect today's trading but adds a regulatory tail to the post-listing story.
The single most consequential macro headline of June arrived around 3:30 p.m. ET Thursday: President Trump confirmed he had called off planned U.S. military strikes against Iran scheduled for that evening and said the two countries 'are going to soon sign a deal.' The S&P rallied two-thirds of its 1.75% gain in the final 90 minutes of trading. Overnight, the de-escalation signal has held — fresh reporting suggests a 'provisional agreement to end the war' is being finalized — and oil has plunged. WTI is down 3.97% to $84.23, Brent off 3.84% to $86.91. Crude is now at its lowest since April, when this conflict began. If the Strait of Hormuz reopens to commercial tanker traffic in the next 30 days as the latest reporting suggests, the structural inflation premium that has constrained Fed flexibility all spring evaporates within weeks.
Adobe −7% Premarket Despite $25B Buyback — Firefly Falls Short
Adobe reported after Thursday's close. Headline numbers were respectable: EPS of $5.12 beat $5.07 consensus on revenue of $5.85 billion. The company also confirmed a $25 billion share-repurchase authorization. But Firefly's disclosed annual run-rate landed at ~$285 million — short of the $300M consensus implied and well below the $400M bull case. Management's commentary on the path to disclosed AI revenue was characterized by buy-side desks as 'evasive on the unit economics.' The stock is down 7% in pre-market trade. Combined with Oracle's −9% Thursday extension on the capex disclosure, the AI-software complex has now lost a meaningful slug of its post-NFP recovery.
PPI Hot but Bond Market Doesn't Care — The Iran Trade Dominates
May headline PPI printed +1.1% m/m, well above the +0.7% consensus; core PPI was +0.4% in line. Under any normal interpretation, that was a hawkish print — and it would normally have pushed yields meaningfully higher. Instead, the 10-year fell 9 bps to 4.36%. The explanation is straightforward: bond markets are forward-looking, and the largest single input to the May PPI headline was energy, which is now collapsing on the Iran peace signal. The market is choosing to weight the leading indicator (oil and inflation expectations) over the lagging indicator (the May report itself). This is the right framework — see Section 7.
FOMC Five Days Out: Warsh's First Dot Plot Now Has Cover
Wednesday's soft core CPI, Thursday's Iran peace signal, and the resulting collapse in oil and yields together give Chair Warsh a meaningfully easier hand at next week's FOMC. December-hike odds have fallen from 36% post-NFP to 16% this morning. The market is now pricing roughly 50 basis points of 2026 cuts (one cut at September, one at December) — a complete reversal from where it sat a week ago. The dot-plot reveal Wednesday afternoon is the moment of truth: does the median Committee participant validate the dovish market pivot, or lean against it?
4. MACRO & FED WATCH
The macro setup has improved meaningfully in 48 hours. Soft CPI Wednesday, an Iran-peace catalyst Thursday, oil at $84, the 10-year at 4.36% and the 30-year below 4.90% — this is an environment in which the Fed can credibly hold without leaning hawkish in the dot plot, and could plausibly signal a path to one-or-two cuts in 2026. The PPI hot print is easily reframed as a backward-looking energy-driven outlier; the forward indicators are now all pointing the other direction.
The risk to this dovish setup is not the data; it is the durability of the Iran peace signal. If oil sustains sub-$85 for two more weeks, the disinflation glide path is real and the Fed has room to ease. If the peace deal collapses — as has happened repeatedly this year — Brent re-tests $100, and the macro environment looks materially harder again by July. We assign roughly 60% probability that the current peace track holds long enough to be confirmed in subsequent data, 40% that it does not. That is a meaningfully better distribution than 48 hours ago, but it is not a high-conviction call.
5. ECONOMIC CALENDAR — TODAY & WEEK AHEAD
Day
Time (ET)
Release
Consensus / Actual
Wed 6/10
8:30 AM
CPI (May) — released
Core +0.2% ✓ SOFT (vs +0.3%)
Thu 6/11
8:30 AM
PPI (May) — released
+1.1% m/m HOT (vs +0.7%)
Thu 6/11
After close
Adobe (ADBE) — Firefly miss
Stock -7% premarket
Thu 6/11
Late PM
SpaceX (SPCX) IPO priced
$135 / $1.77T (4x oversub)
Fri 6/12
Open
SpaceX (SPCX) begins trading
Nasdaq + Nasdaq Texas
Fri 6/12
10:00 AM
UMich Sentiment (Jun prelim)
52
Mon 6/15
8:30 AM
Empire State Mfg (Jun)
-2.0
Tue 6/16
8:30 AM
Retail Sales (May)
+0.3% m/m
Tue 6/16
9:15 AM
Industrial Production (May)
+0.2% m/m
Wed 6/17
8:30 AM
Housing Starts / Permits (May)
1.35M / 1.40M
Wed 6/17
2:00 PM
FOMC Decision + Dot Plot — KEY
Hold; Warsh's first
Wed 6/17
2:30 PM
Warsh Press Conference
—
6. EARNINGS WATCH
Adobe's −7% pre-market is today's micro story. EPS beat ($5.12 vs $5.07), revenue beat ($5.85B vs $5.83B), the $25 billion buyback authorization is real share-price support — but the Firefly run-rate at ~$285M annualized fell short of the $300M consensus and well short of the $400M+ bull case. More importantly, management's qualitative commentary on AI-revenue unit economics was characterized as evasive. The lesson: in this earnings environment, an in-line print plus a buyback no longer wins. The market wants disclosed AI-revenue acceleration and clear path-to-margin expansion. Adobe delivered neither.
Beyond Adobe, the next two weeks are quiet on earnings into next week's FOMC. Smucker, Kroger, Restoration Hardware, and Lululemon's investor day round out the next ten days. Q2 reporting begins July 14 with the big banks. The intervening four-week window is essentially pure macro — FOMC next Wednesday, then early-July labor data, then bank earnings.
7. SECTOR SPOTLIGHT: THE IRAN PEACE DIVIDEND — CHEAP OIL, LOWER REAL RATES, HIGHER MULTIPLES
Yesterday's Iran-strike call-off and the resulting overnight oil collapse — Brent down more than $10 in 48 hours, from $97 to $87 — provides the cleanest real-time demonstration of mechanics we have been tracking for two weeks. The same framework that explained Friday's NFP-driven selloff (real rates jumped, long-duration multiples compressed) explains this morning's bond rally and equity bid in reverse. Let's walk through it.
When Brent rises from $80 to $97 in six weeks — as it did from April through Tuesday — the bond market translates that into higher inflation expectations. Headline CPI gets hot, PPI gets hotter, and the Fed's path to cuts looks farther away. Nominal yields rise. But critically, both the nominal yield and inflation expectations rise — so the real rate (nominal minus inflation expectations) stays roughly stable. What changes is the equity discount rate via two channels: (1) the headline 'higher for longer' narrative reduces investor appetite for long-duration cash flows, and (2) the implied uncertainty around inflation lifts the equity risk premium.
THE MECHANICS: OIL → INFLATION EXPECTATIONS → REAL RATES → MULTIPLES
Oil is roughly 7% of the headline CPI basket directly, but its indirect role in producer input costs is meaningfully larger — energy is in everything that gets shipped, manufactured, or refrigerated. When Brent moves from $80 to $97, the breakeven inflation rate (the implied inflation in the spread between nominal and inflation-protected Treasuries) typically rises 15-25 basis points. Nominal yields tend to rise more than that in tandem, which means real rates also creep up. When oil reverses — as it has overnight with the Iran peace signal — the reverse happens, and faster. Today's 9 bp drop in the 10-year nominal yield combined with the 8 bp drop in the 10-year TIPS yield captures it: both nominal rates and real rates are falling, but breakevens are easing more than the nominal move because the energy-driven inflation premium is rapidly deflating.
What this means for equity multiples is straightforward but powerful. The S&P 500 sits at roughly 21x forward earnings. Of that 21x, perhaps 14-15x is justified by current long-run earnings expectations; the remaining 6-7x is, in plain terms, the discount-rate math. A 20 basis point drop in real rates on stable inflation expectations alone supports roughly 1.5x of multiple expansion, all else equal. A 50 basis point drop — which is what the market has been pricing for 2026 over the past 48 hours — supports roughly 3-4x of multiple expansion. That is several percentage points of S&P upside available just from the discount-rate mechanics, before you consider what cheaper energy does for corporate operating margins.
The investable implication. If the Iran peace track holds for the next two to three weeks and oil stays sub-$85, the long-duration growth complex (the AI-software names that absorbed the worst of Friday's NFP selloff) catches the cleanest bid. Constellation, Vistra, and the AI-power complex continue to benefit from contracted cash flows but lose the relative-attractiveness edge they had during the rate scare. The physical-AI picks-and-shovels we walked through earlier this week (Harmonic Drive, Cognex, Teradyne) benefit broadly. And — counterintuitively — the names that hurt are the integrated oil majors (XOM, CVX), which were the cleanest macro hedge during the Iran spike but become the cleanest macro tax during the peace. We are reducing energy-major exposure on rallies; we are adding selectively to the AI-software complex on weakness; we remain core to the AI-power and physical-AI picks.
8. ANALYST CALLS DRIVING ACTION
Notable upgrades / target hikes: Citi raised Microsoft (MSFT) PT to $580 on the oil-driven AI-multiple-expansion math. JPMorgan raised airlines (DAL, UAL, LUV) PTs across the board on the jet-fuel windfall from cheaper crude. Bank of America raised Constellation Energy (CEG) PT to $440. Morgan Stanley raised Tesla (TSLA) PT to $510 ahead of SPCX trading comp.
Notable downgrades / target cuts: A flood of Adobe (ADBE) PT cuts overnight — Wells Fargo to $440 from $500, JPMorgan to $470, Citi to $460. Bernstein cut energy majors (XOM, CVX) on the peace dividend. Wedbush trimmed Snowflake (SNOW) further. Defense primes (LMT, RTX, NOC) saw modest target reductions.
9. STOCKS TO WATCH
SpaceX (SPCX) — Begins trading this morning. First trade likely 11 a.m.–1 p.m. ET. Prediction-market open range: $150–$200. The biggest single-name event of the year.
Adobe (ADBE) — Down 7% pre-market on the Firefly miss. Watch the $440 level as the technical pivot.
Oracle (ORCL) — Continued capex-shock pressure; watch whether it can stabilize after Thursday's −9% extension.
Tesla (TSLA) — Bid on Morgan Stanley's $510 PT raise; SPCX trading creates new Musk-empire valuation comparable.
Microsoft (MSFT) / Alphabet (GOOGL) — Cleaner AI capex-to-revenue conversion; Citi MSFT to $580.
Symbotic (SYM) / Cognex (CGNX) / Teradyne (TER) — Physical-AI picks-and-shovels — benefit broadly from the lower-real-rate environment.
Constellation Energy (CEG) / Vistra (VST) / Talen Energy (TLN) — Still solid; relative-attractiveness reduced as the rate environment improves.
Airlines (DAL, UAL, LUV) — Bid on cheaper jet fuel; the cleanest near-term Iran-peace beneficiary.
Energy majors (XOM, CVX) — Under pressure on the peace dividend. The reverse of the past month's hedge.
10. GLOBAL MACRO SNAPSHOT
Europe: A strong open with Stoxx 600 up 0.78% as the Iran peace signal lifted both industrials and the AI-supply complex. European energy underperformed for the obvious reason. The ECB's hold yesterday at 2.5% with Lagarde's measured tone provided cover for the broader rally.
Asia: A strong session — Nikkei +1.47%, Hang Seng +1.20%, ASX +1.35% — as the U.S. Thursday rally and the Iran peace signal lifted global risk appetite. Japan's yen firmed to 155.90 as the dollar softened. The Nikkei reclaimed 39,000.
Emerging markets: A textbook risk-on day. Lower oil + lower U.S. yields + softer dollar is the EM trifecta. India's rupee firmer, Indonesia and Korea bid. Brazil and Mexico modestly weaker on the commodity-export side of the oil math, but the equity complex is broadly higher.
11. WEEK AHEAD PREVIEW
Two themes carry into next week.
(1) SPCX's first five trading sessions. The price discovery process today sets the tone; the next five sessions tell us whether $1.77T was the right mark, too low (Aschenbrenner vindicated), or too high (Damodaran's discipline confirmed).
(2) Wednesday June 17 — FOMC + dot plot. Warsh's first as Chair. After this week's CPI/PPI/oil moves, the macro setup has shifted meaningfully more dovish. A median dot consistent with one or two 2026 cuts is now plausible; the question is whether Warsh leans against it.
Beyond next week, the Iran-peace track's durability is the dominant question into Q2 earnings.
12. THE CLOSING THOUGHT
Two stories collide today: the largest IPO in history begins trading, and the most consequential macro de-escalation of the year is rippling through every asset price. The structural AI thesis just got a stamp of institutional approval at $1.77 trillion — and the macro environment underwriting that thesis just got materially easier. Real rates are down, breakevens are down, energy is down, equities are up, the Fed has cover. If the Iran peace holds for three weeks, this could mark the start of the most constructive tape since April. If it does not, the rally fades and we are back to the late-spring stagflation conversation. We do not know which path plays out. But we know that today's SPCX open and next Wednesday's FOMC are the two cleanest data points the market will produce on the question. Trade it carefully — and have a good weekend.
THE BROOKSIDE BRIEF · COMPILED 9:30 AM ET · SOURCES: WSJ, CNBC, BLOOMBERG, REUTERS, BLS, BEA, ECB, ASWATH DAMODARAN SUBSTACK, CITRINI RESEARCH SUBSTACK, NEXT FINANCIAL SUBSTACK, U.S. TREASURY
Good morning. The bond market got it right. Tuesday's brief argued that yields were rising despite the Iran deal because the curve was pricing a hawkish Warsh dot plot. Yesterday delivered exactly that — and then some. The June Summary of Economic Projections showed 9 of 18 FOMC members expecting at least one rate HIKE before year-end, with 6 projecting two 25-basis-point hikes. The median 2026 funds-rate dot moved from 3.4% in March to 3.8% in June — a 40 basis point hawkish shift that fully prices in a quarter-point hike by year-end. The market reaction was violent: the Dow fell 507.12 points (-0.98%), the S&P 500 lost 1.21% to 7,420.10, the Nasdaq Composite shed 1.34% to 26,021.66. The 2-year Treasury yield jumped 16 basis points to 4.216% — its highest level in over a year. The dollar index rose roughly 1%, its best day in almost a year.
Reinforcing the hawkish setup, May retail sales beat hard yesterday morning: +0.9% month-over-month versus +0.5% consensus — nearly double expectations. Retail trade ex-autos/gas/building/food rose 0.7%. The U.S. consumer is, by any reasonable measure, resilient. Combined with PCE inflation now projected at 3.6% by year-end (up from 2.7% in March), the dual mandate is telling Warsh's Fed the same thing the bond market has been telling them: this is not a cutting cycle.
Today's brief expands the macro section to walk carefully through what Warsh did and said yesterday — not just the dot plot, but the press-conference rhetoric, the shorter statement, and the surprise announcement of five task forces. The Sector Spotlight this morning pivots to a question that Tuesday's brief teed up and yesterday's tape demands: is the AI investment cycle still defensible? We draw on Citrini Research's June 'State of the Themes' note (cited in our footer) and the framing from Burton Malkiel's *A Random Walk Down Wall Street* — when investment fundamentals are thrown in the bin because 'AI just works,' how far are we from a tulip-bulb moment? Three Citrini-style visuals walk the math.
Also today: the formal U.S.–Iran deal signing in Switzerland is tomorrow, June 19. The Iran-deal-is-bullish trade has now collided with the Fed-is-hawkish trade. The question is which dominates in this morning's tape. Futures are softer pre-open as yields hold near yesterday's highs.
2. MARKETS AT A GLANCE
U.S. EQUITY FUTURES (PRE-OPEN, POST-FOMC)
Asset
Last
Change
% Chg
S&P 500 (ES)
7,408
-12
-0.16%
Nasdaq 100 (NQ)
25,940
-50
-0.19%
Dow (YM)
51,440
-50
-0.10%
Russell 2000 (RTY)
2,325
-9
-0.39%
PRIOR CLOSE (WEDNESDAY, JUNE 17 — HAWKISH FOMC ROUT)
Asset
Last
Change
% Chg
S&P 500
7,420.10
-90.84
-1.21%
Nasdaq Composite
26,021.66
-353.74
-1.34%
Dow Jones Industrial Avg.
51,492.55
-507.12
-0.98%
Russell 2000
2,334.40
-22.50
-0.96%
VIX
18.40
+2.20
+13.6%
RATES & FX — 2Y +16BPS TO HIGHEST SINCE 2025, DOLLAR +1%
Asset
Last
Change
% Chg
UST 2-Year
4.216%
+16 bps
—
UST 10-Year
4.51%
+8 bps
—
UST 30-Year
4.95%
+5 bps
—
10-Yr TIPS (real)
2.21%
+7 bps
—
DXY (Dollar Index)
100.55
+0.98
+0.98%
EUR/USD
1.0635
-0.0100
-0.93%
USD/JPY
157.85
+1.65
+1.06%
COMMODITIES & CRYPTO
Asset
Last
Change
% Chg
WTI Crude (Jul)
$76.42
-$0.89
-1.15%
Brent Crude (Aug)
$78.95
-$0.90
-1.13%
Gold (spot)
$1,742
-$36
-2.02%
Silver (spot)
$20.50
-$0.45
-2.15%
Bitcoin
$83,800
-$2,600
-3.01%
ASIA & EUROPE (INTRADAY)
Asset
Last
Change
% Chg
Nikkei 225
39,210
-560
-1.41%
Hang Seng
21,720
-230
-1.05%
Australia ASX 200
8,420
-58
-0.68%
Stoxx Europe 600
566.40
-5.00
-0.88%
FTSE 100
8,805
-65
-0.73%
DAX
20,355
-155
-0.76%
3. TOP STORIES
FOMC Hold + Hawkish Dot Plot — 9 of 18 Project Hike, 6 Project Two
The June Summary of Economic Projections was the cleanest hawkish surprise of the year. The median 2026 funds-rate dot moved 40 basis points higher to 3.8% — implying one full 25 basis point HIKE before year-end versus the March projection's implied one cut. Nine of 18 voting members project at least one hike; six project two 25 basis-point hikes. Median 2026 PCE inflation jumped from 2.7% (March) to 3.6% (June). Median 2026 unemployment was nudged from 4.4% down to 4.3%. The 12-0 unanimous hold vote was Warsh's first as Chair.
Retail Sales +0.9% — Nearly Double Consensus
May retail sales printed +0.9% m/m versus +0.5% expected — the cleanest hot-data morning of the spring. Total spending hit $763.7 billion, +6.9% year-over-year. The control group (ex-autos/gas/building/food) rose 0.7%. Nonstore retailers (e-commerce) rose 12.2% y/y. The consumer is supporting the hawkish Fed pivot from the data side.
Warsh Announces Five Task Forces — Communications, Data, Productivity, Inflation
In a substantive break from the Powell-era communication style, Chair Warsh used yesterday's press conference to announce five FOMC task forces — covering monetary policy operations, communications, data sources, productivity and the labor market, and the causes of inflation. The forward-guidance language in the statement was explicitly dropped (per Warsh's confirmation hearings preview). The June statement was, by Warsh's own description, 'noticeably shorter' than recent vintages, with 'outdated language removed.' This is the Warsh-Fed taking shape in public.
Markets Reprice Sharply — 2Y +16 bps, Dollar +1%
The bond market's reaction was the cleanest signal: the 2-year yield jumped 16 basis points to 4.216% — its highest level in over a year. The 10-year added 8 bps to 4.51%. The 30-year rose 5 bps to 4.95%. The 10-year TIPS real yield rose 7 bps to 2.21%. The dollar index gained nearly 1% for its best session in almost a year. The yen weakened past 157.50, and the euro fell below 1.07. Gold lost 2.0% on the higher real yields. Bitcoin sold off 3% in sympathy with the broader liquidity tightening.
Iran Deal Signing Tomorrow in Switzerland
The formal U.S.–Iran agreement signing ceremony takes place tomorrow, Friday June 19, in Switzerland. The Strait of Hormuz reopens to commercial tanker traffic within thirty days. Oil continued its drift lower yesterday and overnight — WTI now at $76.42, Brent at $78.95. The Iran-peace dividend remains in the price; what shifted yesterday was the policy-rate environment underwriting it.
4. MACRO & FED WATCH — WARSH'S FIRST PRESS CONFERENCE, IN DETAIL
Chair Warsh's first FOMC press conference was, in our view, the most substantive change in Fed communication since Powell's debut in 2018. Five elements deserve careful attention.
First, the statement itself. The June statement was visibly shorter than recent vintages. Forward-guidance language — the explicit phrases about 'when we have gained greater confidence' in the inflation glide path — was removed entirely. Warsh characterized the change in his press conference: 'We removed outdated language and dispensed with forward guidance, focusing on data and the committee's goals.' This is not a small change. It is a deliberate move away from the Powell-era practice of telegraphing policy intent through the statement, toward what Warsh has previously called a 'meeting-by-meeting' framework. The bond market's reaction reflected the loss of optionality the change implies — without forward guidance, every macro print becomes a live policy moment.
Second, the dot plot. The median 2026 funds-rate dot moved from 3.4% in March to 3.8% in June — a 40-basis-point hawkish shift. Six members project two 25 bp hikes by year-end; three project one; six see hold; three see a single cut. The 2027 median moved from 3.1% to 3.4%; the 2028 median stayed at 3.1%; the long-run median held at 2.9%. PCE inflation was pulled up sharply — 2026 median moved from 2.7% to 3.6%, with core PCE 2026 at 3.4%. Unemployment 2026 was nudged DOWN from 4.4% to 4.3% — a remarkable acknowledgment that the labor market has been resilient through the energy-driven inflation shock.
Fig. 1 — FOMC dot plot March 2026 → June 2026. The 2026 median moved 40 bps hawkish on a hot PPI and resilient labor data.
Third, Warsh did NOT submit his own dot. This was widely expected by Wall Street going in (Goldman's Mericle and BofA's Bhave both flagged it) but is still a meaningful choice. Warsh's pre-Fed published commentary was consistently critical of forward guidance and of the dot plot itself. By withholding his own dot, he signals two things: (1) he wants to preserve maximum optionality for himself given how brief his tenure has been (sworn-in May 22), and (2) he is sending a quiet signal that the dot plot framework itself is under review by the five task forces he announced.
Fourth, the rhetorical posture. Warsh's most quoted line: 'The commitment to deliver is strong, unanimous, and unambiguous, and that's I think an important message we've missed for five years, and we're going to fix that.' This is not Powell-style careful balance. It is a direct claim that the Fed will return to 2% inflation — full stop. When asked about the path of rates, Warsh repeatedly deflected to 'the data will tell us,' refusing to either confirm or contradict the hike implied by the dot plot. The asymmetry of the language matters: he was willing to commit unambiguously on the inflation target, but not on the rate path. That is hawkish.
Fifth, the five task forces. This was the surprise of the press conference. Warsh announced standing reviews of: (a) monetary policy operations, (b) communications (including the dot plot itself), (c) data sources, (d) productivity and the labor market, and (e) the causes of inflation. Each task force will be chaired by an FOMC voting member and will publish findings within 12 months. This is a significant institutional move — comparable in scope to the 2019 Powell strategy review that produced average-inflation targeting (AIT). The question Wall Street will spend the summer parsing is whether these task forces will produce a wholesale rewrite of the Fed's reaction function.
Our read of the policy setup post-meeting: the December hike is now ~70% probability per CME FedWatch (up from ~60% Tuesday); the September hike is ~25%. The bond market is priced for the dot-plot median. We expect the 10-year to trade in a 4.45-4.65% range through July labor data, with the 2-year vulnerable to further upside if June core CPI prints hot on July 11. The dollar's reaction is meaningful for cross-asset flows: a stronger dollar tightens financial conditions for emerging markets, compresses commodity prices, and pressures multinational earnings — all of which feed back into the equity risk premium.
WHY DROPPING FORWARD GUIDANCE MATTERS
Forward guidance was the Fed's primary communication tool after the 2008 financial crisis. Phrases like 'rates will remain low for an extended period' or 'we have gained greater confidence' acted as a free, leverage-free policy easing — they pulled long-term yields lower without requiring an actual rate cut. Dropping that language does the reverse. It withdraws a piece of monetary accommodation that was, in effect, always 'on.' Without the language, markets must re-price the policy path based on data alone, which structurally raises the term premium embedded in long yields — i.e., the extra compensation investors demand for holding duration through uncertainty. That term-premium effect alone explains roughly half of yesterday's 10-year and 30-year selloff.
5. ECONOMIC CALENDAR — THIS WEEK
Day
Time (ET)
Release
Consensus / Actual
Mon 6/15
Close
S&P +1.49% (Iran-deal rally)
SPCX $177.99
Wed 6/17
8:30 AM
Retail Sales (May) — released
+0.9% ✓ HOT (vs +0.5%)
Wed 6/17
2:00 PM
FOMC + Dot Plot — released
Hold; 2026 dot 3.8%
Wed 6/17
2:30 PM
Warsh Press Conference — released
5 task forces, no own dot
Thu 6/18
8:30 AM
Initial Jobless Claims
225K
Thu 6/18
8:30 AM
Philly Fed Mfg Index
-1.0
Thu 6/18
10:00 AM
Leading Economic Indicators
-0.1%
Fri 6/19
Open
Iran deal signing — Switzerland
—
Fri 6/19
9:45 AM
S&P Global Flash PMIs (Jun)
Mfg 50.5 / Svcs 53.0
6. EARNINGS WATCH
Today: Kroger (KR) before-open is the headline print — consensus EPS $1.18 on $46.5B revenue. Watch the commentary on consumer-spending durability into Q3. Smucker (SJM), Darden Restaurants (DRI), and FedEx (FDX) all report this week. Restoration Hardware (RH) reports after the close — the read-through to high-end housing demand matters given the rate move. Q2 reporting season formally begins July 14 with the big banks.
7. SECTOR SPOTLIGHT: IS THE AI CAPEX CYCLE STILL DEFENSIBLE?
Yesterday's hawkish Fed creates the cleanest test of the AI investment thesis we have had all year. With 2-year yields jumping 16 basis points, the dollar gaining 1%, and the dot plot now pricing a 2026 hike, the discount-rate backdrop for long-duration growth has shifted decisively. Against that backdrop, we want to examine a question Citrini Research has been pressing in their recent 'State of the Themes' note (referenced in our footer): is the AI capex cycle still defensible on the fundamentals, or are we approaching the tulip-bulb moment Burton Malkiel warned about in *A Random Walk Down Wall Street*?
Citrini's framing of buy-side AI psychology is sharp. The author paraphrases the trade this way: 'Well the economy is doing well, so I'll invest in AI. Well the Strait of Hormuz might be hurting the economy, but AI is immune, so I'll invest in AI which is something that has worked.' The thesis works until it doesn't. Investment fundamentals get thrown in the bin precisely when a trade has been working for long enough that process discipline becomes 'old-fashioned.' That is the textbook setup for a bubble ending — and the discipline question is the right one to ask right now.
Start with the capex tape. The Big Four hyperscalers (Microsoft, Alphabet, Meta, Amazon) guided to roughly $390 billion of capex for 2026 alone — up from $157 billion in 2023, a 2.5x ramp in three years. Add Oracle (~$50B), Tesla AI (~$15B), CoreWeave (~$30B), and the long tail (xAI, Stargate, neoclouds), and 2026 alone clears $500 billion. Cumulative 2024-2026 hyperscaler capex now exceeds $1 trillion. That is the 'trillion' side of Citrini's 'spending a trillion to make trillions' framing.
Fig. 2 — Big-Four hyperscaler capex 2023-2026E. The annual run-rate has 2.5x'd in three years; cumulative now exceeds $1T.
Now the revenue side. Disclosed AI-related run-rate revenue is harder to pin down because most hyperscaler reporting buries it in Cloud or Other Bets segments. Reasonable triangulation from disclosed numbers and analyst work: OpenAI ~$15B run rate (per recent reporting), Anthropic ~$8B, Azure AI revenue ~$20B run rate, Google Cloud AI ~$10B, Meta AI infrastructure-monetization ~$5B, AWS AI ~$15B. Sum: roughly $70-90 billion of disclosed AI run-rate revenue in mid-2026. Against $500B of annual capex spending, that is a ratio of roughly 6x — capex outpacing realized revenue by 6-to-1.
Fig. 3 — The trillion-to-trillions gap. 2026E annual capex ($500B) outpaces disclosed AI run-rate revenue (~$80B) by ~6x.
TULIP BULBS, RAILWAYS, AND DOTCOMS — WHAT BUBBLES HAVE IN COMMON
Burton Malkiel's *A Random Walk Down Wall Street* devotes a full chapter to historical bubbles for a reason. The 1630s Dutch tulip mania, the 1840s British railway mania, the 1920s Florida land boom, and the 1999-2000 dotcom bubble all share three features: (1) a genuine technological or economic innovation underlies the enthusiasm — tulips really were beautiful; railways really did transform commerce; the internet really did change everything; (2) capital allocation outruns the realized cash flows by a wide margin, often a multiple of 5x or more for sustained periods; (3) the bubble ends not when the innovation is invalidated, but when the marginal investor refuses to fund another round of capex on the basis that 'the cash flows will come.' The AI capex cycle has features (1) and (2) clearly. Whether and when feature (3) arrives is the open question.
What does Citrini's June note actually argue? The core thesis: companies are spending a trillion in capex to make trillions in revenue, and after the initial monetization phase, customers will have to start picking up the tab as 'free AI' ends. The implicit bet is that revenue scales fast enough — through enterprise subscriptions, consumer premium tiers, advertising augmentation, and API consumption — to validate the capex on a 3-5 year horizon. That is a defensible bet if you believe in the productivity story Aschenbrenner walked through in *Situational Awareness*. It is a tulip-bulb moment if AI revenue conversion stalls below the trajectory required to amortize the fixed cost.
Citrini's own positioning is instructive. The June 'State of the Themes' note (updated weekly via paid Substack) maintains long exposure to the AI-power complex (electrification picks-and-shovels), physical-AI specialty suppliers, and selective exposure to hyperscalers with the cleanest capex-to-revenue conversion (their preferences: Microsoft and Alphabet over Oracle and Meta). They are noticeably skeptical of the orbital-AI complex (which validates our SPCX Section 7 piece from Tuesday) and of the second-derivative semiconductor names whose multiples now embed AI optionality without the cash-flow visibility of the leaders.
OUR VARIANT PERCEPTION
We do not believe the AI capex cycle is over. The productivity case Aschenbrenner makes — that trillion-dollar compute clusters drive a step-change in AI capability that justifies the spend — remains intact and is supported by the model-quality progression of the last 18 months. But we agree with Citrini that the discipline of the marginal capex dollar matters more in 2026 than it did in 2024. The risk asymmetry has shifted. The Iran deal removed a tail; the hawkish Fed introduced another. Our positioning tilt: maintain core exposure to AI-power (CEG, VST, TLN, GEV, ETN) and physical-AI picks-and-shovels (SYM, CGNX, TER); favor MSFT/GOOGL over ORCL/META within the hyperscaler set; remain cautious on orbital-AI optionality embedded in SPCX and Tesla multiples. Trade carefully through the dot-plot reset.
8. ANALYST CALLS DRIVING ACTION
Upgrades / target hikes: Goldman raised JPMorgan (JPM) PT to $310 on the steeper yield curve. Citi raised Berkshire (BRK.B) PT to $510 on the rising-rates beneficiary thesis. Morgan Stanley reiterated Microsoft (MSFT) at $580. JPMorgan raised regional banks (KRE) coverage on the curve steepening.
Downgrades / target cuts: Wedbush cut Tesla (TSLA) PT to $480 on the SPCX-comp compression. Bernstein cut emerging-markets equities exposure on the stronger dollar. BofA trimmed Oracle (ORCL) and Meta (META) PTs on the AI capex-to-revenue ratio concerns. Notably, SPCX coverage is still in the quiet period — first analyst initiations remain expected the week of July 7.
Kroger (KR) — Reports before open. Consumer durability read post +0.9% retail sales.
SPCX — Pre-market indications down on the broader risk-off. Watch the $170 level.
Oracle (ORCL) / Meta (META) — BofA PT cuts. Citrini-skeptic capex-to-revenue ratio concerns.
TLT — Still avoid duration. The post-FOMC reset may not be done; June core CPI on July 11 is the next risk.
10. GLOBAL MACRO SNAPSHOT
Europe: Stoxx 600 down 0.88% in early trade as the dollar surge and U.S. yield jump weighed broadly. FTSE -0.73%, DAX -0.76%. ECB's Lagarde speaks today at 9:30 a.m. ET; any pushback on the U.S.-led tightening signal would be a meaningful divergence story.
Asia: A rough overnight session. Nikkei -1.41% on the stronger dollar / weaker yen (USD/JPY 157.85). Hang Seng -1.05% as China property concerns compound with the broader EM-risk-off. ASX -0.68%. The cross-asset move highlights how concentrated the policy transmission is when the Fed shifts hawkish — Asian equity, Asian credit, EM FX, and the EM dollar bond complex all reprice in tandem.
Emerging markets: A textbook risk-off day. The MSCI EM ETF is indicated down 1.2% pre-open. India's rupee weakened past 84; Korean won and Indonesian rupiah both under pressure. The Brazilian real is testing 5.65 against the dollar. EM dollar bonds are wider 8-12 bps. The dollar-strength tax on EM is now the dominant macro story for the complex; the lower-oil tailwind is no longer sufficient compensation.
11. WEEK AHEAD PREVIEW
Today (Thu 6/18): Initial jobless claims + Philly Fed at 8:30, LEI at 10:00. Lagarde speaks 9:30. Kroger before open, RH after.
Friday 6/19: Iran deal signing ceremony in Switzerland. S&P Global flash June PMIs at 9:45 a.m. — the first real-time pulse of post-FOMC business sentiment.
Looking ahead: June FOMC minutes release July 9; June CPI July 15; Q2 earnings season kicks off July 14 with the big banks. Nvidia Q2 in early August is the next major AI-infrastructure print.
12. THE CLOSING THOUGHT
Yesterday's FOMC was the cleanest hawkish surprise of the year, and the bond market got it right ahead of time. We were right to flag the directional reversal Tuesday; the magnitude of the move was even bigger than we anticipated. The Warsh-Fed is a genuinely different institution from the Powell-Fed — shorter statements, no forward guidance, five task forces under way, the Chair declining his own dot, an unambiguous-commitment posture on 2% inflation. None of that is incremental. It is structural. And the cross-asset reaction — equity duration down, 2-year up 16 bps, dollar best day in nearly a year, dollar-tax compressing EM and commodities — is what happens when monetary regime change hits a market that was positioned for the prior regime. The Iran deal still signs tomorrow. The AI capex tape still runs at a trillion dollars. But neither of those bails out the duration trade. Section 7 today asks the harder question: when does the AI capex itself meet a discipline constraint? We are not at a tulip-bulb moment. We may be closer to one than the consensus believes. Trade carefully — and watch the flash PMIs tomorrow alongside the Iran signing.
THE BROOKSIDE BRIEF · COMPILED 9:30 AM ET · SOURCES: FEDERAL RESERVE SEP (JUNE 17), CME FEDWATCH, CNBC/NPR/CNN (FOMC RECAP), THESTREET (JUNE 17 CLOSE), U.S. CENSUS BUREAU (RETAIL SALES), CITRINI RESEARCH 'STATE OF THE THEMES JUNE 2026' (CITED P-202017923), MALKIEL 'A RANDOM WALK DOWN WALL STREET', ASCHENBRENNER 'SITUATIONAL AWARENESS', TREASURY H.15
MORNING EDITION · FRIDAY, JUNE 19, 2026 · IRAN DEAL SIGNS IN GENEVA TODAY · VIX 17.1
Daily Markets Briefing
The Brookside Brief
Markets · Macro · The Day Ahead
1. THE MORNING SETUP
Good morning. The hawkish-Fed selloff that looked decisive Wednesday was, for the most part, undone in a single session. The Nasdaq Composite rallied 1.91% Thursday to 26,517.93 — recovering the full 1.34% it lost the day prior and adding a bit more. The S&P 500 added 1.08% to 7,500.58. The Russell 2000 led at +2.12%, with small-cap rate-sensitivity flipping from headwind to tailwind as the 2-year yield reversed modestly from its 4.22% Wednesday peak. The Dow lagged at +0.14%, reflecting the rotation back into growth and tech and out of the cyclical names that led Monday's Iran-deal rally.
The market's read of the post-FOMC tape is therefore more nuanced than the bond market reaction alone suggested Wednesday. The hike is in the price; the growth multiples stayed in the price. The two facts can coexist because the AI-capex revenue thesis is, for now, what is anchoring multiples — not the discount rate alone. That is the framework Citrini Research has been pressing in their June note (the centerpiece of yesterday's brief), and it is the framework that determines whether Thursday's rebound extends or fails.
Today's tape has two main drivers. First, the formal U.S.–Iran agreement signing in Geneva — Pakistan's Prime Minister has confirmed the ceremony, and the 14-point memorandum of understanding reopens the Strait of Hormuz without tolls, lifts the U.S. naval blockade, and opens a 60-day negotiation window on Iran's nuclear program and sanctions relief. Second, the S&P Global flash June PMIs at 9:45 a.m. ET — the first real-time pulse of business sentiment since the FOMC and the first read on whether the broader economy is digesting the dot-plot reset cleanly. Consensus is manufacturing at 50.5 (just above contraction) and services at 53.0 (still expansionary).
Layered underneath: Kroger reported Q1 yesterday and the stock cratered 8.43% to a 52-week low at $56.61, despite a revenue beat. The FIFO gross margin compressed 9 bps year-over-year as the company cut prices to win share back from Walmart and Costco. The message from the consumer staples shelf is important — the +0.9% retail sales beat Wednesday tells you the consumer is spending; the Kroger tape tells you they are spending discriminatingly. Section 7 unpacks what the divergence means.
2. MARKETS AT A GLANCE
U.S. EQUITY FUTURES (PRE-OPEN, IRAN-SIGNING-DAY)
Asset
Last
Change
% Chg
S&P 500 (ES)
7,495
-6
-0.08%
Nasdaq 100 (NQ)
26,440
-20
-0.08%
Dow (YM)
51,520
-45
-0.09%
Russell 2000 (RTY)
2,378
-6
-0.25%
PRIOR CLOSE (THURSDAY, JUNE 18 — POST-FOMC REBOUND)
Asset
Last
Change
% Chg
S&P 500
7,500.58
+80.48
+1.08%
Nasdaq Composite
26,517.93
+496.27
+1.91%
Dow Jones Industrial Avg.
51,564.70
+72.15
+0.14%
Russell 2000
2,383.90
+49.50
+2.12%
VIX
17.10
-1.30
-7.07%
RATES & FX — YIELDS STABILIZE AS 2Y GIVES BACK SOME OF WED JUMP
The formal U.S.–Iran agreement signing takes place this morning in Geneva, Switzerland. Pakistani Prime Minister Shehbaz Sharif confirmed the ceremony will go ahead as scheduled. The 14-point memorandum of understanding reportedly: (1) ends over 100 days of conflict, (2) reopens the Strait of Hormuz to commercial tanker traffic without tolls, (3) lifts the U.S. naval blockade in the Persian Gulf, and (4) opens a 60-day negotiation window on Iran's nuclear program and sanctions relief. The Strait reopening is the operationally important piece for energy markets — roughly 20% of global oil flows transit it, and the closure premium that built into Brent in early May has now fully unwound. WTI sits at $76.10 this morning; Brent at $78.55. The market read of the signing is straightforward: positive but largely priced; oil should be capped near the mid-$80s through the 60-day nuclear window.
Thursday Rebound — Chips Lead, Nasdaq Recovers Full FOMC Selloff
Thursday's tape was the cleanest reversal we have seen all spring. The Nasdaq's 1.91% gain more than recovered Wednesday's 1.34% loss. Semis led — the SOX added 3.2%. Nvidia rallied 2.8%, AMD 4.1%, Marvell 5.6%, Broadcom 2.9%. The Russell 2000 added 2.12% as the 2-year yield reversed modestly. Underlying the bounce: the bond market treated the FOMC as fully repriced. The 10-year ticked back from 4.51% to 4.497%, and the 2-year gave back 4 bps from its 4.22% Wednesday high. Without further hawkish data, the curve has done its work, and equity duration is back in play.
Kroger −8.43% to 52-Week Low — Margin Compression Tells the Pricing-War Story
Kroger reported Q1 FY26 yesterday before the open. The top line beat — revenue of $46.1 billion versus consensus $45.7B, +2.2% year-over-year, with eCommerce up 19% and achieving profitability for the first time including media. Adjusted EPS came in around $1.46, light of the $1.59 consensus. The stock fell 8.43% to a fresh 52-week low at $56.61. The real story was the margin commentary: FIFO gross margin (ex-fuel, ex-adjustments) fell 9 basis points year-over-year as Kroger 'invested in pricing' — meaning, cut prices — to win share back from Walmart and Costco. Cost savings ran 30% ahead of plan in the quarter, partially offsetting. The read-across to consumer-staples and the broader retail margin picture is meaningful: the strong +0.9% May retail sales tells you the consumer is showing up; Kroger tells you the shelf is winning that consumer by cutting price, which compresses margins across the channel.
Flash PMIs at 9:45 a.m. — First Post-FOMC Real-Time Read
S&P Global's flash June composite, manufacturing, and services PMIs land at 9:45 a.m. ET. Consensus: manufacturing 50.5 (just above contraction), services 53.0 (still expansionary). These are the first soft-survey indicators since the FOMC decision; they offer the cleanest near-term read on whether business sentiment is being affected by the dot-plot reset. A hot services print could push the 10-year back toward 4.55%; a soft print could extend Thursday's risk-on tone into the weekend. Either way, the trade is binary — a meaningful upside or downside surprise dominates next week's positioning into the bank-earnings open July 14.
Yesterday's Other Data: Jobless Claims 226K, Philly Fed Strong, LEI In Line
Initial jobless claims fell 4,000 to 226,000 for the week ending June 13 — close to the 225K consensus and consistent with a labor market that is, by the Fed's own updated SEP, expected to land at 4.3% unemployment by year-end. The Philadelphia Fed manufacturing index rose meaningfully into positive territory — well above the 11.4 consensus from the prior month's -0.4 reading. The Conference Board's Leading Economic Index came in at +0.1%, in line with consensus and matching the prior print. Cumulatively: the data supports the soft-landing case AND validates the Fed's decision to hold (and signal a hike) rather than cut.
4. MACRO & FED WATCH — POST-REPRICING EQUILIBRIUM
Two days post-FOMC, the term structure has settled into a new equilibrium that we think is the right base case to carry into next week. The 2-year is around 4.18% (down 4 bps from Wednesday's peak), the 10-year is at 4.497% (basically unchanged), the 30-year at 4.93%. CME FedWatch shows December-hike odds at ~70% (vs ~60% pre-FOMC); September-hike odds at ~25%. The dot-plot median is essentially priced.
Two things to watch into the weekend and next week. First, the durability of the Iran-deal energy disinflation. Oil sub-$80 sustained for two more weeks pulls the headline PCE print materially lower and softens the inflation argument the Fed leaned on yesterday. If Brent drifts back toward $75 — plausible given the Strait reopening and the 60-day nuclear-talks window — the 10-year could test back toward 4.40%. Second, the June CPI release on July 15. Core CPI consensus is +0.27% m/m. A miss to the upside (above +0.32%) pushes the December hike toward fully priced; a miss to the downside (below +0.20%) unwinds half of yesterday's bond move.
Fig. 1 — Two-day round trip across major indices. Nasdaq fully recovered the FOMC selloff; Dow flat-lined on the bounce.
The cross-asset signal from Thursday's tape worth flagging: the dollar held most of its post-FOMC gains (DXY at 100.25 today vs 100.55 yesterday) even as risk assets rallied. That tells you the policy-divergence trade — Fed hawkish, ECB on hold, BoJ constrained — is the dominant macro flow now, not the rates trade itself. EM currencies stayed soft (real, rupee, won, rupiah all near the lows of the week). Until the dollar reverses, the EM-equity overhang persists.
5. ECONOMIC CALENDAR — TODAY AND WEEK AHEAD
Day
Time (ET)
Release
Consensus / Actual
Wed 6/17
2:00 PM
FOMC + Dot Plot
Hold; 2026 dot 3.8%
Thu 6/18
8:30 AM
Initial Claims (released)
226K ✓ in line
Thu 6/18
8:30 AM
Philly Fed (released)
Strong, well above 11.4 est
Thu 6/18
10:00 AM
LEI (released)
+0.1% ✓ in line
Thu 6/18
Pre-open
Kroger Q1 (released)
Stock −8.43%
Fri 6/19
All day
Iran deal signing — Geneva
Formal MOU
Fri 6/19
9:45 AM
S&P Global Flash PMIs (Jun)
Mfg 50.5 / Svcs 53.0
Mon 6/22
8:30 AM
Chicago Fed Nat Activity
-0.10
Tue 6/23
10:00 AM
Existing Home Sales (May)
4.10M
Wed 6/24
10:00 AM
New Home Sales (May)
720K
Thu 6/25
8:30 AM
Q1 GDP (final)
+2.3%
Fri 6/26
8:30 AM
Core PCE (May) — KEY
+0.27% m/m / +2.9% y/y
6. EARNINGS WATCH
Today: nothing material. Smucker (SJM) reported Wednesday — in-line; Darden (DRI) Thursday morning — modest beat with cautious consumer commentary; Restoration Hardware (RH) Thursday after-close — disappointed on the housing read-through and traded down in extended hours. Kroger remains the standout — the −8.43% move and 52-week low warrants attention from anyone with consumer-staples exposure.
Next week: nothing major. Carnival (CCL) Tuesday, FedEx (FDX) Wednesday, Nike (NKE) Thursday — the latter two are the meaningful prints for read-across into Q2 broadly. Q2 earnings season formally opens July 14 with JPMorgan, Wells Fargo, and Citi. Nvidia's Q2 in early August remains the next major AI-infrastructure print.
7. SECTOR SPOTLIGHT: THE CONSUMER-STAPLES MARGIN TEST
Kroger's 8.43% selloff to a 52-week low yesterday was the most important single-stock news of the week — more important than the FOMC for what it tells us about the consumer microstructure. The headline numbers were not the issue: revenue beat at $46.1B (+2.2% y/y), eCommerce grew 19% and reached profitability for the first time, cost savings ran 30% ahead of plan. The market punished the stock on one number: the 9 basis point year-over-year compression in FIFO gross margin. That tells you Kroger is winning share by cutting price, and the marginal dollar of consumer-staples revenue is now coming at a structurally lower margin than it did a year ago.
Fig. 2 — Kroger Q1 2026 scorecard. Top line beat, margin compressed 9 bps, stock punished 8.43%.
Why does this matter beyond Kroger? Three reasons. First, the read-across to Walmart and Costco is significant. Kroger is cutting price to defend share, which means WMT and COST are doing the same on their end or holding it. The supermarket-channel margin curve is compressing. WMT trades at 35x forward earnings — a multiple that embeds expectations of continued margin expansion. If the next two quarters confirm that the consumer-staples shelf is a pricing-war zone rather than a margin-expanding business, WMT and COST become vulnerable.
Second, the read-across to the broader consumer is the central macro question. The May retail sales beat (+0.9% vs +0.5% consensus, released Wednesday) tells you headline consumer spending is robust. The Kroger margin tape tells you the spending is happening, but consumers are sufficiently price-sensitive that the retailers must compete on pricing — which is, definitionally, a deflationary signal at the channel level even when the unit volumes are good. That is a textbook 'good news / bad news' data combination: macro-bullish (consumer spending strong) but micro-cautious (retailer pricing power compressed). The bond market, in our read, is already pricing the macro side; the equity market has not yet priced the micro side.
Third, the read-across to consumer-discretionary tells the deeper story. Darden Restaurants reported Thursday morning with a modest beat but cautious commentary on ticket trends — same dynamic: traffic is fine, ticket is under pressure. Restoration Hardware's after-close print on Thursday was the inverse — high-end demand softening as the rates move bites. The bifurcation is real: the upper-middle and high-end consumer is starting to defer purchases on rates; the mass-market consumer is showing up but trading down. That is the cleanest signal of a late-cycle consumer we have had all year.
WHY MARGINS MATTER MORE THAN REVENUE AT THIS POINT IN THE CYCLE
In an early-cycle environment, revenue growth is the dominant driver of equity returns because the operating leverage is positive — a 5% revenue gain at a fixed-cost-heavy company drops disproportionately to the bottom line. In a late-cycle environment, the calculus inverts. Revenue growth stays positive (because the consumer is still spending), but the cost of acquiring that revenue rises — through promotional pricing, competitive ad spend, labor wage pressure, and input cost stickiness. Earnings then grow slower than revenue, and equity multiples — which capitalize forward earnings, not revenue — start to compress even when the top line is fine. The Kroger tape is a textbook example. Revenue beat, margin missed, multiple compressed, stock fell. The question for the next two quarters is whether the same playbook applies to WMT, COST, and the broader consumer-staples complex. We think the probability is meaningfully higher than the consensus believes.
Positioning implication. We are reducing exposure to the consumer-staples-with-stretched-multiples cohort (WMT, COST) and rotating toward the consumer names with demonstrated pricing power (Costco's membership-fee revenue is genuinely sticky; Walmart's logistics moat is genuinely durable — but the multiples are demanding). Within consumer-discretionary, we favor the names with input-cost leverage from the lower-oil tape (airlines DAL/UAL/LUV remain our preference) and the experience-economy names with pricing power (Marriott, Hilton). We continue to avoid the stretched-multiple housing names (DHI, LEN, KBH) into a sustained-higher-rates environment.
8. ANALYST CALLS DRIVING ACTION
Upgrades / target hikes: Goldman raised Nvidia (NVDA) PT to $185 ahead of Q2 print. Morgan Stanley raised Marvell (MRVL) PT to $115 — Jensen's recent endorsements lifted the entire AI-semi complex Thursday. JPMorgan raised airline group (DAL/UAL/LUV) again on the durable jet-fuel windfall.
Downgrades / target cuts: Bernstein cut Kroger (KR) PT to $58 — was $72 — on the margin commentary. Wells Fargo cut Costco (COST) PT modestly. Morgan Stanley trimmed Walmart (WMT) PT on consumer-staples margin compression read-through. Citi reduced high-end housing exposure (RH, WSM).
9. STOCKS TO WATCH
Nvidia (NVDA) — Goldman PT $185 ahead of Q2. Led the chip rebound Thursday +2.8%.
Marvell (MRVL) — Morgan Stanley PT $115. Jensen-endorsement tailwind extending.
MSFT / GOOGL — Cleanest capex-to-revenue in the hyperscaler set. Citrini-preferred.
BWXT / CCJ — SMR fuel + uranium. Position for the multi-year buildout.
Kroger (KR) — 52-week low. Bernstein PT $58. Watch for value-investor support at $55.
Walmart (WMT) / Costco (COST) — Under pressure from the Kroger read-across.
Airlines (DAL/UAL/LUV) — Cleanest Iran-peace beneficiary still in force.
SPCX — Stabilizing near $172 after the Wed rout. Watch the $170 technical level.
TLT — Stop avoiding duration as aggressively. Curve has settled.
10. GLOBAL MACRO SNAPSHOT
Europe: Stoxx 600 modestly lower this morning as investors assess the durability of the Iran deal alongside the broader U.S. policy divergence. The ECB's Lagarde yesterday emphasized 'data-dependence' without committing on the September meeting path. EUR/USD recovered modestly to 1.0670. The German Ifo business climate index Monday will be the next material European data point.
Asia: Mixed-to-soft session. Nikkei -0.18%; Hang Seng -0.74% on continued China property concerns; ASX -0.30%. The BoJ meets next Wednesday — Ueda's commentary on the path of policy normalization will matter into the JPY tape (currently 157.40). If Ueda telegraphs a July or August hike, the yen-funded carry trades could unwind rapidly, with cross-asset implications.
Emerging markets: A challenging week, broadly. The dollar-strength tax compounds with the China property overhang for the EM equity complex. The bright spot has been India — the rupee held near 84 and SENSEX is essentially flat for the week despite the dollar move. We continue to favor India as the relative-EM-equity story.
11. WEEK AHEAD PREVIEW
Today (Fri 6/19): Iran deal signing in Geneva. S&P Global flash PMIs 9:45.
Monday-Tuesday: Quiet macro start to the week — Chicago Fed Mon, Existing Home Sales Tue.
Wednesday: BoJ rate decision (overnight); New Home Sales 10:00 AM.
Thursday: Q1 GDP final revision; Carnival, FedEx earnings; durable goods.
Friday June 26: Core PCE (May) — KEY. Consensus +0.27% m/m / +2.9% y/y. This is the inflation print Warsh has explicitly anchored his hawkish posture to. A hot print pushes December hike toward fully priced; a soft print unwinds a meaningful slug of yesterday's bond move.
Beyond: July 9 FOMC minutes, July 14 bank earnings, July 15 June CPI, early August Nvidia Q2. The macro path is now meaningfully data-dependent — Warsh has explicitly said so.
12. THE CLOSING THOUGHT
Three weeks ago we framed the Iran-deal narrative as the central macro story. Yesterday told us the FOMC was actually the central story. Today's Iran signing closes that loop — but the bond market spent yesterday already past it, pricing the Warsh-Fed regime change as the dominant flow. Thursday's equity rebound was the technical complement: with the term structure repriced, growth multiples are back in play. Whether that lasts depends on three things, in order: (1) how cleanly the consumer tape extends — the Kroger flag matters; (2) whether the June core CPI on July 15 validates the hawkish dot plot or undercuts it; (3) whether the dollar's policy-divergence strength persists into the BoJ meeting next Wednesday. We continue to favor the AI-power and physical-AI picks-and-shovels at the core of the long-term thesis, the Citrini-preferred hyperscalers (MSFT/GOOGL), and selectively the rate-sensitive cyclicals that the curve repricing has temporarily mispriced. Have a great weekend — we will be back Monday morning with the post-Iran-signing and post-PMI read.
THE BROOKSIDE BRIEF · COMPILED 9:30 AM ET · SOURCES: CNBC / THESTREET (JUNE 17-18 CLOSES), KROGER IR (Q1 FY26 RELEASE), TIKR, U.S. CENSUS BUREAU, BLS, FEDERAL RESERVE H.15, CME FEDWATCH, AL JAZEERA / POLYMARKET (IRAN DEAL DETAIL), CITRINI RESEARCH, ASCHENBRENNER 'SITUATIONAL AWARENESS'
MORNING EDITION · WEDNESDAY, JUNE 24, 2026 · BoJ AT 1.00% · 2-YR UST 4.30% · VIX 19.8
Daily Markets Briefing
The Brookside Brief
Markets · Macro · The Day Ahead
1. THE MORNING SETUP
Good morning. Friday's brief warned that the Thursday rebound was contingent on three things — the durability of the Iran-deal energy disinflation, a soft June core CPI, and the dollar's policy-divergence strength holding. The first leg of that thesis broke on Sunday: follow-up U.S.-Iran talks scheduled in Switzerland were called off, the status of the Strait of Hormuz is once again uncertain, and the post-signing optimism is fraying. Markets responded yesterday. The Nasdaq Composite shed 2.21% to 25,587.04, the S&P 500 fell 1.44% to 7,365.46, and the Dow was nearly unchanged at 51,666.84 (−0.09%, −45.87 points). Semis took the bulk of the damage: the SOX fell roughly 4%, Nvidia gave back 3.1%, Marvell −5.2%, Broadcom −3.6%.
The catalyst that pushed the tech complex over the edge was a Bank of America rates research note circulated Monday afternoon arguing the December hike is now underpriced — BofA's house view shifted to 80% probability of at least one hike and 35% probability of two by year-end. The 2-year Treasury yield jumped to its highest level since February 2025, the 10-year hovered near 4.50%, and a fresh round of AI-capex skepticism (echoing the Citrini thesis we walked through last Thursday) added to the equity-duration pressure.
Overnight, the Bank of Japan made the second-biggest macro decision of the year. The Policy Board voted 7-1 to hike the short rate 25 basis points to 1.00% — the highest Japanese policy rate since September 1995. Deputy Governor Himino's commentary this morning explicitly signaled more tightening is coming. The yen weakened paradoxically to roughly 160.80 against the dollar despite the hike, on the read that even a hawkish BoJ cannot keep up with the Warsh-Fed's hawkish posture. Section 4 walks through the implications for yen-funded carry trades, EM positioning, and the dollar-strength tape.
FedEx delivered the bright spot after the close yesterday: Q4 fiscal '26 revenue of $25.0 billion (+12.5% Y/Y, vs $24.04B consensus), adjusted EPS of $6.31 (vs $5.96 consensus). International Priority package yields rose 16% — the cleanest read on the trade tape we have had all year. The CY 2026 outlook guides to $16.90-$18.10 EPS and ~11% revenue growth. FedEx is indicated up 6-7% pre-market — bucking the broader risk-off setup.
Today's Sector Spotlight pivots to a name that has been the breakout AI-semi story of 2026 but is suddenly very much in question: Marvell Technology. Up 64% year-to-date through Monday on the back of Jensen Huang's repeated public endorsements for custom-silicon and AI-networking, MRVL gave back 5.2% yesterday in the broader semi rout. The question — and the centerpiece of today's brief — is whether the Jensen-endorsement tailwind is sustainable as the AI-capex cycle question intensifies. Three charts walk through it.
2. MARKETS AT A GLANCE
U.S. EQUITY FUTURES (PRE-OPEN, POST-BOJ + FEDEX BEAT)
Asset
Last
Change
% Chg
S&P 500 (ES)
7,378
+12
+0.16%
Nasdaq 100 (NQ)
25,510
+30
+0.12%
Dow (YM)
51,860
+195
+0.38%
Russell 2000 (RTY)
2,332
+5
+0.21%
PRIOR CLOSE (TUESDAY, JUNE 23 — TECH-LED ROUT)
Asset
Last
Change
% Chg
S&P 500
7,365.46
-107.85
-1.44%
Nasdaq Composite
25,587.04
-580.20
-2.21%
Dow Jones Industrial Avg.
51,666.84
-45.87
-0.09%
Russell 2000
2,326.50
-25.10
-1.07%
VIX
19.80
+2.10
+11.9%
RATES & FX — 2Y HIGHEST SINCE FEB 2025, BOJ AT 1.0%, YEN STILL WEAKENS
Asset
Last
Change
% Chg
UST 2-Year
4.30%
+10 bps from Fri
—
UST 10-Year
4.499%
+0.6 bps
—
UST 30-Year
4.96%
+3 bps
—
10-Yr TIPS (real)
2.18%
-1 bp
—
DXY (Dollar Index)
100.85
+0.60
+0.60%
EUR/USD
1.0610
-0.0060
-0.56%
USD/JPY
160.80
+3.40
+2.16% post-BoJ
COMMODITIES & CRYPTO
Asset
Last
Change
% Chg
WTI Crude (Aug)
$79.10
+$3.00 wk-to-date
Iran snag
Brent Crude (Aug)
$81.85
+$3.30 wk-to-date
Iran snag
Gold (spot)
$1,772
+$14
+0.80%
Silver (spot)
$20.95
+$0.20
+0.96%
Bitcoin
$82,400
-$2,500
-2.95%
ASIA & EUROPE (INTRADAY)
Asset
Last
Change
% Chg
Nikkei 225
38,560
-650
-1.66%
Hang Seng
21,140
-420
-1.95%
Shanghai Composite
3,142
-38
-1.20%
Stoxx Europe 600
561.20
-3.00
-0.53%
FTSE 100
8,762
-28
-0.32%
DAX
20,180
-115
-0.57%
3. TOP STORIES
BoJ Hikes 25 bps to 1.00% — Highest Policy Rate Since 1995
The Bank of Japan's Policy Board voted 7-1 overnight to raise the short-term rate by 25 basis points to 1.00% — the highest Japanese policy rate since September 1995. Deputy Governor Ryozo Himino chaired the meeting in Ueda's absence (Ueda was hospitalized on June 9 for a liver cyst infection but has since been discharged). Himino's commentary this morning was unambiguous: 'The BoJ will continue raising interest rates while closely monitoring the risk that underlying inflation could exceed our 2% target.' The summary did not telegraph specific timing on the next hike but left the door open to a fall move. Paradoxically, the yen weakened on the decision — USD/JPY now at 160.80, up roughly 2% from yesterday's close. The market read: even a hawkish BoJ at 1.00% cannot keep pace with the Warsh-Fed's hawkish posture, and the policy-divergence trade extends.
Iran Deal Under Strain — Swiss Follow-Up Talks Called Off
Less than a week after Friday's Geneva signing, the U.S.-Iran agreement has hit its first major snag. Planned follow-up talks in Switzerland were called off Monday, the status of the Strait of Hormuz is once again uncertain, and reports of localized Iranian naval activity around the Persian Gulf entry point have begun to circulate. Oil has reversed roughly half of last week's collapse — WTI back to $79.10, Brent to $81.85. UBS captured the consensus risk read: 'This agreement marks really the beginning rather than the end of the process to try to end the war and address Iran's nuclear capabilities.' We continue to assign roughly 60% probability the broader deal holds through July; the 40% downside tail is now more relevant than it appeared five days ago.
BofA Rate-Hike Note Triggers Tuesday Tech Rout
BofA's rates desk circulated a research note Monday afternoon arguing the December Fed hike is now meaningfully underpriced. The house view shifted to 80% probability of at least one hike by year-end (CME FedWatch had been pricing ~70%) and 35% probability of two hikes. The combination of last week's hot retail sales, the FOMC's hawkish dot plot, and the Iran-deal snag (which puts oil and therefore inflation expectations back in play) supports a more aggressive forward path than the market had been pricing. The 2-year Treasury yield jumped to its highest level since February 2025 in response, and the tech complex took the duration hit hardest: SOX −4%, Nasdaq −2.21%, with semis and high-multiple AI-software the worst performers.
FedEx +6-7% Pre-Market on Strong Q4 Beat — International Priority Yields +16%
FedEx delivered the bright spot after Tuesday's close. Q4 fiscal '26 revenue of $25.0B (+12.5% Y/Y, vs $24.04B consensus), adjusted EPS of $6.31 (vs $5.96 consensus). The standout: International Priority package yields rose 16% Y/Y — the cleanest read we have on the trade tape and a meaningful tell on global goods demand still being firm despite the broader macro overhang. FY26 adjusted FCF came in at $4.7B; the company exceeded its $1B transformation savings target. CY 2026 outlook guides to $16.90-$18.10 adjusted EPS on ~11% revenue growth — both above consensus. FedEx indicated up 6-7% in pre-market, bucking the broader risk-off setup.
Micron (MU) Reports After Close — The Test for the AI-Semi Bull Case
Micron's fiscal Q3 print after today's close is the most important earnings event since Adobe's Firefly miss two weeks ago. Consensus: EPS $1.65 on revenue of $8.85B. The key disclosure to watch: HBM3E/4 capacity utilization, customer commitment for 2027, and any guidance on the next-generation HBM4E ramp. Micron is the cleanest indirect read on Nvidia/Hyperscaler AI-capex commitments — the company's HBM3E revenue is essentially a 1:1 derivative of Blackwell B100/B200 unit shipments. A soft print or cautious 2027 commentary would compound the Citrini AI-capex discipline thesis; a clean beat-and-raise extends the chip-led bounce-back narrative.
Three discrete macro events have stacked in the past 72 hours, and each pushes the rate environment more hawkish than where it stood at Friday's close. The cleanest read of the cumulative shift: the policy environment is meaningfully tighter than anyone was pricing a week ago, and the cross-asset implications are still working their way through the tape.
Fig. 1 — BoJ policy rate trajectory. Yesterday's 1.00% is the highest Japanese policy rate since September 1995.
The BoJ hike is the most important institutional change of the night. A 7-1 vote at 1.00% — the highest since 1995 — with explicit Deputy Governor commentary that more hikes are coming is, in our view, the central macro pivot of the summer. The yen's paradoxical weakening (USD/JPY 160.80) tells you the market is pricing the divergence — a Warsh-Fed signaling hikes outweighs a BoJ that is finally normalizing. The implication for the yen-funded carry trade is significant. Roughly $1 trillion of carry-trade exposure is funded in yen across global macro hedge funds and asset managers. A sustained move toward USD/JPY 165 would trigger forced unwinds — equity selling, EM-currency selling, dollar buying. The August 2024 carry-trade unwind that rattled global equities was driven by a much smaller move; the setup now is larger.
WHY THE YEN CARRY TRADE MATTERS GLOBALLY
The carry trade in its simplest form: borrow in a low-interest-rate currency (the yen at -0.10% in 2024, now 1.00%), convert to a higher-yielding currency (the dollar at 5.25% throughout the Powell cycle), and invest in higher-yielding assets. As long as the yen does not appreciate against the dollar, the trade generates the rate differential as profit. Globally, an estimated $1-2 trillion of leverage has been deployed in yen-funded trades over the past five years — much of it in U.S. and EM equities. The risk: if the yen appreciates rapidly against the dollar, the trade moves against the borrower from both sides — the FX move erodes the principal, and the cross-rate move can trigger margin calls. The August 2024 unwind saw the yen appreciate roughly 11% in three weeks; the S&P fell 8.5% in a single week as carry trades unwound. Today's BoJ hike, with USD/JPY at 160.80, looks like a setup for a potential unwind. The trigger would be either a faster-than-expected BoJ tightening OR Japanese FX intervention to support the yen. Both are live possibilities through the summer.
The Iran-deal snag is the second macro shift. Less than a week after Friday's Geneva signing, follow-up talks have been called off, the Strait of Hormuz status is uncertain, and oil has reversed roughly half of last week's collapse. WTI back to $79.10, Brent to $81.85. The implication for the inflation expectations channel — the framework we walked through in detail in the Friday June 12 brief — is direct. Cheaper oil pulled breakevens lower; the partial reversal pushes them back up. The Fed's PCE projection of 3.6% by year-end is, if anything, more credible today than it was at the press conference last Wednesday. The 2-year is at 4.30%; the 10-year at 4.499%. The curve is repricing the hawkish path, and there is room for more.
The BofA rate-hike note circulated Monday afternoon is the third macro shift. The house view moving to 80% probability of at least one hike by year-end (vs CME's ~70%) — and 35% probability of two — is meaningful because BofA's rates desk has historically been on the hawkish end of consensus. If the desk's view migrates to mainstream consensus over the next two weeks, the front-end curve has another 15-25 bps to repricethrough July. The July 11 June CPI print becomes the binary catalyst.
5. ECONOMIC CALENDAR — TODAY AND WEEK AHEAD
Day
Time (ET)
Release
Consensus / Actual
Fri 6/19
All day
Iran deal signed in Geneva
14-pt MOU
Mon 6/22
PM
Swiss follow-up talks cancelled
Deal under strain
Tue 6/23
Close
Tech-led rout
SPX -1.44% / Nasdaq -2.21%
Tue 6/23
After close
FedEx Q4 (released)
Beat + guidance
Wed 6/24
Overnight
BoJ +25 bps to 1.00%
7-1 vote; 1995 high
Wed 6/24
10:00 AM
New Home Sales (May)
720K
Wed 6/24
After close
Micron (MU) Q3 — KEY
EPS $1.65 / Rev $8.85B
Thu 6/25
8:30 AM
Q1 GDP (final)
+2.3%
Thu 6/25
8:30 AM
Durable Goods (May)
+0.4%
Thu 6/25
8:30 AM
Initial Jobless Claims
228K
Thu 6/25
Various
Nike (NKE), Carnival (CCL)
—
Fri 6/26
8:30 AM
Core PCE (May) — KEY
+0.27% m/m / +2.9% y/y
6. EARNINGS WATCH
Today: Micron (MU) after-close is the headline print — see Top Stories. General Mills (GIS) before-open is the second-most-watched consumer-staples print this week (Kroger read-through). Carnival (CCL) tomorrow morning, Nike (NKE) tomorrow after-close. FedEx's beat last night sets a strong tone for the freight/global-goods complex.
Looking ahead: Q2 reporting season opens July 14 with JPMorgan, Wells Fargo, and Citigroup. Nvidia's Q2 in early August is the next major AI-infrastructure event — with the Citrini-thesis pressure now active and Micron printing tonight, the read-through to Nvidia's August commentary becomes the single most important AI signal of the summer.
7. SECTOR SPOTLIGHT: MARVELL, JENSEN'S ENDORSEMENT, AND THE CUSTOM-SILICON QUESTION
We have spent the past two weeks examining the AI-capex thesis from the macro side — the SpaceX/orbital-AI valuation question, the Citrini 'trillion-to-trillions' capex/revenue gap. Today we narrow the focus to a single name that has been the breakout AI-semi winner of 2026 and is suddenly very much in question: Marvell Technology (MRVL). The setup is interesting because Marvell's story is a microcosm of the broader AI investment cycle — both the upside (Jensen's public endorsements drove the stock up 64% YTD through Monday) and the downside (Tuesday's −5.2% on the rate scare reflects how fragile the multiple has become).
Fig. 2 — YTD performance comparison. Marvell +64% has been the dominant AI-semi winner of 2026.
First, the Jensen tailwind. Over the past nine months, Nvidia's Jensen Huang has repeatedly singled out Marvell as a critical partner in the AI-infrastructure stack — in CES 2026 remarks, in the May GTC keynote, in interviews with CNBC and Bloomberg. The specific endorsements have focused on three areas: (1) Marvell's leadership in AI-networking silicon (the PAM4 DSP and 800G/1.6T platforms), (2) the company's custom-silicon partnerships for hyperscaler AI ASIC programs, and (3) the optical-interconnect platforms that complement Nvidia's NVLink switch architecture. Cumulatively, these endorsements have been worth roughly $50 of Marvell's $60 year-to-date share-price appreciation. Jensen, in effect, has been Marvell's most valuable spokesperson.
Second, the customer-concentration risk that makes the bull case fragile. Roughly 70% of Marvell's FY26 data-center revenue is estimated to come from three hyperscalers — AWS (Trainium 2/3 custom silicon), Microsoft (Maia and other custom ASICs), and Google (TPU sub-systems). Meta's MTIA program adds another ~10%. That is among the highest customer-concentration ratios in the entire semiconductor complex — and it is exactly the kind of customer profile that gets hurt fastest when the hyperscaler AI-capex cycle slows.
Fig. 3 — Marvell customer concentration. ~70% of data-center revenue from the top 3 hyperscalers.
Third, the valuation context. Marvell trades at roughly 38x forward earnings — comparable to Nvidia (40x) and above Broadcom (28x) and AMD (32x). At 38x, the multiple embeds two assumptions: (a) the hyperscaler custom-silicon ramp continues uninterrupted through 2027, and (b) Marvell maintains or grows share within each customer's ASIC roadmap. Both assumptions are reasonable today. Both are vulnerable to the Citrini AI-capex discipline thesis we walked through last Thursday. If hyperscaler capex growth slows from the current ~$390B Big Four 2026 run-rate to a more modest ~$420B 2027 number (vs the bull case ~$500B), Marvell's revenue trajectory compresses meaningfully, and the multiple has to retrace.
HOW JENSEN-ENDORSEMENT-DRIVEN RALLIES TYPICALLY END
Jensen Huang's public endorsements have been one of the most valuable marketing assets in the technology sector of the past three years. Names he has explicitly endorsed have outperformed the SOX by an average of roughly 18 percentage points over the three months following the endorsement. The pattern works because Jensen's credibility is unusually high and his customer relationships span the full hyperscaler set. But the pattern has a predictable failure mode: when the endorsement-driven multiple expansion outpaces the fundamentals — meaning, when the stock has already priced in the partnership win — the next leg of the move depends on the partnership delivering in revenue terms. Marvell sits at exactly that inflection point now. The endorsement tailwind is largely priced. The next leg requires the AWS Trainium 3, Microsoft Maia v2, and Google TPU v7 ASIC programs to ramp on schedule AND maintain Marvell's design wins through the next refresh cycle. If they do, the stock has room. If Citrini is right and hyperscaler capex discipline kicks in, MRVL's earnings revisions go negative fast — and a 38x multiple becomes very hard to defend.
Our read. Marvell is, in many ways, the cleanest expression of the broader AI-capex question we have been working through for two weeks. The bull case is real — the Jensen endorsements are credible, the custom-silicon design wins are documented, the FY26 revenue trajectory is intact. The bear case is also real — customer concentration is structurally high, the multiple embeds optimistic hyperscaler capex assumptions, and the recent rate environment makes the duration of those revenues meaningfully less valuable. Our positioning tilt: we do not chase MRVL at these levels but we do not fade it aggressively either. We continue to favor the broader AI-power and physical-AI picks-and-shovels (CEG, VST, GEV, SYM, CGNX) as cleaner expressions of the long-term thesis with lower customer-concentration risk. Within the semis complex, we prefer Broadcom (more diversified end-markets) and TSMC (foundry leverage) over the custom-silicon ASIC pure-plays.
8. ANALYST CALLS DRIVING ACTION
Upgrades / target hikes: Morgan Stanley raised FedEx (FDX) PT to $310 post-earnings. JPMorgan reiterated Buy on Nvidia (NVDA) at $185 ahead of August Q2. Goldman raised United Airlines (UAL) PT to $115 on the freight-yields read-across.
Downgrades / target cuts: BofA's rates note triggered a wave of equity-side trims — Tesla (TSLA) to $470, ServiceNow (NOW) to $920, Oracle (ORCL) to $215. Bernstein trimmed Marvell (MRVL) PT to $105 — citing exactly the customer-concentration risk Section 7 walks through. UBS cut Walmart (WMT) PT on the Kroger read-across.
9. STOCKS TO WATCH
Marvell (MRVL) — −5.2% Tuesday on the rate scare. Bernstein PT cut to $105. The Jensen-endorsement story is being tested.
Nvidia (NVDA) — Goldman maintained PT $185. The Q2 print in August is the most important AI signal of the summer.
GE Vernova (GEV) / Eaton (ETN) — Electrification picks-and-shovels.
Airlines (DAL/UAL/LUV) — Goldman raised UAL on freight-yields read.
USD/JPY — Watch 162. A move through there triggers Japanese FX intervention risk.
TLT — Avoid duration again. 2Y at 2025 highs; BoFA rate-hike note still live.
10. GLOBAL MACRO SNAPSHOT
Japan: The BoJ hike + weaker yen story dominates. Nikkei -1.66% on the day as the yen weakness compounds with the U.S. tech-rout read-through. Watch for Ministry of Finance intervention rhetoric — the line in the sand was historically 162; we are at 160.80 this morning.
Europe: A softer session as the dollar surge weighs broadly. Stoxx 600 -0.53%, FTSE -0.32%, DAX -0.57%. ECB's Lagarde speaks tomorrow at 9:00 a.m. ET; any divergence signal from her would matter into EUR/USD (currently 1.0610). The euro is now down 1.6% week-to-date.
Emerging markets: A difficult session. Hang Seng -1.95% on China property worries + U.S. tech rout. The dollar strength is now the dominant tax on EM. We continue to favor India relatively — the rupee has held near 84 despite the dollar move, and the domestic-demand story is meaningfully insulated from the U.S. rate path.
11. WEEK AHEAD PREVIEW
Today: New Home Sales 10am; Micron after-close.
Thursday: Q1 GDP final, durable goods, claims — three meaningful data points at 8:30. Carnival morning, Nike after-close.
Friday: CORE PCE (May) — KEY. Consensus +0.27% m/m / +2.9% y/y. This is the inflation print Warsh anchored his hawkish posture to. Hot print pushes December hike toward fully priced + extends the curve repricing; soft print unwinds the post-FOMC bond move.
Beyond: July 9 FOMC minutes (Warsh's first), July 11 June CPI, July 14 bank earnings, August Nvidia Q2.
12. THE CLOSING THOUGHT
The four trading days since Friday's Iran-deal signing have been a textbook lesson in how quickly macro narratives reverse. The deal that was supposed to anchor a disinflation glide path has shown its fragility in less than a week. The Fed hike that the bond market priced last Wednesday has been confirmed by Tuesday's BofA rate-hike note and overnight by the BoJ's own hawkish pivot. The post-FOMC growth-stock rebound that looked durable on Thursday gave back roughly two-thirds of its gains in a single Tuesday session. We are back to a tape where rates, FX, and AI-capex discipline are all pulling the same direction — tighter financial conditions, compressed multiples, and an AI-semi complex that needs Micron and Nvidia to deliver on the fundamentals rather than the narrative. Micron prints tonight; Core PCE lands Friday. Two binary events that will define the next two weeks of positioning. We continue to favor the picks-and-shovels of the AI buildout (CEG, VST, GEV, SYM, CGNX) over the headline OEMs, prefer Broadcom and TSMC within semis to the custom-silicon names with elevated customer-concentration risk like Marvell, and remain cautious on duration given the renewed hawkish setup. Watch the yen — we are 120 pips from Ministry of Finance intervention territory.
THE BROOKSIDE BRIEF · COMPILED 9:30 AM ET · SOURCES: THESTREET / CNBC (JUNE 23 CLOSE), JAPAN TIMES (BoJ HIKE), BANK OF JAPAN POLICY STATEMENT, CME FEDWATCH, BofA RATES (RATE-HIKE NOTE), FEDEX IR (Q4 FY26 RELEASE), MORGAN STANLEY / GOLDMAN (MRVL/NVDA COVERAGE), CITRINI RESEARCH, ASCHENBRENNER 'SITUATIONAL AWARENESS'
Good morning. Yesterday's Sector Spotlight on Marvell's customer-concentration risk argued that the AI-semi complex was facing a discipline reckoning. Last night Micron delivered the most decisive counter-data point we have seen all year. The print was extraordinary by any measure: revenue of $41.46 billion (versus $35.7B consensus, a 16% beat); non-GAAP EPS of $25.11 (versus $20.49 consensus, a 23% beat); gross margin at 86% — a record for the company and arguably for the broader memory complex. And the guidance was even louder: fiscal Q4 revenue of $50 billion plus or minus $1B, gross margin approximately 86%, EPS of $31 plus or minus $1. The stock jumped 13.1% in after-hours trading to $1,185.90 — within 3% of the 52-week high.
Three numbers from the print deserve standalone attention. First, the revenue trajectory: $9.3 billion in fiscal Q3 2025 → $50 billion guide for fiscal Q4 2026, a 5.4x ramp in five quarters. Second, the customer commitments: management disclosed $100 billion of contracted customer agreements — a level of forward visibility that no semiconductor company has carried into a downturn in the modern era. Third, the HBM disclosure: HBM3E and HBM4 are fully booked through calendar 2027, with demand extending into 2028. High-volume HBM4 shipments are in flight, HBM4E is sampling for 2027 production, and 256GB DDR5 RDIMMs are sampling. The supply side of the AI compute equation is, by Micron's own data, supply-constrained through 2027.
The market is opening to the Micron tape with the Nasdaq futures up roughly 1.6% pre-open, S&P up 0.9%, Dow up 0.4%. Treasury yields are stable — the 10-year at 4.485%, slightly below where it closed Wednesday. The semis complex is broadly bid: Nvidia indicated +3.1%, Broadcom +2.4%, Marvell +4.5% (recovering some of Tuesday's −5.2%), AMD +2.8%. The dollar has eased modestly, USD/JPY at 160.40 (off the 160.80 post-BoJ peak). Oil drifted lower overnight as the Iran-deal-snag concern eased modestly — WTI now $77.45, Brent $80.20.
Today is also a high-impact data day. Q1 GDP final, initial jobless claims, and May durable goods orders all release at 8:30 a.m. ET. Consensus: GDP +1.6%, claims 225K, durables +0.2%. Carnival reports this morning. Nike has been re-scheduled to next Tuesday June 30 (we had it on today's calendar yesterday — correcting). The bigger macro event sits Friday morning: Core PCE for May, the Fed's preferred inflation gauge, lands at 8:30 a.m. ET. Consensus: +0.27% m/m, +2.6% y/y. The print Warsh explicitly anchored his hawkish posture to.
Today's Sector Spotlight directly addresses the question Micron just forced us to ask: after this print, does the AI-capex thesis we have been pressure-testing for two weeks need a rewrite? Three charts walk through the case.
2. MARKETS AT A GLANCE
U.S. EQUITY FUTURES (PRE-OPEN, POST-MICRON BLOWOUT)
Asset
Last
Change
% Chg
S&P 500 (ES)
7,422
+64
+0.87%
Nasdaq 100 (NQ)
25,895
+410
+1.60%
Dow (YM)
52,055
+205
+0.40%
Russell 2000 (RTY)
2,355
+22
+0.94%
PRIOR CLOSE (WEDNESDAY, JUNE 24 — FLAT AHEAD OF MICRON)
Asset
Last
Change
% Chg
S&P 500
7,358.22
-7.24
-0.10%
Nasdaq Composite
25,476.64
-110.40
-0.43%
Dow Jones Industrial Avg.
51,848.90
+182.06
+0.35%
Russell 2000
2,333.20
+6.70
+0.29%
VIX
18.70
-1.10
-5.55%
RATES & FX — YIELDS EASE, DOLLAR SOFTENS, YEN STABILIZES
Asset
Last
Change
% Chg
UST 2-Year
4.27%
-3 bps
—
UST 10-Year
4.485%
-1 bp from Wed
—
UST 30-Year
4.94%
-2 bps
—
10-Yr TIPS (real)
2.16%
-2 bps
—
DXY (Dollar Index)
100.55
-0.30
-0.30%
EUR/USD
1.0655
+0.0045
+0.42%
USD/JPY
160.40
-0.40
-0.25%
COMMODITIES & CRYPTO
Asset
Last
Change
% Chg
WTI Crude (Aug)
$77.45
-$1.65
-2.09%
Brent Crude (Aug)
$80.20
-$1.65
-2.02%
Gold (spot)
$1,765
-$7
-0.40%
Silver (spot)
$20.85
-$0.10
-0.48%
Bitcoin
$85,200
+$2,800
+3.40%
ASIA & EUROPE (INTRADAY) — MICRON LIFTS GLOBAL SEMIS
Micron Technology reported fiscal Q3 2026 results after Wednesday's close in what is now the defining AI-capex tape data point of the spring. Revenue of $41.46 billion versus $35.7B consensus — a 16% beat. Non-GAAP EPS of $25.11 versus $20.49 consensus — a 23% beat. GAAP net income of $28.24 billion. Gross margin at 86% — a record. Fiscal Q4 guidance: revenue $50 billion plus or minus $1B, gross margin approximately 86%, EPS $31 plus or minus $1. The company also disclosed $100 billion of contracted customer agreements — a level of forward visibility unprecedented in the modern semiconductor era. Stock jumped 13.1% in after-hours trading to $1,185.90, within 3% of the 52-week high.
HBM3E/HBM4 Fully Booked Through 2027 — Demand Extending Into 2028
The HBM disclosure embedded in last night's release is, in our view, even more important than the headline numbers. Management explicitly stated that HBM3E and HBM4 capacity is fully booked through calendar 2027, with customer-level demand extending into 2028. High-volume HBM4 shipments are in flight; HBM4E is sampling for 2027 production; 256GB DDR5 RDIMMs are sampling for hyperscaler deployment. The implication is direct: the supply side of the AI-compute equation is supply-constrained through 2027, which means the Citrini-thesis 'AI capex discipline' argument has a meaningful supply-side problem. Hyperscaler capex can be disciplined in dollar terms only if Nvidia, AMD, and the broader AI-compute complex actually has the option to slow shipments — and Micron's data says they cannot. Sold-out HBM through 2027 is, by definition, a supply-constraint signal, not a demand-discipline signal.
Wednesday Close: Flat Ahead of Micron — Dow Notably Outperforms
Wednesday's tape was an exercise in patience — the entire market was waiting on Micron. S&P -0.10% to 7,358.22, Nasdaq -0.43% to 25,476.64. The Dow added 182.06 points (+0.35%) to 51,848.90 — notable because the Dow's outperformance reflects the broad-defensive rotation as investors hedged the binary Micron event. Treasury yields fell modestly as oil drifted lower; the 10-year settled below 4.50% (at 4.495%). The VIX closed at 18.70, down 1.10 from Tuesday's 19.80.
High-Impact Data Day: GDP Final, Claims, Durables at 8:30
Three meaningful data releases at 8:30 a.m. ET. Q1 GDP final at 1.6% consensus — the revision risk is asymmetric to the upside given upward inventory revisions in the prior month's data. Initial jobless claims at 225K consensus — the recent trend has been remarkably consistent in the 225-230K range. May durable goods at +0.2% headline consensus, ex-transport +0.2%. The combined read will inform Friday's Core PCE setup — a hot durables print combined with strong consumer momentum (Wednesday's retail sales) supports the hawkish dot plot.
Some constructive movement on the Iran tape overnight: reports suggest the Switzerland follow-up talks may resume in the next 10 days, with a revised agenda that includes broader regional security commitments. Iranian Foreign Ministry commentary today was notably less confrontational than Monday's. Oil drifted lower in response — WTI to $77.45, Brent to $80.20. We continue to assign roughly 60% probability the broader deal holds through July, but the path is meaningfully rockier than the optimistic post-signing read implied.
4. MACRO & FED WATCH — HIGH-IMPACT DATA DAY AHEAD, CORE PCE FRIDAY
Today is, by the standard market-impact framework, a HIGH-IMPACT data day. Three 8:30 a.m. releases (GDP final, claims, durables) follow Micron's after-hours print, and Core PCE for May lands tomorrow morning. The combined 48 hours will determine whether the post-FOMC bond-market repricing extends further or finally finds a stable equilibrium.
Our pre-data read of the setup: the bond market is positioned for hot data. The 2-year at 4.27% reflects the BofA-led rate-hike-note repricing of Monday and the BoJ-hike spillover from Wednesday. A 1.6% GDP final and an in-line 225K claims would be macro-neutral. A durables miss to the upside (above +0.4%) combined with strong ex-transport (above +0.4%) would extend the 2-year repricing into the 4.30-4.35% range. A miss to the downside would unwind a meaningful slug of the post-FOMC bond move. The setup is asymmetric in a way that, frankly, favors the bears today — the data has been consistently firmer than consensus through the spring.
Tomorrow's Core PCE is the central event of the week. The consensus +0.27% m/m / +2.6% y/y print is what Warsh's dot plot is implicitly assuming. A hot Core PCE — above +0.32% m/m — pushes the December hike toward fully priced and could trigger another semi-led rout on duration math. A soft print — below +0.20% m/m — would be the only data point that meaningfully unwinds the curve repricing of the past two weeks. We assign roughly 55% probability the print comes in within consensus range (+0.20% to +0.32%), 25% to the upside risk, 20% to the downside.
THE Q1 GDP FINAL AND WHY IT RARELY MOVES MARKETS
The Q1 GDP final release at 8:30 today is technically a 'third estimate' — the Bureau of Economic Analysis releases GDP three times for each quarter: advance (roughly 30 days after quarter-end), second (60 days after), and final (90 days after). By the time the final print arrives, the underlying source data (retail sales, durable goods, trade balance, inventories) has already been folded into subsequent monthly releases. The market reaction to the final is typically muted — the bond market has already incorporated the inputs by this point. Today's print matters only if it materially diverges from the +1.6% consensus, or if the revision to corporate profits or PCE deflator components surprises. The bigger event in today's 8:30 release is usually the simultaneous durable goods print (especially the ex-transport, ex-defense control group) and the corporate-profits estimate embedded in the GDP report.
5. ECONOMIC CALENDAR — TODAY AND WEEK AHEAD
Day
Time (ET)
Release
Consensus / Actual
Tue 6/23
Close
Tech rout (released)
SPX -1.44%
Wed 6/24
Close
Flat ahead of Micron
SPX -0.10%
Wed 6/24
After close
Micron Q3 — released
BLOWOUT: $41.5B / +13% AH
Thu 6/25
8:30 AM
Q1 GDP (final)
+1.6%
Thu 6/25
8:30 AM
Initial Jobless Claims
225K
Thu 6/25
8:30 AM
Durable Goods (May)
+0.2% / ex-T +0.2%
Thu 6/25
Pre-open
Carnival (CCL)
—
Fri 6/26
8:30 AM
CORE PCE (May) — KEY
+0.27% m/m / +2.6% y/y
Fri 6/26
8:30 AM
Personal Income / Spending
+0.4% / +0.3%
Mon 6/29
8:30 AM
Pending Home Sales
-0.3%
Tue 6/30
After close
Nike (NKE) Q4 — released
Re-scheduled to 6/30
Wed 7/01
9:45/10:00
ISM Mfg / JOLTS
—
6. EARNINGS WATCH
Today: Carnival (CCL) before open. The cruise read on consumer-discretionary spending — watch bookings commentary and the international mix. The earnings tape is otherwise light through Friday. Nike (NKE) has been re-scheduled to Tuesday June 30 after-close (correction from yesterday's brief). Q2 reporting season opens July 14 with the big banks — JPMorgan, Wells Fargo, Citigroup. Nvidia's Q2 in early August is now the next genuinely market-moving AI earnings event, with the Micron read-through making it materially more important than it appeared a week ago.
7. SECTOR SPOTLIGHT: AFTER MICRON — DOES THE AI THESIS NEED A REWRITE?
Two weeks ago we used the Citrini Research note to argue that AI hyperscaler capex was outrunning AI revenue by a 6-to-1 ratio, and that the discipline of the marginal capex dollar would start to matter more in 2026 than in 2024. Yesterday we used Marvell's stretched 38x multiple and 70%-from-top-3 customer concentration to illustrate where that discipline would bite first. Last night's Micron print did not exactly invalidate either argument — but it materially shifted the weight of evidence toward the Aschenbrenner *Situational Awareness* thesis we have been carrying as the long-term anchor. Today's spotlight walks through what changed and what positioning implications follow.
Fig. 1 — Micron quarterly revenue trajectory. Five quarters from $9.3B to a $50B guide is a 5.4x ramp — historically unprecedented for a memory company.
Start with the most important single disclosure: HBM3E and HBM4 are fully booked through calendar 2027, with customer-level demand extending into 2028. That single sentence is the most decisive data point in the AI-capex debate we have seen all year. The Citrini-thesis question — when does the marginal capex dollar stop flowing? — has an answer if you take Micron's disclosure at face value: not in 2026, not in 2027. The supply side is constrained, which means hyperscaler capex is, in effect, demand-side bottlenecked. Even if Microsoft, Google, Meta, and AWS wanted to slow capex, the HBM/compute supply chain cannot deliver the units faster than they are already shipping. That is not a tulip-bulb dynamic — that is a 1849-gold-rush dynamic, where the picks-and-shovels providers (Micron, the foundries, the power complex) are the obvious beneficiaries.
Fig. 2 — Micron Q3 FY26 vs consensus. Revenue +16%, EPS +23%, gross margin record, and the FQ4 guide is the most aggressive memory-company guide of the modern era.
Three nuances are still worth flagging — and they matter for positioning. First, the supply-constraint signal validates demand visibility but does NOT directly validate the unit economics for the end-customers (the hyperscalers themselves). Micron sells to Nvidia and to Nvidia's customers; the question of whether Microsoft, Google, Meta, and Amazon are generating enough AI revenue to justify their capex still stands. The Citrini 'trillion-to-trillions' gap from last Thursday's brief remains directionally correct on the customer-economics side. What Micron's print invalidates is the IMMEDIATE timing-the-bubble case. The discipline question moves out from 2026/2027 to 2028 at the earliest.
Second, the customer-concentration risk we walked through for Marvell yesterday does NOT apply equally to Micron. Micron's HBM customers include all the major hyperscalers AND every leading AI chip designer (Nvidia, AMD, Broadcom-for-ASICs, Marvell-for-ASICs). The concentration ratio is much more diffuse. If any single hyperscaler slows capex, Micron is meaningfully less exposed than Marvell. That is what enables the $50B FQ4 guide with confidence.
Third, the price has moved a lot. Micron at $1,185 after-hours represents a forward P/E of roughly 35x on the implied calendar 2026 EPS — not cheap, but defensible against the visibility now disclosed. The risk for new long entries is that the stock has already moved most of the way to the bull case. The asymmetry of buying-at-the-print is narrower today than it was on Tuesday's close when the stock was 13% lower. The right way to play this, in our view, is to use the Micron print as validation for the broader AI-power and physical-AI picks-and-shovels we have consistently favored — not to chase Micron itself.
Fig. 3 — Brookside thesis scorecard, Aschenbrenner vs Citrini. After Micron, the Aschenbrenner thesis is ahead 3-1 on the AI-capex bull-vs-bear scorecard.
SUPPLY-CONSTRAINED VS DEMAND-CONSTRAINED: WHY THIS DISTINCTION MATTERS
When the market is trying to assess whether a capex cycle is 'real' or 'bubble,' the single most important diagnostic is whether the bottleneck is on the supply side or the demand side. A demand-constrained cycle — where customers have to be convinced to keep buying — is the textbook setup for a bubble bursting. Sales-driven thinking, free trials, promotional pricing, multi-year amortized deals to lock in volume — all of these are demand-constraint symptoms. A supply-constrained cycle — where customers are waiting in line and prices are firm or rising — is the textbook setup for a multi-year secular cycle. The 1849 gold rush was supply-constrained (physical gold; finite mining infrastructure). The 1999 dotcom bubble was demand-constrained (eyeball metrics; advertising revenue per click). Where does AI compute sit in mid-2026? HBM sold out through 2027 with demand extending into 2028, Nvidia Blackwell allocation tighter than ever, hyperscaler power-grid bottlenecks becoming the binding constraint. By every diagnostic we use, AI compute in 2026 is supply-constrained. That is not where bubbles end. That is where they sustain. Whether the demand profile holds beyond 2028 is the next-cycle question — but for the next 18-24 months, the data points clearly to the Aschenbrenner thesis.
Positioning implications. We are maintaining and modestly increasing core long exposure to the AI-power complex (CEG, VST, TLN, GEV, ETN, PWR) — the power-grid constraint is still the cleanest physical bottleneck on the AI buildout. We continue to favor Broadcom and TSMC within the semis complex over the custom-silicon ASIC pure-plays. Micron is now a deserved core long, but we are reluctant to chase at $1,185; we are buyers into any pullback to the $1,050-1,100 range. The physical-AI picks-and-shovels (SYM, CGNX, TER, ROK, ABB) we continue to favor. We are reducing exposure to consumer-staples-with-stretched-multiples (WMT, COST) on the Kroger-read-across discipline question we walked through Friday. The carry-trade overhang from the BoJ hike remains a meaningful tail risk — we recommend trimming Japan-exposed positions and watching USD/JPY closely.
8. ANALYST CALLS DRIVING ACTION
Upgrades / target hikes (Micron-driven wave): Morgan Stanley raised Micron PT to $1,450 from $980. Goldman raised MU to $1,400. Citi raised Nvidia (NVDA) PT to $215 on the HBM read-through. JPMorgan raised Broadcom (AVGO) to $1,900 on AI-networking read-through. Bernstein partially reversed yesterday's Marvell cut, raising back to $130 from $105 on the Micron-supply-constraint signal. Goldman raised AI-power complex names — CEG to $475, VST to $215.
Downgrades / target cuts: Sparse today amid the Micron-driven optimism. Bernstein trimmed Walmart (WMT) modestly on continued Kroger read-across. Wells Fargo cut Restoration Hardware (RH) further on high-end housing demand softening.
9. STOCKS TO WATCH
Micron (MU) — +13% after hours to $1,185.90. Morgan Stanley $1,450 PT. Buyers in pullbacks to $1,050-1,100.
Nvidia (NVDA) — Pre-market +3.1%. Citi PT $215. The cleanest HBM read-through.
USD/JPY at 160.40 — Watch 162 for MoF intervention risk.
TLT — Still cautious on duration; awaits Core PCE tomorrow.
10. GLOBAL MACRO SNAPSHOT
Asia: A strong session on the Micron read-through. Nikkei +0.93%, Hang Seng +1.80% (big bounce after Tuesday's drop), Shanghai +0.73%. Korean and Taiwan semi names led the Asia tape — Samsung +3.4%, TSMC ADR equivalent +2.8%, SK Hynix +5.1%. The supply-constrained-AI thesis lifts every name in the global semi supply chain.
Europe: Stoxx 600 +0.75% on the Micron lift. ASML indicated +3.2% in European trade as the front-end-photolithography supplier benefits directly from the HBM4/4E ramp. ECB's Lagarde speaks at 9:00 a.m. ET; we expect data-dependent rhetoric without explicit forward guidance. The euro recovered to 1.0655 on the broader risk-on tone.
Emerging markets: A constructive session as the dollar eased modestly. India bid on the broader risk-on; Korea up sharply on the semi tape; China rebounding from Tuesday's property-driven sell-off. The dollar-strength tax on EM is still a structural overhang, but for today the Micron tape dominates.
11. WEEK AHEAD PREVIEW
Today: GDP final / claims / durables at 8:30; Carnival pre-open; Lagarde at 9:00.
Friday — KEY: Core PCE (May) at 8:30. Consensus +0.27% m/m / +2.6% y/y. Hot print pushes December hike fully priced; soft print unwinds curve repricing.
Monday: Pending home sales at 8:30; quiet macro start.
Wednesday: ISM Manufacturing + JOLTS — the first read on July activity and labor.
Beyond: July 4 holiday-shortened week, July 9 FOMC minutes (Warsh's first), July 11 June CPI, July 14 bank earnings, August Nvidia Q2.
12. THE CLOSING THOUGHT
We have spent the better part of two weeks pressure-testing the AI-capex thesis from every angle we could find — Damodaran's SpaceX valuation discipline, Citrini's trillion-to-trillions capex/revenue gap, Marvell's customer-concentration risk, and the broader Random-Walk-Down-Wall-Street tulip-bulb framework. Last night Micron delivered a data point so decisive that the framework has to be updated in real time. HBM3E and HBM4 sold out through 2027, demand extending into 2028, an 86% gross margin, $100 billion of contracted customer agreements, $50 billion in a single quarter — these are not the numbers of a bubble in its terminal phase. They are the numbers of a supply-constrained physical buildout in its acceleration phase. The Aschenbrenner thesis we have carried as the long-term anchor is, as of yesterday evening, the more credible read of the AI-capex tape. Today's data (GDP, claims, durables) and tomorrow's Core PCE will determine the macro path. Micron has decided the AI-capex path through 2027. We continue to favor the picks-and-shovels of the buildout (CEG, VST, GEV, SYM, CGNX) over the headline OEMs, and now we are willing to add Micron itself to core long exposure on any pullback. Yesterday's Marvell spotlight stands — the customer-concentration risk is real and the Jensen-endorsement multiple is fragile — but the broader semi complex just received the biggest demand-side validation it has had in a year. Trade carefully through tomorrow's PCE, and we will be back Friday morning with the read.
THE BROOKSIDE BRIEF · COMPILED 9:30 AM ET · SOURCES: MICRON IR (Q3 FY26 PRESS RELEASE), CNBC / THESTREET (JUNE 24 CLOSE), INVESTING.COM (MICRON SLIDES), STOCKTITAN (MU EARNINGS), TRADINGKEY, U.S. CENSUS BUREAU, BEA, TREASURY H.15, ASCHENBRENNER 'SITUATIONAL AWARENESS', CITRINI RESEARCH, MALKIEL
Good morning, and welcome to a Monday that arrived with two competing narratives running at once. First, the weekend brought the most consequential geopolitical escalation since the original Iran-war breakout in April. On Saturday, a drone strike on a commercial ship transiting the Strait of Hormuz triggered a U.S. military response — strikes on Iranian surveillance infrastructure, communication systems, air defense sites, drone storage, and minelayer capabilities. Saturday night delivered a second wave of U.S. strikes. On Sunday, Iran retaliated, firing ballistic missiles and drones at the U.S. Ali Al Salem Air Base in Kuwait and the U.S. Fifth Fleet headquarters in Bahrain. By Sunday evening, Brent crude had spiked from $80.20 Friday close to $91.40 — and the carefully-constructed June 17 Islamabad Memorandum looked, for several hours, dead.
Then early Monday, the second narrative emerged: the U.S. and Iran agreed to halt the tit-for-tat strikes. Both sides announced peace talks would resume in Doha this week. Brent has retraced to roughly $83.50 — still elevated above Friday's close but well off the Sunday-evening peak. Equity futures are bouncing: Nasdaq 100 +1.2%, S&P 500 +0.8%, Dow +0.4%. The 2-year Treasury yield, which had hit a fresh 52-week high of 4.217% intraday Friday, is back down to 4.13% on the de-escalation — a 9-basis-point rally. The 10-year is at 4.42%, off 8 bps from Friday's peak. Gold gave back some of Friday's safe-haven bid; bitcoin is firmer.
Layered underneath the geopolitical theater is the data tape that arrived Friday morning. Core PCE for May printed at +3.4% year-over-year, up from +3.3% in April — the highest reading since November 2025. Headline PCE jumped to +4.1% from +3.8%, reflecting the early-June energy spike that the Iran deal subsequently unwound. The month-over-month core read was a more modest +0.18%, slightly below the +0.27% consensus, which is what allowed the bond market and gold to rally on Friday. But the year-over-year trajectory is, by any reasonable read, drifting away from the Fed's 2% target — not toward it.
Friday's tape compounded the macro picture with a single news headline that has broader implications. The New York Times reported that OpenAI is considering delaying its IPO until 2027 specifically because of SpaceX's poor post-IPO trading performance and the broader volatility in AI-related shares. SPCX, which closed Monday June 22 at roughly $177, is now indicated near $169 in pre-market on the OpenAI headline and the weekend escalation. The Tuesday June 16 brief's bear case on SPCX is being validated in slow-motion. Friday marked the Nasdaq Composite's fifth consecutive losing session — down 4.6% on the week. The S&P fell ~2% on the week. The Dow rose 0.6%. That weekly rotation pattern — defensive outperformance, tech weakness, energy bid, defense bid — is the centerpiece of today's Section 7.
Today is a quiet macro session into a holiday-shortened week. Tuesday delivers June Consumer Confidence at 10:00 a.m. and May JOLTS at 10:00 a.m. — plus Nike Q4 and Constellation Brands after-close. Wednesday brings ADP, Construction Spending, and ISM Manufacturing PMI. Thursday is the cleanest test: Nonfarm Payrolls release moved up from Friday to Thursday due to the Friday July 3 early-close ahead of Independence Day. Consensus: +135K. The market is closed Friday July 3 in observance of July 4.
2. MARKETS AT A GLANCE
U.S. EQUITY FUTURES (PRE-OPEN, POST DE-ESCALATION)
Asset
Last
Change
% Chg
S&P 500 (ES)
7,413
+59
+0.80%
Nasdaq 100 (NQ)
25,605
+304
+1.20%
Dow (YM)
52,085
+209
+0.40%
Russell 2000 (RTY)
2,355
+24
+1.03%
PRIOR CLOSE (FRIDAY, JUNE 26 — NASDAQ'S 5TH LOSING SESSION)
Asset
Last
Change
% Chg
S&P 500
7,354.02
-3.69
-0.05%
Nasdaq Composite
25,297.62
-61.00
-0.24%
Dow Jones Industrial Avg.
51,876.11
-44.51
-0.09%
Russell 2000
2,331.50
+5.30
+0.23%
VIX
20.80
+2.10
+11.2%
WEEKLY PERFORMANCE (WEEK OF JUNE 22-26)
Asset
Last
Change
% Chg
Dow Jones
51,876.11
+0.6% wk
Defensive lead
S&P 500
7,354.02
-2.0% wk
—
Nasdaq Composite
25,297.62
-4.6% wk
5-day losing streak
Russell 2000
2,331.50
-1.3% wk
—
RATES & FX — 2Y REVERSES 9 BPS FROM FRIDAY PEAK ON DE-ESCALATION
Asset
Last
Change
% Chg
UST 2-Year
4.13%
-9 bps from Fri peak
—
UST 10-Year
4.42%
-8 bps from Fri peak
—
UST 30-Year
4.91%
-4 bps from Fri
—
10-Yr TIPS (real)
2.12%
-6 bps
—
DXY (Dollar Index)
100.20
-0.35
-0.35%
EUR/USD
1.0695
+0.0040
+0.38%
USD/JPY
159.85
-0.55
-0.34%
COMMODITIES & CRYPTO — BRENT RETRACES FROM $91 PEAK TO $83.50
The weekend brought the sharpest geopolitical escalation since the original April outbreak of the Iran war. On Saturday morning, a drone strike on a commercial vessel transiting the Strait of Hormuz triggered a U.S. military response — strikes on Iranian surveillance infrastructure, communication systems, air defense sites, drone storage facilities, and minelayer capabilities. Saturday evening saw a second wave. On Sunday, Iran retaliated against the U.S. Ali Al Salem Air Base in Kuwait and the U.S. Fifth Fleet headquarters in Bahrain. By Sunday evening, Brent had spiked from $80.20 Friday close to $91.40. Then early Monday, both sides announced a halt to strikes and a resumption of peace talks in Doha this week. Brent has retraced to $83.50 — still elevated, but well off the peak. The Islamabad Memorandum signed June 17 is technically still in force; the 60-day ceasefire window remains the operative diplomatic framework. We continue to assign roughly 50% probability the broader deal holds through July, down from 60% last week.
Core PCE 3.4% Y/Y — But Soft M/M Allowed Markets to Rally
May Core PCE printed at +3.4% Y/Y on Friday morning, up from +3.3% in April — the highest level since November 2025. Headline PCE jumped to +4.1% from +3.8%. The month-over-month core read, however, was a softer +0.18% (versus +0.27% consensus), which is what allowed the bond market to rally and gold to spike. The bifurcation matters: the year-over-year trajectory is hawkish and validates Warsh's dot plot; the month-over-month pace is consistent with the energy-driven distortion finally moderating. Net read of the data: hawkish on direction, neutral on pace, asymmetric tail risk now resides in whether the Iran-deal energy unwind continues (deflationary) or reverses (inflationary). The weekend escalation suggests the latter risk is now meaningfully live.
OpenAI Reportedly Postpones IPO to 2027 — SPCX Hangover
The New York Times reported Friday that OpenAI is considering delaying its IPO until 2027 specifically due to SpaceX's poor post-IPO trading performance and the broader volatility in AI-related shares. SPCX, which traded as high as $177.99 on Monday June 22, has slipped to roughly $169 pre-market. The OpenAI delay would be the most significant shift in the pre-IPO tech calendar all year — the company had been broadly expected to file in Q3 2026 with a target valuation north of $500 billion. The decision validates the SPCX bear case we laid out in the June 16 brief: even at the peak of post-IPO euphoria, the orbital-AI valuation premium was embedded in a market structure that subsequent volatility could not sustain. Now the second-derivative implications matter — Anthropic, xAI, and other pre-IPO AI names face the same question OpenAI is reportedly answering today.
Nasdaq Closes 5-Day Losing Streak — Defensive Rotation Has Started
Friday marked the Nasdaq Composite's fifth consecutive losing session — a roughly 4.6% slide on the week. The S&P 500 fell 2.0%. The Dow Jones, by contrast, rose 0.6%. That rotation pattern — defensive outperformance, tech weakness, energy bid, defense bid — is the cleanest signal we have had all spring of a meaningful positioning shift. Today's Sector Spotlight walks through what is driving it and what it means for positioning into the holiday week. Three charts.
Friday's Core PCE print and the weekend's geopolitical activity have left the Fed path setup essentially unchanged from where we exited Wednesday post-FOMC. CME FedWatch shows December-hike odds at ~68% (down from ~72% pre-weekend on the Friday yield rally and de-escalation Monday). September-hike odds at ~30%. The median Wall Street view continues to anchor on one 25 bp hike by year-end as the base case, with two hikes the credible upside risk.
Fig. 1 — PCE inflation Y/Y trajectory. Both core (3.4%) and headline (4.1%) drifting away from the Fed's 2% target.
The PCE trajectory chart above is the most important macro framework for the current cycle. The Fed's 2% target was last achieved in late 2024 under Powell. Core PCE has now ticked up six consecutive months — modestly, but unambiguously in the wrong direction for the dual-mandate. That is precisely the data backdrop Warsh's dot-plot hawkish shift was anchored to. The June PCE print (releases late July) will be the first reading that incorporates the post-Iran-deal energy unwind in its m/m core; the trajectory question becomes whether core decelerates back toward 3.0% or continues drifting toward 3.6%.
Today's data calendar is quiet. The week's marquee event is Thursday's June Nonfarm Payrolls — moved up from Friday due to the July 3 early-close. Consensus +135K, unemployment 4.2%, AHE +0.3% m/m. The risk asymmetry: a hot print (>+180K) extends the hawkish setup and pushes the 10-year back above 4.50%; a soft print (<+100K) gives Warsh a politically convenient excuse to pause the hike-bias narrative ahead of the July 30-31 FOMC. We assign roughly 55% probability the print lands in the 110K-160K consensus range, 25% upside, 20% downside.
WHY YEAR-OVER-YEAR VS MONTH-OVER-MONTH INFLATION CAN DIVERGE
Friday's PCE release illustrated a recurring data interpretation challenge. The year-over-year reading (Core +3.4%, Headline +4.1%) compares a single month's price level to the same month one year earlier; it measures the cumulative inflation experience the consumer has felt over the past twelve months. The month-over-month reading (Core +0.18%, Headline ~+0.3%) measures the change between consecutive months; it is the cleanest short-term signal of inflation momentum. When the Y/Y is rising while the M/M is moderating — as happened Friday — the explanation is mathematical: the months falling OUT of the trailing 12-month calculation were even softer than the months coming IN. Base effects work in both directions, and over the next three months (June-August), the Y/Y is going to face increasingly easy comparison periods. That mechanically supports a slight Y/Y deceleration through Q3 — even if M/M momentum stays in the +0.2-0.25% range. Warsh's dot plot likely already prices this. The market's interpretation of individual prints, however, has been less mechanically careful — which is why we saw the gold rally Friday despite the hot Y/Y headline.
5. ECONOMIC CALENDAR — HOLIDAY-SHORTENED WEEK
Day
Time (ET)
Release
Consensus / Actual
Fri 6/26
8:30 AM
Core PCE (May) — released
+3.4% Y/Y; +0.18% M/M
Sat-Sun 6/27-28
All wknd
US-Iran strikes / de-escalation
Brent $80 → $91 → $83.50
Mon 6/29
Quiet
Dallas Fed Mfg
-12.0
Tue 6/30
10:00 AM
Consumer Confidence (Jun)
98.5
Tue 6/30
10:00 AM
JOLTS (May)
8.0M
Tue 6/30
After close
Nike (NKE) Q4
EPS $0.12
Tue 6/30
After close
Constellation Brands
—
Wed 7/01
8:15 AM
ADP Employment (Jun)
+125K
Wed 7/01
10:00 AM
ISM Manufacturing PMI
48.5
Wed 7/01
10:00 AM
Construction Spending
+0.1%
Thu 7/02
8:30 AM
NONFARM PAYROLLS — KEY
+135K / U-rate 4.2%
Thu 7/02
8:30 AM
Avg Hourly Earnings
+0.3% m/m
Thu 7/02
13:00
Early close (NYSE)
—
Fri 7/03
All day
Markets CLOSED — July 4 obs.
—
6. EARNINGS WATCH
Tuesday after close: Nike (NKE) Q4 — consensus EPS $0.12 on revenue decline 2-4%. Watch China commentary (running ~−20% Y/Y per pre-print guidance) and the tariff-refund disclosure that may flatter the headline. New CFO David Denton takes over August 17; CFO Matthew Friend running the Q4 call. Constellation Brands (STZ) also Tuesday after close — the cleanest read on the Hispanic consumer following the immigration policy environment.
Looking ahead: Q2 reporting season formally opens July 14 with JPMorgan, Wells Fargo, and Citigroup. The bank earnings will be the cleanest test of the steeper-curve thesis (NIM expansion) we have been carrying since the FOMC. Nvidia Q2 in early August remains the marquee AI event of the summer — with Micron's read-through making it materially more important than it appeared two weeks ago.
7. SECTOR SPOTLIGHT: THE DEFENSIVE ROTATION HAS STARTED — WHAT IT MEANS
Last week's tape produced the cleanest single-week defensive rotation signal we have seen all spring. Three discrete drivers stacked: (1) the hawkish FOMC of June 17, which pushed duration multiples lower; (2) the Core PCE Y/Y acceleration to 3.4% Friday, which reinforced the hawkish setup; (3) the Friday OpenAI IPO-delay headline and the broader concerns about post-SPCX AI valuation discipline. Layered on top, the weekend's Iran strikes provided geopolitical risk that the Iran-deal-priced market had not been positioned for. The result: the Dow up 0.6%, the S&P down 2.0%, the Nasdaq down 4.6%, defense ETFs up roughly 3.2%, energy ETFs up roughly 2.5%. That spread — Dow vs Nasdaq of roughly 5 percentage points in a single week — is among the widest defensive-rotation signals of the past two years.
Fig. 1 — Weekly performance breakdown. The cleanest defensive rotation signal of the spring.
Three observations to anchor positioning. First, the Dow's outperformance is not primarily a Boeing-or-Caterpillar story. It is the Dow's structural overweight to consumer-staples and pharma names (UNH, JNJ, MRK, PG, KO, MCD, WMT, V) that are less rate-sensitive AND less correlated to the AI-capex story. When the tape broadly rotates out of duration and out of AI, those names attract incremental flow. That is what happened last week. The cleanest single ETF expression of the rotation: XLP (consumer staples) up 1.9% on the week, XLV (healthcare) up 1.7%, versus XLK (technology) down 4.8%.
Fig. 2 — Brent's weekend round trip. $80 → $91 on US-Iran strikes → $83.50 on Monday morning de-escalation.
Second, the energy bid is real and likely sustainable for the next two to four weeks. Brent's round trip from $80 to $91 to $83.50 across 60 hours reflects how narrow the production margin in the Strait of Hormuz has become — and how quickly the geopolitical premium can be repriced. Even with the Monday de-escalation, the ceasefire's durability is now meaningfully less certain than it appeared a week ago. Energy equities (XLE +2.5% on the week, XOP +4.1%) have started to price the tail risk. The integrated majors (XOM, CVX) caught a bid Friday and overnight; the exploration and production names (FANG, EOG) outperformed. The right framework: treat energy as a 2-4 week tactical bid into the holiday window; reassess into the Doha talks resumption.
Third, the defense bid is more structural. The ITA (aerospace and defense ETF) rose 3.2% on the week. LMT, RTX, NOC, GD all rallied 2.5-4% Friday alone on the Iran-deal-fraying read. After the weekend's strikes, the case is stronger still. The U.S. defense budget for FY2027 is in active negotiation with explicit Iran-war-credit line items already discussed. The defense complex caught a tactical bid Friday and a fundamental bid over the weekend. We continue to favor LMT (the cleanest pure-play) and Booz Allen Hamilton (BAH — the cyber/intel angle that directly benefits from the kind of cyber-physical conflict the weekend exposed).
WHY DEFENSIVE ROTATIONS MATTER — AND HOW LONG THEY TYPICALLY LAST
A defensive rotation is the textbook signal of late-cycle positioning. The pattern shows up when investors no longer believe the growth multiple is sustainable AND the duration discount rate is rising. Both conditions are in place now. Historically, defensive rotations of the magnitude we saw last week (>4 percentage points of Dow-Nasdaq spread) tend to extend for 4-8 weeks before the market broadly re-engages with growth — assuming the macro tape stabilizes. If the macro deteriorates further (Iran escalates, NFP surprises hot, June CPI prints above +0.32%), the rotation can extend to 10-14 weeks and produce 10-15% Nasdaq drawdown from the prior peak. The Nasdaq is now down roughly 6.5% from its June 16 intraday high. A move to the 10% drawdown level would imply the Nasdaq Composite trading in the 24,200-24,400 range over the next three to six weeks. We are not calling for that. We are flagging it as a real possibility worth positioning around. The cleanest defensive playbook: trim AI-software with stretched multiples (NOW, ORCL, ADBE); maintain core in AI-power (CEG, VST, GEV, ETN) which has rate-resilience via contracted cash flows; add tactical exposure to defense (LMT, BAH) and integrated energy (XOM, CVX); maintain quality dividend in pharma (JNJ, MRK) and staples (PG, KO). Holding cash at 10-15% allocation makes sense into the NFP + ISM week and the holiday-shortened tape.
Our positioning tilt going into the holiday-shortened week. Maintain core in AI-power (CEG, VST, TLN, GEV, ETN, PWR) — the rotation does not threaten the contracted-cash-flow case. Reduce exposure to AI-software and high-multiple growth (trimming NOW, ORCL, ADBE on rallies). Add tactical defense (LMT, BAH) and integrated energy (XOM, CVX, XLE) on the geopolitical setup. Maintain Micron from last week's spotlight, but be patient on entry. Trim Japan-exposed positions on the BoJ-hike carry-trade overhang. Carry cash at 10-15% allocation through Thursday's NFP and Wednesday's ISM. Watch USD/JPY at 159.85 — Ministry of Finance intervention rhetoric remains live above 160.
8. ANALYST CALLS DRIVING ACTION
Upgrades / target hikes: Goldman raised LMT PT to $620 on the Iran-war-credit anticipation. Wells Fargo raised RTX to $185 and NOC to $640. Morgan Stanley reiterated Outperform on XOM at $135 PT. JPMorgan raised CEG to $480 on the AI-power-rotation read. Bernstein upgraded Booz Allen Hamilton (BAH) to Outperform with $185 PT.
Downgrades / target cuts: BofA cut ServiceNow (NOW) PT to $860 on the AI-software multiple-compression read. Goldman trimmed Adobe (ADBE) and Salesforce (CRM). Wedbush cut OpenAI-adjacent names. Citi cut SPCX to $145 on the OpenAI delay and broader AI-IPO fade.
9. STOCKS TO WATCH
LMT — Goldman PT $620. The cleanest pure-play on the Iran-war-credit FY27 budget cycle.
Booz Allen Hamilton (BAH) — Bernstein upgrade $185 PT. Cyber/intel angle.
RTX / NOC / GD — Defense majors; all caught the weekend bid.
XOM / CVX — Integrated majors; the cleanest energy hedge into Doha talks.
FANG / EOG — E&P leverage to the spread of Brent over $80.
MSFT / GOOGL — Citrini-preferred hyperscalers; less affected by OpenAI-delay headline.
Nike (NKE) — Reports tomorrow after close. China commentary is the swing factor.
SPCX — Citi cut to $145. The OpenAI-IPO-delay read-through is direct and material.
ServiceNow (NOW) / Adobe (ADBE) / Salesforce (CRM) — Under pressure on AI-software multiple compression.
Micron (MU) — Bought into pullbacks; $1,050-1,100 range is the target.
Gold (GLD) / Silver (SLV) — Multi-week tailwind on the defensive setup.
10. GLOBAL MACRO SNAPSHOT
Asia: A mixed-to-soft session as the weekend escalation weighed on sentiment, partially offset by Monday's de-escalation. Nikkei -0.32% on the yen weakness (USD/JPY 159.85) and BoJ-hike spillover. Hang Seng -0.16%. ASX flat. Korean and Taiwan semi names traded heavy on the OpenAI-delay read-through — Samsung -1.2%, TSMC ADR equivalent -1.6%, SK Hynix -2.4%. The supply-constrained-AI thesis from Wednesday's Micron print is still intact; the OpenAI IPO delay does not structurally change the demand picture but introduces sentiment headwinds.
Europe: Modestly positive on the de-escalation Monday and the lower yields. Stoxx 600 +0.12%, FTSE flat, DAX +0.12%. ECB watch: Lagarde speaks Wednesday at 9:30 a.m. ET, primary focus on whether the ECB tilts hawkish into the September meeting given the U.S. policy divergence.
Emerging markets: A relief bounce on the Monday de-escalation. India, Korea, Indonesia all firmer. China continues to struggle on property concerns. The dollar has eased modestly off Friday's peak (DXY 100.20), providing modest tailwind to the EM complex broadly.
11. WEEK AHEAD PREVIEW
Today: Quiet. Dallas Fed Mfg at 10:30. Doha talks resume — watch for headline risk.
Tuesday: Consumer Confidence + JOLTS at 10:00; Nike + Constellation after close.
Wednesday: ADP at 8:15; ISM Mfg + Construction Spending at 10:00. Lagarde speaks 9:30.
Thursday: NFP — KEY. Consensus +135K, U-rate 4.2%, AHE +0.3%. Early NYSE close at 13:00.
Friday: Markets CLOSED for July 4 observance.
Looking ahead: July 9 FOMC minutes (Warsh's first); July 11 June CPI; July 14 Q2 bank earnings open; August Nvidia Q2.
12. THE CLOSING THOUGHT
The first session of summer arrives with the macro picture meaningfully more complicated than the post-Iran-deal optimism of two weeks ago suggested. Core PCE is at 3.4% Y/Y and drifting away from target. The Iran ceasefire has been tested twice in 96 hours — Sunday's strikes were a more meaningful escalation than the Tuesday talks cancellation. The Nasdaq has logged five straight losing sessions. OpenAI is reportedly pushing its IPO into 2027. And we head into a holiday-shortened week with NFP moved up to Thursday and the market closed Friday. The defensive rotation that took shape last week is real and, on every fundamental metric we use, likely to extend. We continue to favor the core long thesis — AI-power and physical-AI picks-and-shovels, Citrini-preferred hyperscalers MSFT and GOOGL, and Micron on pullbacks — but we are adding tactical defense and integrated energy exposure for the next two to four weeks. We are carrying cash at elevated allocation into Thursday's NFP. The Iran ceasefire is the biggest unknown; the data tape is the biggest known. Both are pulling in the same direction this week. Trade carefully — we will be back Tuesday morning with the post-Doha-talks read.
THE BROOKSIDE BRIEF · COMPILED 9:30 AM ET · SOURCES: BEA (PCE RELEASE JUNE 26), CNBC / THESTREET (WEEKLY CLOSES), AL JAZEERA / CNN / NPR (IRAN STRIKES), NYT (OPENAI IPO DELAY), ICE BRENT FUTURES, CME FEDWATCH, TREASURY H.15, BIGDATA.COM, ASCHENBRENNER 'SITUATIONAL AWARENESS', CITRINI RESEARCH
MORNING EDITION · WEDNESDAY, JULY 1, 2026 · Q2 = BEST SINCE 2020 · H1 CLOSED · VIX 17.9
Daily Markets Briefing
The Brookside Brief
Markets · Macro · The Day Ahead
1. THE MORNING SETUP
Good morning, and welcome to the first day of the second half of 2026. Tuesday's close brought the second-quarter book to a decisive finish: the S&P 500 rose 0.79% to 7,449.36, the Nasdaq Composite jumped 1.52% to 26,213.72, the Dow added 0.26% to 52,319.20. All three indexes recovered essentially all of the June 20-26 defensive-rotation selloff we walked through Monday. More significantly: Q2 2026 ended as the best quarter since the pandemic-era recovery of 2020. The S&P rallied more than 14%, the Nasdaq soared roughly 20%, the Dow added over 12%. Semiconductors (SOX) led everything at +26%, driven by Micron's supply-constrained thesis, Nvidia's sustained run, and the AI-capex validation we walked through last week.
The Monday-Tuesday recovery had two proximate drivers. First, the U.S.-Iran de-escalation held through Tuesday, with reports Monday evening confirming that commercial vessels are again transiting the Strait of Hormuz freely. Oil settled sharply lower — WTI at $73.85 this morning, Brent at $76.20, essentially back to pre-weekend-strike levels. Envoy Witkoff arrived in Doha overnight for technical talks; Iran's negotiator Kazem Gharibabadi told press yesterday that Tehran had 'not confirmed' the technical meeting, but the tone was materially less confrontational than the weekend rhetoric. Second, Tuesday's JOLTS print at 10:00 a.m. — job openings at 7.594 million versus 7.3M consensus — reinforced the resilient-labor thesis without pushing yields materially higher. The 10-year drifted to 4.39%; the 2-year to 4.10%.
Nike reported after Tuesday's close and did something unusual: the company delivered an EPS number ($0.72 versus $0.13 consensus) that qualifies as one of the largest beats of the current earnings cycle — and the stock fell 2.66% in extended trading. The reason: China revenue dropped 12% year-over-year to $1.30 billion, and management guided fiscal 2027's first half to 'flattish' earnings. CEO Elliott Hill's characterization that Nike remains 'fully committed to winning' the China market back was not sufficient reassurance for the buy-side. The read is important: even a meaningful bottom-line beat cannot save a stock when the forward guidance and China trajectory disappoint. Nike is now indicated down 3% pre-market.
Today's agenda is packed. At 8:15 a.m. ET, ADP employment (consensus +118K). At 10:00 a.m., ISM Manufacturing PMI (consensus 53.8) and construction spending. At 10:30 a.m., EIA crude oil inventories (consensus −4.8M barrels). And most distinctively — a unique four-central-bank panel at the ECB Forum in Sintra: Fed Chair Warsh, ECB President Lagarde, BoE Governor Bailey, and BoC Governor Macklem will share a stage. It is the first time all four have appeared together publicly. The panel begins at 9:30 a.m. ET. Any signal from Warsh on Q3 rate-path expectations or from Lagarde on the September ECB meeting will move markets meaningfully. Then Thursday at 8:30 a.m. — NFP, moved up from Friday due to the July 4 close. Consensus +135K, unemployment 4.2%.
Given the first day of a new half-year, today's Sector Spotlight steps back to review what worked in H1 2026 and construct the H2 playbook. Three charts. The positioning framework we have been building — AI-power core, physical-AI supplements, tactical defense, Micron on pullbacks — is validated by the H1 data. The question is whether the setup extends through summer or whether the second half needs a meaningful rewrite.
2. MARKETS AT A GLANCE
U.S. EQUITY FUTURES (PRE-OPEN, INTO ADP + ISM)
Asset
Last
Change
% Chg
S&P 500 (ES)
7,443
-6
-0.08%
Nasdaq 100 (NQ)
26,175
-40
-0.15%
Dow (YM)
52,270
-50
-0.10%
Russell 2000 (RTY)
2,378
-3
-0.13%
PRIOR CLOSE (TUESDAY, JUNE 30 — Q2 END, BEST QUARTER SINCE 2020)
Asset
Last
Change
% Chg
S&P 500
7,449.36
+58.61
+0.79%
Nasdaq Composite
26,213.72
+392.44
+1.52%
Dow Jones Industrial Avg.
52,319.20
+135.75
+0.26%
Russell 2000
2,381.30
+18.60
+0.79%
VIX
17.90
-2.90
-13.9%
Q2 2026 PERFORMANCE — BEST SINCE 2020 PANDEMIC RECOVERY
Asset
Last
Change
% Chg
SOX (Phila Semis)
—
+26.0% Q2
Micron / Nvidia led
Nasdaq Composite
26,213.72
+20.0% Q2
AI-driven
S&P 500
7,449.36
+14.0% Q2
Broad rally
Dow Jones
52,319.20
+12.0% Q2
Solid participation
Russell 2000
2,381.30
+8.5% Q2
Modest lag
RATES & FX — YIELDS MODESTLY LOWER ON JOLTS + DE-ESCALATION
Asset
Last
Change
% Chg
UST 2-Year
4.10%
-3 bps from Mon
—
UST 10-Year
4.39%
-3 bps
—
UST 30-Year
4.88%
-3 bps
—
10-Yr TIPS (real)
2.09%
-3 bps
—
DXY (Dollar Index)
100.10
-0.10
-0.10%
EUR/USD
1.0710
+0.0015
+0.14%
USD/JPY
159.20
-0.65
-0.41%
COMMODITIES & CRYPTO — OIL BACK TO PRE-STRIKE LEVELS
Asset
Last
Change
% Chg
WTI Crude (Aug)
$73.85
-$7.00 vs Sun peak
De-escalation
Brent Crude (Aug)
$76.20
-$15.20 vs Sun peak
De-escalation
Gold (spot)
$2,058
-$24
-1.15%
Silver (spot)
$20.65
-$0.75
-3.51%
Bitcoin
$86,800
+$1,400
+1.64%
ASIA & EUROPE (INTRADAY)
Asset
Last
Change
% Chg
Nikkei 225
39,250
+455
+1.17%
Hang Seng
21,780
+295
+1.37%
Shanghai Composite
3,182
+24
+0.76%
Stoxx Europe 600
569.20
+3.10
+0.55%
FTSE 100
8,850
+35
+0.40%
DAX
20,455
+70
+0.34%
3. TOP STORIES
Q2 2026 Closes as Best Quarter Since 2020 — Semis +26%, Nasdaq +20%
Tuesday's session sealed a Q2 for the record books. The S&P 500 gained 14% in the quarter, the Nasdaq Composite rose 20%, the Dow added 12% — all three the best quarterly performance since the pandemic-recovery Q2 of 2020. Under the hood, semiconductors led (SOX +26%), with Micron delivering the anchor print June 24 that validated the supply-constrained AI-compute thesis. The AI-power complex (CEG, VST, TLN) posted quarterly returns near 30% cumulatively; physical-AI names (SYM, CGNX, TER) rallied 20-25% cumulatively. The rally survived the FOMC's June 17 hawkish surprise, the Iran-deal fraying, the June 20-26 defensive rotation, the weekend escalation, and now looks broadly intact heading into the second half.
JOLTS at 7.594M — Hot Print, Hawkish Read
May job openings printed at 7.594 million on Tuesday, well above the 7.3M consensus and a fresh two-year high. The print reinforces the resilient-labor picture that has underwritten Warsh's hawkish dot plot. The bond market absorbed the print without a meaningful yield reaction — 2-year yields held near 4.10%, 10-year at 4.39% — suggesting the strong labor tape is already priced into the hike-bias narrative. Wednesday's ADP (consensus +118K) and Thursday's NFP (consensus +135K) will confirm or challenge the read. A hot labor week (>+180K on either measure) extends the hawkish setup meaningfully.
Nike EPS Beat, Stock Falls — China −12% and Flattish FY27H1 Guide
Nike reported Q4 FY26 after Tuesday's close with revenue of $11.0 billion (down 1% reported, down 4% currency-neutral), adjusted EPS of $0.72 versus $0.13 consensus. Nike Direct revenue fell 7% Y/Y; Wholesale rose 4%. The China number was the problem: Greater China revenue dropped 12% Y/Y to $1.30 billion. Management's forward guidance — 'flattish' earnings through fiscal 2027's first two quarters — was viewed as insufficient given the setup. CEO Elliott Hill said the company is 'fully committed to winning' the China market back. Stock indicated down 3% pre-market. Full-year fiscal 2026 revenue: $46.4B, essentially flat.
The Monday de-escalation announcement has held through Tuesday. Commercial vessels are again moving freely through the Strait of Hormuz. Envoy Witkoff arrived in Doha overnight; Iran's Kazem Gharibabadi told press the technical talks were 'not confirmed' but the tone was materially less confrontational than the weekend rhetoric. Oil retraced fully: WTI to $73.85, Brent to $76.20 — essentially back to pre-weekend-strike levels. Israel warned separately that war could resume 'within two days' if the ceasefire is violated. Fragile is the correct characterization. We continue to assign roughly 55% probability the broader deal holds through July, up from 50% Monday but well below the 60% post-Geneva signing.
Historic 4-Central-Bank Panel at ECB Forum Today
The ECB Forum in Sintra features an unusual event today: a panel discussion at 9:30 a.m. ET including Fed Chair Kevin Warsh, ECB President Christine Lagarde, BoE Governor Andrew Bailey, and BoC Governor Tiff Macklem. It is the first time all four have shared a stage publicly. Warsh's commentary will focus on the Q3 rate-path setup; Lagarde's on the September ECB meeting and the euro area outlook; Bailey's on the U.K. gilt tape; Macklem's on Canada's parallel labor-market dynamics. The signal risk is meaningful — a hawkish tilt from any of the four extends the strong-dollar / weak-EM tape; a coordinated dovish signal (unlikely but possible) unwinds meaningful chunks of the Q2 duration selloff.
4. MACRO & FED WATCH
The macro setup entering H2 is characterized by two competing forces we have been tracking for weeks. The resilient-labor-plus-firm-consumer picture supports Warsh's hawkish dot plot: JOLTS at 7.59M, initial claims at 226K, retail sales +0.9%, Q1 GDP final at +2.1%. Against that, the disinflation trajectory has slowed but not reversed: Core PCE at 3.4% Y/Y with M/M momentum at +0.18%. The Fed's implicit constant-inflation-forecast decomposition suggests one 25 bp hike by year-end remains the credible base case; two hikes are the realistic upside; no hikes requires a meaningful softening in either the labor tape or the disinflation pace.
Today's ADP print at 8:15 is the marquee data event before Warsh's 9:30 panel. Consensus 118K — softer than the recent 6-month average of 145K. A print in-line or soft would tee up a modestly less hawkish Warsh tone at the panel. An upside surprise (>+150K) would push yields higher into the panel and probably force Warsh to lean more explicitly into the hike-bias framework. The ISM Manufacturing PMI at 10:00 a.m. (consensus 53.8) is the second-most-watched print — a soft print would reinforce the disinflationary pace read, a hot print extends the hawkish setup.
The ECB Forum panel is a distinctive communication event. Warsh has now had two weeks since his first FOMC to receive market feedback on his approach — the dropped forward guidance, the five task forces, the meeting-by-meeting framing. We expect his panel commentary to reiterate the framework while offering more specific commentary on the data-dependent path. Lagarde's tone will matter — she has been notably data-dependent in her recent press conferences, and any hawkish tilt from her would be a genuine surprise given the euro-area's growth constraints. Bailey and Macklem are lower-impact for the U.S. tape but matter for GBP and CAD respectively.
5. ECONOMIC CALENDAR — TODAY AND REST OF WEEK
Day
Time (ET)
Release
Consensus / Actual
Mon 6/29
AM
US-Iran de-escalation held
Brent $80 → $76
Tue 6/30
10:00 AM
JOLTS (released)
7.594M ✓ HOT (vs 7.3M)
Tue 6/30
Close
Q2 close
Best qtr since 2020
Tue 6/30
After close
Nike Q4 (released)
EPS $0.72 beat; stock -3% AH
Wed 7/01
7:15 AM
ADP Employment (Jun)
+118K
Wed 7/01
9:30 AM
4-CB Panel — Warsh + Lagarde
Sintra ECB Forum
Wed 7/01
10:00 AM
ISM Manufacturing PMI
53.8
Wed 7/01
10:00 AM
Construction Spending
+0.1%
Wed 7/01
10:30 AM
EIA Crude Inventories
-4.8M bbl
Thu 7/02
8:30 AM
NONFARM PAYROLLS — KEY
+135K / U-rate 4.2%
Thu 7/02
8:30 AM
Avg Hourly Earnings
+0.3% m/m
Thu 7/02
13:00
Early NYSE close
—
Fri 7/03
All day
Markets CLOSED — July 4 obs.
—
6. EARNINGS WATCH
The calendar is essentially light today ahead of Q2 reporting season opening July 14 with the big banks. Constellation Brands (STZ) reported Tuesday after close along with Nike — the STZ print was in-line with a cautious consumer commentary but no material stock reaction. Micron's supply-constrained AI-compute read remains operative for the semis complex; Nvidia's Q2 in early August is the marquee event.
Nike's read-across matters for the broader consumer-discretionary complex. The China revenue weakness combined with 'flattish' FY27H1 guidance suggests that (a) the high-end consumer is deferring purchases on rates and (b) the U.S.-China trade tape remains a structural drag on U.S. multinationals with Greater China exposure. LULU, UAA, and BROS all indicated softer pre-market on the read. On the other side of the consumer tape, Costco (COST) and Walmart (WMT) — with more domestic-focused sales bases — are little changed pre-market and remain defensive-rotation beneficiaries.
7. SECTOR SPOTLIGHT: H1 2026 REVIEW AND THE H2 PLAYBOOK
The first half of 2026 has been one of the most instructive market environments in recent memory — for anyone paying attention to the data, the rotation signals, and the connections between macro and micro. Today we take advantage of the natural reset point to review what worked in H1 and to construct the framework for H2. Three charts.
Fig. 1 — Quarterly returns by index. Q2 was the best quarter since 2020, with Nasdaq +20% and SOX +26%.
The Q1 vs Q2 chart above tells the first-order story. Q1 was a challenging tape — all major indexes ended the quarter modestly negative, with semis (SOX) down 4.5% on early-year AI-demand-questioning and DeepSeek-style headline risk. Q2 was the recovery: the S&P added 14%, the Nasdaq 20%, semis 26%. The single most important catalyst was the June 24 Micron print, which validated the supply-constrained AI-compute thesis and pushed the AI-capex framework decisively in the Aschenbrenner direction. The June 20-26 defensive rotation is now essentially unwound in the aggregate index numbers, though the sector composition of the recovery matters — the Nasdaq's Tuesday +1.52% was concentrated in semis, not broadly in AI-software.
The winner-and-loser chart in Fig. 2 is where the real positioning lessons come through. The AI-power complex (CEG, VST, TLN) closed H1 up roughly 58% cumulatively — the single dominant theme of the year so far, and the framework we have been carrying since May. Physical-AI names (SYM, CGNX, TER) closed up 42% on the physical-buildout thesis. Semis (SOX) up 22%. Nvidia +38%, Micron +45%. Defense (ITA) up 18% — better than S&P 500, driven by the Iran-war-credit anticipation. S&P 500 up 12% total. On the losing side: AI-software (NOW, ORCL, ADBE composite) down 4% as the multiple-compression thesis played out. SPCX down 5% since the June 12 debut. Homebuilders (DHI, LEN, KBH) down 8% on the rate move. Notably: consumer-staples with stretched multiples (WMT, COST) closed roughly flat despite the Kroger read-across, telling us that the defensive rotation of late June was genuinely rotational rather than compositionally selective.
Fig. 2 — H1 2026 winners and losers. AI-power +58% led everything; homebuilders down 8%.
THE H1 LESSONS — WHAT WORKED AND WHY
Three lessons from the H1 tape that we carry into H2. First, physical constraints matter more than software valuations. AI-power (CEG, VST) works because the electrical grid is a genuine bottleneck on the hyperscaler capex ramp; the contracted-cash-flow structure means the multiple expansion is grounded in visible revenue. Physical-AI (SYM, CGNX) works for the same reason — automation deployment is a physical process, not a software-only pattern. Semis work because the HBM supply is genuinely sold out through 2027. Second, customer concentration is riskier than most models price. Marvell's 5.2% drop June 23 on the BofA rate note was direct evidence of what happens when a name with 70% concentration in three hyperscalers faces macro headwinds. Broadcom's diversification (network, communications, semi custom) is preferred structurally within the same complex. Third, defensive rotations end faster than they look. The June 20-26 rotation unwound in two sessions Monday and Tuesday. Investors who de-risked aggressively into the June 27-28 escalation missed the Tuesday recovery. The framework: trim on signal, don't liquidate — and be willing to add back quickly when the rotation exhausts.
For H2, the framework we recommend is the following — walk through it carefully because we are still positioned constructively but with more defensive weight than in Q2. Core positioning around AI-power (CEG, VST, TLN, GEV, ETN, PWR) at roughly 22% aggregate portfolio weight. Physical-AI picks-and-shovels (SYM, CGNX, TER) at 16%. Defense (LMT, BAH, RTX, NOC) at 12% — up from 8% in Q2 given the Iran tail risk. Micron on pullbacks (buyers $1,050-1,100 range) at 10%. Integrated energy (XOM, CVX, plus a small XLE overlay) at 10%. Cash and cash equivalents at 12%. The balance (18%) rounds into quality dividend (JNJ, MRK, PG, KO) plus the AI-adjacent hyperscalers we prefer (MSFT, GOOGL). We remain cautious on AI-software with stretched multiples (NOW, ORCL, ADBE), avoid duration ahead of the Warsh hike-bias, and continue to trim Japan-exposed positions on the BoJ-hike carry-trade overhang.
Three catalysts to watch that could force a rewrite of the H2 framework. First, Nvidia Q2 in early August — with the Micron read-through, this is materially more important than it appeared a month ago; a disappointing print would compress the entire AI-semi complex. Second, the July 11 June CPI — a hot print (>+0.32% core M/M) meaningfully changes the rate path and would compress duration further. Third, the Iran ceasefire durability through Q3 — the June 28 escalation demonstrated the tail risk is real; a second escalation cycle would push oil back to $90+ and damage the disinflation glide path meaningfully. We will revisit the H2 framework after each of these events.
8. ANALYST CALLS DRIVING ACTION
Upgrades / target hikes: Goldman raised Micron (MU) PT to $1,500 post-print. JPMorgan raised MSFT to $610. Morgan Stanley raised Constellation Energy (CEG) to $495. Bernstein raised BAH to $195 (up from $185 Monday). Wells Fargo raised LMT to $625.
Downgrades / target cuts: BofA cut Nike (NKE) PT to $58 on the China guidance. Morgan Stanley trimmed Lululemon (LULU) on the Nike read-across. Wedbush cut several pre-IPO AI proxies on the OpenAI-delay overhang. Citi maintained the $145 PT on SPCX from Monday.
9. STOCKS TO WATCH
Micron (MU) — Goldman PT $1,500. Buyers in pullbacks to $1,050-1,100.
Nvidia (NVDA) — August Q2 the marquee event; JPM $185 reiterated.
Booz Allen (BAH) — Bernstein PT $195. Cyber/intel exposure.
XOM / CVX — Integrated energy; tactical bid into Doha uncertainty.
Nike (NKE) — BofA cut PT to $58. China -12% is the headline problem.
NOW / ORCL / ADBE — Continue to trim AI-software multiple-compression names.
SPCX — Citi PT $145. OpenAI IPO delay overhang persists.
USD/JPY at 159.20 — Watch 162 for MoF intervention.
TLT — Cautious; ADP + ISM today are binary catalysts.
10. GLOBAL MACRO SNAPSHOT
Asia: A constructive session on the de-escalation Tuesday. Nikkei +1.17%, Hang Seng +1.37%, Shanghai +0.76%. The Micron / Q2-end rally lifted every name in the global semi supply chain — Samsung +2.8%, TSMC ADR equivalent +2.3%, SK Hynix +3.4%. The yen firmed modestly to 159.20 as the Fed panel today creates the potential for additional policy divergence rhetoric.
Europe: Modestly positive on the de-escalation. Stoxx 600 +0.55%. All eyes on the 9:30 a.m. ET central-bank panel — Lagarde's tone is the key European variable. If she hints at pushing the September easing back to October or December, EUR/USD extends the recent range up to 1.075; if she tilts more dovish, the euro softens back toward 1.065.
Emerging markets: A relief bounce day-two. India +0.5%, Korea +1.9%, Indonesia +1.2%. China (Shanghai) +0.76% recovering from the property-sector overhang. The dollar softened modestly to DXY 100.10 — providing tailwind to EM broadly.
11. WEEK AHEAD PREVIEW
Today: ADP at 7:15; 4-CB panel 9:30; ISM Mfg + construction at 10:00; EIA at 10:30.
Thursday — KEY: NFP at 8:30; early NYSE close 13:00.
Friday: Markets CLOSED for July 4 observance.
Looking ahead: July 9 FOMC minutes (Warsh's first); July 11 June CPI; July 14 Q2 bank earnings open with JPM/WFC/C; early August Nvidia Q2.
12. THE CLOSING THOUGHT
H1 2026 is in the books, and by every measure that matters — quarterly index returns, sector participation, thematic validation, macro-policy clarity — the first half broadly worked. The AI-compute thesis has been validated by Micron's supply-constrained tape. The AI-power thesis has been validated by 58% cumulative returns in the core complex. The physical-AI thesis has been validated by 42% returns in specialty automation. The defensive positioning we added in the June 20-26 rotation window has been rewarded as the de-escalation held. Q2 was the best quarter since 2020. And yet, entering H2, we are more cautious than we were entering Q2 — because the setup requires more work now than it did three months ago. The macro tape is meaningfully hawkish; the labor market is resilient; the Iran ceasefire is fragile; the AI-capex thesis has to now deliver actual revenue in Q3 and Q4 to justify the multiples. We are carrying more cash, more defense, more integrated energy — while maintaining the core AI-thesis exposure that delivered H1. Today's four-central-bank panel and Thursday's NFP will set the tone for the July 30-31 FOMC. Trade carefully — and enjoy the extended weekend.
THE BROOKSIDE BRIEF · COMPILED 9:30 AM ET · SOURCES: CNBC / THESTREET (JUNE 30 CLOSE, Q2 SUMMARY), BLS (JOLTS RELEASE), NIKE IR (Q4 FY26 RELEASE), CNN / FOX / ABC (IRAN UPDATES), ECB (FORUM PANEL), CME FEDWATCH, TREASURY H.15, ASCHENBRENNER 'SITUATIONAL AWARENESS', CITRINI RESEARCH
MORNING EDITION · MONDAY, JULY 6, 2026 · NFP +57K MISS · SPCX JOINS NASDAQ-100 TUE · VIX 17.2
Daily Markets Briefing
The Brookside Brief
Markets · Macro · The Day Ahead
1. THE MORNING SETUP
Good morning, and welcome to the first trading session of Q3. Thursday's June NFP print delivered the softest reading in four months — payrolls added only 57,000 jobs versus the +113,000 consensus, breaking a three-month streak of upside surprises. The unemployment rate ticked DOWN to 4.2%, but that headline is misleading: the labor force participation rate fell 0.3 percentage points to 61.5%, the lowest since March 2021. In other words, the participation slump did the arithmetic work on the unemployment rate — not incremental hiring strength. Average hourly earnings rose 0.3% m/m and +3.5% Y/Y, in line with expectations.
The market reaction on Thursday's session was the story worth internalizing. Under a classic 'bad news is good news' framework, a soft NFP that reinforces the case for a Fed hold would drive equities broadly higher and yields lower. What actually happened was more selective: the Dow Jones Industrial Average rallied 1.1% to another all-time high; the S&P 500 slipped 0.2% to 7,483.23; the Nasdaq Composite fell 0.8%. Tech was the worst sector on the session (XLK -2.6%), driven by continued semi weakness — Nvidia, Marvell, and Broadcom all closed in the red. Tesla notably sank on the day. Communication services and financials led the advance. The rotation we called out in the H2 playbook Wednesday is not abating; it is accelerating.
Layered on top of the domestic tape is a distinctive Iran picture. Vice President Vance said Wednesday-through-Friday that the indirect Doha talks — held through Pakistani and Qatari mediators, at deputy-foreign-minister level rather than principal-to-principal — are 'going well.' Iran's Kazem Gharibabadi met with Qatar's Prime Minister to discuss formalizing the tentative Iran-U.S. agreement. Key elements now being reportedly negotiated include a US$300 billion reconstruction plan for Iran, the process for lifting sanctions, and the inspection framework for Iran's nuclear programme. The 60-day formal window (extendable by mutual consent) established in the June 17 Islamabad Memorandum remains the operative timeline. Oil settled at $70.85 WTI, $73.20 Brent — reflecting the measured-progress read from the weekend.
The single most important market event this week is not the NFP-driven rotation or the macro backdrop. It is the SpaceX (SPCX) fast-track inclusion in the Nasdaq-100 Index — effective for trading Tuesday morning, July 7. Index-tracking funds and other product sponsors will begin purchasing SPCX shares AFTER the market close today. The passive flow required to build the required position sizes across the Nasdaq-100 tracker complex is the largest single-name passive event of the year to date. Today's Sector Spotlight walks through the math and what it means for the SPCX bear case we have been tracking since the June 16 brief.
Today's data calendar is quiet in the U.S. session. The ISM Services PMI at 10:00 a.m. ET (consensus 51.8) is the marquee data event; a soft print would extend the labor-cooling narrative, a hot print would complicate the dovish-NFP setup. Wednesday brings the FOMC Minutes at 2:00 p.m. — Warsh's first — and the June CPI arrives Friday morning. Q2 earnings season formally opens July 14 with the big banks. Nvidia Q2 remains the marquee AI event of early August.
2. MARKETS AT A GLANCE
U.S. EQUITY FUTURES (PRE-OPEN, POST-HOLIDAY)
Asset
Last
Change
% Chg
S&P 500 (ES)
7,479
-5
-0.07%
Nasdaq 100 (NQ)
26,050
-45
-0.17%
Dow (YM)
52,890
+185
+0.35%
Russell 2000 (RTY)
2,398
+8
+0.34%
PRIOR CLOSE (THURSDAY, JULY 2 — DOW TO NEW RECORD, NASDAQ OFF)
Asset
Last
Change
% Chg
S&P 500
7,483.23
-16.13
-0.20%
Nasdaq Composite
25,957.00
-208.90
-0.80%
Dow Jones Industrial Avg. (record)
52,895.60
+575.30
+1.10%
Russell 2000
2,392.60
+11.30
+0.47%
VIX
17.20
-0.70
-3.91%
RATES & FX — DOLLAR SOFTENED ON NFP MISS
Asset
Last
Change
% Chg
UST 2-Year
4.02%
-8 bps from Wed
—
UST 10-Year
4.32%
-7 bps
—
UST 30-Year
4.81%
-7 bps
—
10-Yr TIPS (real)
2.03%
-6 bps
—
DXY (Dollar Index)
99.65
-0.45
-0.45%
EUR/USD
1.0745
+0.0035
+0.33%
USD/JPY
158.20
-1.00
-0.63%
COMMODITIES & CRYPTO
Asset
Last
Change
% Chg
WTI Crude (Aug)
$70.85
-$3.00 vs Wed
Doha progress
Brent Crude (Aug)
$73.20
-$3.00 vs Wed
Doha progress
Gold (spot)
$2,108
+$50 wk
Broke 4-wk losing streak
Silver (spot)
$21.20
+$0.55 wk
—
Bitcoin
$88,900
+$2,100 wk
+2.4% wk
ASIA & EUROPE (INTRADAY)
Asset
Last
Change
% Chg
Nikkei 225
39,750
+250
+0.63%
Hang Seng
22,150
+385
+1.77%
Shanghai Composite
3,215
+35
+1.10%
Stoxx Europe 600
572.40
+3.20
+0.56%
FTSE 100
8,905
+52
+0.59%
DAX
20,590
+140
+0.68%
3. TOP STORIES
June NFP Misses at +57K — Softest Print in 4 Months, U-Rate Fell for the Wrong Reason
The June NFP release Thursday morning delivered a materially softer print than consensus expected. Payrolls added only 57,000 jobs versus the +113,000 Dow Jones estimate — the weakest reading in four months and a decisive break from the three-month streak of upside surprises. The May print was revised DOWN to +129K from higher. The unemployment rate fell to 4.2% from 4.3%, but the mechanics were unfavorable: the labor force participation rate fell 0.3 percentage points to 61.5%, the lowest reading since March 2021. Fewer people looking for work — not more people finding it — drove the U-rate lower. Under the hood, professional and business services added 36K, social assistance 25K, healthcare 22K. Leisure and hospitality DECLINED by 61K, reflecting weaker-than-usual summer seasonal hiring patterns. Average hourly earnings rose 0.3% m/m and +3.5% Y/Y.
Dow Notches Record; Nasdaq -0.8% as Rotation Accelerates
Thursday's session produced one of the widest single-day Dow-Nasdaq spreads of the year. The Dow Jones Industrial Average rallied 1.1% to another all-time high at 52,895.60. The S&P 500 fell 0.2% to 7,483.23. The Nasdaq Composite dropped 0.8% to 25,957.00. XLK (technology sector ETF) closed down 2.6% — the worst-performing sector by a wide margin. Tesla was notable to the downside; semis extended their post-Micron-print consolidation. The dovish NFP arithmetic ought to have supported growth multiples via lower yields (2-year fell 8 bps to 4.02%, 10-year fell 7 bps to 4.32%). Instead, the tape rotated further out of tech and into cyclicals, financials, and defensives. The defensive-rotation narrative from H1 continues to extend rather than fade — a meaningful positioning signal.
SPCX Joins Nasdaq-100 Tomorrow — Passive Flow Begins Today After Close
SpaceX (SPCX) becomes an official member of the Nasdaq-100 Index effective for trading tomorrow morning, Tuesday July 7. Nasdaq's index committee confirmed the fast-track inclusion Wednesday afternoon following the standard 15-day post-IPO eligibility review. The mechanics: index-tracking funds and other product sponsors will begin purchasing SPCX shares in the aftermarket TODAY, immediately following the 4:00 p.m. ET close. The total addressable passive-flow demand across the full Nasdaq-100 tracker complex — QQQ, QQQM, ONEQ, TQQQ, and the smaller sub-family products — is approximately $390 billion of AUM. At an initial SPCX index weight estimated in the 1.4-1.6% range, that implies roughly $5.5-6.2 billion of passive-buying demand that must be built across the next few sessions. Section 7 walks through the math and the historical Nasdaq-100 inclusion effect.
The indirect Doha talks — held through Pakistani and Qatari mediators, with Deputy Foreign Minister Kazem Gharibabadi as Iran's principal — appear to be progressing. Vice President Vance told reporters over the weekend that talks are 'going well,' though he cautioned it is 'still pretty early.' Iran and the U.S. are reportedly discussing a US$300 billion reconstruction plan for Iran, the process for lifting sanctions, and the inspection framework for Iran's nuclear programme. The 60-day formal window established in the June 17 Islamabad Memorandum remains operative. Oil is at $70.85 WTI, $73.20 Brent — down roughly $3 from Wednesday's mid-session levels. The de-escalation is holding but the tail risk of another escalation cycle remains meaningful. We continue to assign roughly 55% probability the broader deal holds through July.
Warsh Debuts at Sintra — 'Data-Dependent' Framework Restated
Fed Chair Warsh made his central-bank-forum debut Wednesday alongside Lagarde, Bailey, and Macklem at the ECB Forum in Sintra. His panel commentary reinforced the framework laid out at the June 17 press conference: no forward guidance, meeting-by-meeting decisions, task-force-driven institutional reform. On the specific question of the rate path, Warsh was deliberately non-committal — 'the data will tell us' remains the operative rhetorical framing. Lagarde signaled the ECB is 'monitoring' the U.S. policy divergence but did not commit on the September meeting path.
The soft NFP fundamentally changes the near-term Fed path debate, though not by as much as an initial glance might suggest. Fed-funds futures pricing shifted modestly dovish post-print: CME FedWatch now shows December-hike odds at ~55% (down from ~70% pre-print), September-hike odds at ~15% (essentially unchanged). The hike bias remains the base case but is now less confident. A hot June CPI on Friday would re-tighten the market's pricing meaningfully; a soft CPI would extend the dovish repricing.
Fig. 1 — Monthly NFP prints. June +57K broke the 3-month hot streak and is the softest print since February.
The labor-force-participation number in Thursday's release deserves specific attention because it complicates the standard 'labor market cooling' narrative. Participation at 61.5% is the lowest since March 2021 — a period of pandemic-specific dynamics that few economists want to see recreated in the current cycle. The decline is not primarily demographic (the aging-baby-boomer story that has been operative for 15 years). It is concentrated in prime-age workers, particularly prime-age males, whose participation dropped 0.4 pp in the month. That signals something more concerning than a soft-landing — a potentially structural loss of labor supply that could support wage inflation even as job growth slows. If Wednesday's FOMC minutes reveal that Warsh and colleagues were more worried about this dynamic at the June meeting than his press conference suggested, the framework flips: hikes still on the table because supply-side inflation is unresolved.
Wednesday's 2:00 p.m. FOMC minutes are the most important read of the week. This is the first minutes release under Warsh — the writing style, the level of detail, the framework for internal discussion will be entirely new. Watch specifically for: (1) the range of views on the dot plot dispersion, (2) discussion of participation and its inflation implications, (3) any specific commentary on the September FOMC meeting setup, and (4) the operative framework for the July 30-31 decision.
WHY PARTICIPATION RATE MATTERS MORE THAN THE U-RATE THIS CYCLE
The U-rate is calculated as unemployed / labor force. If someone stops looking for work, they leave the labor force — and the U-rate can fall while the underlying employment picture actually weakens. That is precisely what happened in June: employment gains were soft (+57K vs +113K expected), but the U-rate DROPPED because the labor force shrank. The Fed's dual mandate technically references the U-rate, but Warsh's task force on 'data sources' announced at the June press conference explicitly includes participation as a monitored variable. Two implications. First, the sub-4.3% U-rate print does NOT support the dovish read the market initially took — it may actually support a hawkish read if the drop reflects structural supply loss. Second, the specific composition matters: prime-age-male participation at multi-year lows is historically associated with recessions AND persistent wage pressure. Neither is what the equity tape wants to see. Our read: the June NFP is genuinely softer, but the participation collapse means the Fed's flexibility is narrower than the headline suggests. The dot plot's hike-bias is more durable than yesterday's futures repricing implied.
5. ECONOMIC CALENDAR — THIS WEEK
Day
Time (ET)
Release
Consensus / Actual
Wed 7/01
10:00 AM
ISM Manufacturing (released)
Modest miss vs 53.8
Wed 7/01
AM
ADP Employment (released)
+98K vs +113K est
Thu 7/02
8:30 AM
NFP (released)
+57K ✗ MISS (vs +113K)
Thu 7/02
Close
Dow record; Nasdaq -0.8%
Rotation extending
Fri 7/03
All day
Markets closed — July 4
—
Mon 7/06
10:00 AM
ISM Services PMI
51.8
Mon 7/06
After close
SPCX passive-flow buying begins
N-100 inclusion Tue
Tue 7/07
Open
SPCX begins trading as N-100 member
—
Wed 7/08
2:00 PM
FOMC Minutes — KEY
Warsh's first
Fri 7/10
8:30 AM
JUNE CPI — KEY
+0.27% core m/m est
Mon 7/13
AM
Q2 earnings kick off (early)
—
Tue 7/14
Pre-open
JPM / WFC / C — Q2 banks
Peak Q2 season
6. EARNINGS WATCH
The Q2 earnings season formally opens next week — JPMorgan, Wells Fargo, and Citigroup all report Tuesday July 14 before the open. The banks' Q2 setup is distinctly favorable: the steepened curve (10Y-3M spread expanded ~40 bps since the FOMC) supports net interest margin expansion; the M&A pipeline has picked up meaningfully in Q2; capital markets activity has been robust. Our Q2 preview framework: expect JPM to modestly beat consensus and guide FY26 NII slightly higher; WFC to beat on the credit-quality read; C to beat on trading revenues but guide cautiously on the wealth-management build-out. Consumer earnings from Delta (DAL), PepsiCo, and Netflix follow later next week.
7. SECTOR SPOTLIGHT: SPCX FAST-TRACK JOINS THE NASDAQ-100 TUESDAY
The single largest single-name passive-flow event of 2026 to date takes place today and tomorrow. SpaceX (SPCX) becomes a Nasdaq-100 Index member effective for trading Tuesday morning, July 7 — approximately 26 calendar days after the June 12 IPO. This is the standard Nasdaq fast-track inclusion pattern: any newly-listed Nasdaq-domiciled security with a market capitalization greater than the smallest current N-100 member becomes eligible for consideration on the seventh trading day post-IPO; the index committee typically confirms inclusion within the following trading week; passive-flow build begins the trading day before the effective date. Today at 4:00 p.m. ET, that passive-flow build begins. The mechanics — and the implications for the SPCX bear case we walked through in the June 16 brief — are the subject of this spotlight.
Fig. 1 — Nasdaq-100 tracker AUM. Approximately $390B tracks the index; at ~1.4-1.6% weight, SPCX implies ~$5.5-6.2B of required passive buying.
The passive-flow math. The Nasdaq-100 is tracked by approximately $390 billion of AUM across the ETF and mutual-fund complex. QQQ (Invesco) is the largest tracker at ~$285B; QQQM (Invesco's fee-friendly variant) at ~$32B; ONEQ (Fidelity) at ~$6B; TQQQ (ProShares 3x levered) at ~$22B; and the balance across a long tail of smaller trackers and 401(k) mutual-fund products. SPCX's expected index weight at inclusion — driven by its float-adjusted market cap of roughly $1.2 trillion — is in the 1.4-1.6% range. At $390B of tracker AUM × 1.5% weight = approximately $5.9 billion of required passive-flow demand. Some of that demand can be met by market-makers using pre-existing SPCX inventory; the balance must be sourced from the open market across today's aftermarket, Tuesday's session, and the first few sessions post-inclusion.
Fig. 2 — Historical Nasdaq-100 fast-track inclusion effect. The typical name runs +3-5% into inclusion, peaks near T+1, then gradually mean-reverts.
The historical index effect for Nasdaq-100 fast-track additions is well-documented. The typical name (average of ~30 additions since 2015) runs +3.1% in the five sessions leading into inclusion, peaks at approximately +4.8% on inclusion day, adds a bit more (+4.2% peak cumulative) on T+1, and then gradually mean-reverts over the following 10 trading days back toward roughly +1% cumulative alpha versus the broader index. SPCX has moved somewhat differently than the typical pattern — the stock traded down modestly through the last week of June on the OpenAI-IPO-delay overhang, and closed Thursday July 2 at approximately $168. The 'pre-inclusion run-up' phase, in other words, has been partial. That has two implications: (1) the passive-flow demand is now landing into a modestly-off stock, which typically amplifies the initial move; (2) the mean-reversion downside on the T+5 through T+10 window is meaningfully less than the typical pattern implies.
FAST-TRACK INCLUSION — WHY THE SPCX CASE IS UNUSUAL
Nasdaq-100 fast-track inclusion is a mechanical process, but the specific SPCX case has three unusual features that make the passive-flow impact potentially larger than the historical average. First, size. At $1.2T float-adjusted market cap, SPCX will join at the ~14th-largest weight in the Nasdaq-100 immediately — a position size that typically takes years to build for organic index members. That means the total DOLLAR amount of passive flow ($5.9B) is unusually concentrated in a very compressed timeframe (a few trading sessions). Second, float. SPCX's publicly-traded float is only 25% of shares outstanding — the smallest float ratio of any recent Nasdaq-100 fast-track addition. That creates a supply-demand mismatch: a lot of passive demand hitting a small float means outsized price impact per unit of buying. Third, the offset. The OpenAI-IPO-delay overhang has meaningfully compressed the multiple SPCX would otherwise carry into inclusion. The stock is up only 24% from the $135 IPO price and DOWN roughly 5% from the June 22 peak of $177.99. That compressed setup makes the passive-flow effect more asymmetric — the demand meets a less-elevated multiple than would typically be the case. Net implication: we expect the SPCX passive-flow effect to run modestly hotter than the historical average — +5-7% in the T through T+3 window, then gradual mean-reversion through mid-July. The bear case we articulated June 16 (customer concentration, xAI capital allocation questions, orbital-AI valuation discipline) remains structurally intact; the fast-track inclusion is a passive-flow event that temporarily overrides those fundamentals in the short term.
Our positioning read. We are NOT changing our medium-term view on SPCX — the bear case from June 16 stands. The customer-concentration risk to xAI, the orbital-AI valuation discipline question, and the broader post-SPCX AI-IPO market repricing (the OpenAI delay) all persist. But we recognize that the passive-flow event is real, mechanical, and near-term. Investors who want to trade the mechanical run-up-and-fade pattern can do so with well-defined stops (buy T-1 close, sell T+2 close, historical hit rate ~68%). Investors who want to add SPCX to portfolios as a long-term holding should wait until the passive-flow-induced run-up mean-reverts — likely T+7 through T+10 — before establishing meaningful positions. We are not doing either at the moment; we are watching.
8. ANALYST CALLS DRIVING ACTION
Upgrades / target hikes: JPMorgan raised JPM PT to $215 pre-earnings on the steepened-curve NIM math. Wells Fargo raised BAC PT to $52. Goldman raised Delta (DAL) to $85 on the labor-cooling read for jet-fuel demand. Morgan Stanley raised Constellation Energy (CEG) to $505.
Downgrades / target cuts: Bernstein cut ServiceNow (NOW) further to $820. BofA cut Tesla (TSLA) PT to $420 on the Thursday selloff and pre-inclusion positioning in the Nasdaq-100. Wedbush lowered Nvidia (NVDA) PT modestly. Wells Fargo cut Alphabet (GOOGL) modestly on regulatory concerns.
USD/JPY at 158.20 — MoF intervention risk still live; sub-160 for now.
TLT — Beneficiary of dovish NFP reset; watch Friday CPI.
10. GLOBAL MACRO SNAPSHOT
Asia: A strong session on the softer-dollar tape and the Nikkei's semi-supply-chain read of the SPCX Nasdaq-100 inclusion. Nikkei +0.63%, Hang Seng +1.77% (a meaningful bounce on China property policy easing rumors), Shanghai +1.10%. The yen firmed to 158.20 on the dovish NFP-driven dollar weakness — Ministry of Finance intervention rhetoric has faded modestly this morning.
Europe: Constructive on lower yields, softer dollar, and Iran progress. Stoxx 600 +0.56%, FTSE +0.59%, DAX +0.68%. Central-bank commentary Thursday from Sintra reinforced the ECB's data-dependent framework without additional hawkish tilt. EUR/USD extended to 1.0745 on the NFP-driven dollar softening.
Emerging markets: Broadly firmer on the dollar move. India, Korea, Indonesia all in the green. China's Hang Seng bounce is meaningful — the first meaningfully positive session in three weeks. Real, Mexican peso, and Turkish lira all firmer.
11. WEEK AHEAD PREVIEW
Today: ISM Services PMI at 10:00 AM; SPCX passive-flow buying begins after close.
Tuesday: SPCX joins Nasdaq-100; NFIB Small Business Optimism at 6:00 AM.
Wednesday — KEY: FOMC Minutes at 2:00 PM (Warsh's first minutes release).
Thursday: Weekly claims; PPI at 8:30 AM.
Friday — KEY: JUNE CPI at 8:30 AM. Consensus +0.27% core m/m. The Warsh-dot-plot inflation anchor.
12. THE CLOSING THOUGHT
H2 2026 opens with three cleanly separable stories all playing out simultaneously. First, the labor market: the June NFP miss and the participation-rate collapse together tell us the labor tape is genuinely softer than Q2 suggested, but the composition of the softening (structural supply loss versus cyclical hiring cooling) matters more than the headline number. Warsh's FOMC minutes Wednesday and Friday's June CPI will determine whether the market extends its dovish reprint or reverses. Second, the rotation. Thursday's Dow-record-plus-Nasdaq-drop pattern is the June defensive rotation extending, not fading. Tech, semis, and AI-software are under pressure; industrials, financials, and cyclicals are catching bid. That is directionally consistent with our H2 playbook. Third, SPCX. The Nasdaq-100 fast-track inclusion tomorrow is the single largest single-name passive event of the year — the mechanical flow is worth watching, but the medium-term bear case remains intact. We are net constructive on the AI-power complex, cautious on AI-semi through Nvidia's August print, adding to defense on Iran-tail hedging, and modestly increasing cash allocation into the Wednesday minutes and Friday CPI. Have a productive week — we will be back Tuesday morning with the initial SPCX inclusion tape read.
THE BROOKSIDE BRIEF · COMPILED 9:30 AM ET · SOURCES: BLS (JUNE 2026 EMPLOYMENT SITUATION), THESTREET / CNBC (JULY 2 CLOSE), NASDAQ INDEX SERVICES (SPCX INCLUSION), CNN / AXIOS (IRAN DOHA UPDATE), FXSTREET (SINTRA / DXY), TREASURY H.15, CME FEDWATCH, ASCHENBRENNER 'SITUATIONAL AWARENESS', CITRINI RESEARCH
MORNING EDITION · TUESDAY, JULY 7, 2026 · TANKER STRUCK OFF OMAN · SPCX N-100 DEBUT · VIX 18.9
In yesterday's brief we characterized the historical Nasdaq-100 fast-track inclusion effect as producing a positive first-day return (+4.8% average) and cited a 'buy T-1, sell T+2' pattern with '~68% hit rate.' A careful review of the underlying academic literature and Nasdaq's own historical statistics shows the opposite: of the 35 Nasdaq-100 additions announced at least 10 days before the effective date, only 12 (34%) rose on Day 1 as a member, and the average return was -1.13% on Day 1 and -3.41% over the first five trading days. The passive-flow mechanical demand ($4.3 billion per JPMorgan's estimate, not our $5.9 billion figure) is real, but it does not reliably translate into positive short-term returns. We regret the misdirection. Today's Section 7 walks through the corrected framework, and today's opening SPCX pre-market action (-2.1%) is consistent with the corrected pattern rather than the initial one.
1. THE MORNING SETUP
Good morning. Two competing headlines are dominating the pre-open. First, oil is up meaningfully overnight after an 'unknown projectile' struck an oil tanker off the coast of Oman near the Strait of Hormuz on Monday. The British Maritime Security Agency confirmed the incident and Axios reported that Iran has 'resumed attacks' in the strait. WTI is up roughly 4.5% overnight to $74.20; Brent is at $76.80. Commercial tanker traffic through the strait has continued but at reduced speed with heightened U.S. Navy escort presence, and war-risk insurance premiums on Hormuz-transiting vessels have re-widened to roughly 0.55% of hull value per voyage — up from 0.35% at the June 29 de-escalation but still below the June 27 peak of 0.75%. The fragility of the Islamabad Memorandum framework is, once again, on live display.
Second, SpaceX (SPCX) formally joins the Nasdaq-100 Index this morning — a fast-track inclusion that was confirmed by Nasdaq on June 26. The passive-flow demand estimated by JPMorgan at approximately $4.3 billion begins its build phase at the open. SPCX is indicated down 2.1% in pre-market on the broader tech rout, trading roughly $158 — consistent with the historical pattern for fast-track additions (which see an average -1.13% first-day return). Section 7 walks through the corrected framework and what we now expect for the T through T+10 window.
Yesterday's Monday tape delivered exactly what the setup implied. The S&P rose 0.72% to 7,537.43; the Nasdaq Composite added 1.12% to 26,121.16; the Dow climbed 155.84 points (+0.29%) to 53,055.91 — passing the 53,000 mark and setting another record. The June ISM Services PMI print at 10:00 a.m. came in at 54.0 — a modest 0.5-point slip from May's 54.5, but the 24th consecutive month in expansion territory. The critical sub-index was Employment, which jumped 3.3 points to 51.2 and expanded for the first time in four months. That combination — services still expanding, services employment returning to growth after four months of contraction — materially complicates the dovish read of Thursday's NFP miss. If the June NFP was a temporary weather-and-seasonal artifact rather than a structural cooling, the hawkish dot plot from June 17 remains meaningfully durable.
This morning's pre-open tape reflects the Hormuz-tanker-driven risk-off. Nasdaq 100 futures are down 1.0% (chip stocks leading the sell); S&P 500 futures are down 0.1%; Dow futures are UP 225 points (+0.4%) as the defensive rotation extends into another session. The 10-year Treasury yield has climbed 10 basis points overnight to nearly 4.48% — a meaningful move that reflects both the oil-driven inflation-expectations repricing and the strong ISM Services employment component from yesterday. The 2-year is at 4.14%; the dollar has firmed with DXY at 100.20 (+0.35% overnight). Gold is bid at $2,118; bitcoin has softened to $84,900.
Today's data calendar is quiet apart from NFIB Small Business Optimism at 6:00 a.m. (consensus 96.5). The bigger events sit later this week: FOMC Minutes tomorrow at 2:00 p.m. (Warsh's first, arguably the most important read of the summer) and June CPI Friday at 8:30 a.m. Today's Sector Spotlight covers what the Hormuz tanker attack means for oil, tanker equities, insurance rates, and the broader ceasefire durability question. Three charts.
2. MARKETS AT A GLANCE
U.S. EQUITY FUTURES (PRE-OPEN, TANKER ATTACK + TECH ROUT)
Asset
Last
Change
% Chg
S&P 500 (ES)
7,530
-8
-0.11%
Nasdaq 100 (NQ)
25,845
-260
-1.00%
Dow (YM)
53,285
+225
+0.43%
Russell 2000 (RTY)
2,392
-10
-0.42%
PRIOR CLOSE (MONDAY, JULY 6 — DOW PASSES 53K, ALL-TIME HIGH)
Asset
Last
Change
% Chg
S&P 500
7,537.43
+54.20
+0.72%
Nasdaq Composite
26,121.16
+164.16
+1.12%
Dow Jones Industrial Avg. (record)
53,055.91
+160.31
+0.29%
Russell 2000
2,401.90
+9.30
+0.39%
VIX
18.90
+1.70
+9.88%
RATES & FX — YIELDS JUMP ON TANKER ATTACK + STRONG ISM SERVICES EMPLOYMENT
Asset
Last
Change
% Chg
UST 2-Year
4.14%
+12 bps overnight
—
UST 10-Year
4.48%
+10 bps overnight
—
UST 30-Year
4.96%
+9 bps
—
10-Yr TIPS (real)
2.14%
+6 bps
—
DXY (Dollar Index)
100.20
+0.35
+0.35%
EUR/USD
1.0685
-0.0055
-0.51%
USD/JPY
159.10
+0.90
+0.57%
COMMODITIES — OIL BID ON HORMUZ ATTACK
Asset
Last
Change
% Chg
WTI Crude (Aug)
$74.20
+$3.35 overnight
+4.7%
Brent Crude (Aug)
$76.80
+$3.60 overnight
+4.9%
Gold (spot)
$2,118
+$10
+0.47%
Silver (spot)
$21.40
+$0.20
+0.94%
Bitcoin
$84,900
-$4,000
-4.50%
ASIA & EUROPE (INTRADAY) — TANKER ATTACK WEIGHED GLOBALLY
Asset
Last
Change
% Chg
Nikkei 225
39,485
-265
-0.67%
Hang Seng
22,050
-100
-0.45%
Shanghai Composite
3,198
-17
-0.53%
Stoxx Europe 600
569.20
-3.20
-0.56%
FTSE 100
8,875
-30
-0.34%
DAX
20,455
-135
-0.66%
3. TOP STORIES
Oil Tanker Struck Near Strait of Hormuz — Iran Resumed Attacks Per Axios
The British Maritime Security Agency confirmed Monday that an 'unknown projectile' struck an oil tanker off the coast of Oman near the Strait of Hormuz. Axios reported concurrently that Iran had 'resumed attacks in the strait,' though attribution to Iran directly has not been confirmed by U.S. authorities. The vessel — a Suezmax-class crude carrier — sustained damage but did not sink; the crew is reported safe. Commercial traffic through the strait has continued but at reduced speed with heightened U.S. Navy escort presence. Oil rallied roughly 4.5% overnight: WTI at $74.20, Brent at $76.80. This is the first material escalation since the June 27-28 U.S.-Iran exchange of strikes, and it comes precisely as indirect Doha talks were reportedly progressing. The Vice President's assessment that talks were 'going well' looks noticeably more strained this morning.
Dow Passes 53,000 Monday, Sets Another Record; Nasdaq +1.12%
Monday delivered the strongest broad-market session in two weeks. The Dow Jones Industrial Average climbed 155.84 points (+0.29%) to 53,055.91 — passing the 53,000 mark for the first time and setting a fresh all-time high. The S&P 500 rose 0.72% to 7,537.43. The Nasdaq Composite added 1.12% to 26,121.16, recovering most of Thursday's session drop as chip stocks shook off some of the recent weakness. AI-power names were bid; physical-AI picks-and-shovels caught steady flow. The ISM Services Employment component's 3.3-point jump was the standout sub-metric.
June ISM Services PMI at 54.0 — 24th Consecutive Month in Expansion
The Institute for Supply Management's Services PMI for June came in at 54.0, down 0.5 points from May's 54.5 but the 24th consecutive month in expansion territory (any reading above 50). Under the hood: Business Activity Index at 55.4 (down 2.3 points from May); New Orders at 55.1 (down 2.2); Employment at 51.2 (UP 3.3 points and expanding for the first time in four months); Prices Paid at 62.7 (unchanged, still elevated). The employment component's return to expansion is the material read. It suggests June's soft NFP was more idiosyncratic (seasonal leisure/hospitality drag) than structural. That materially complicates the dovish read of Thursday's payrolls print.
SPCX Formal Nasdaq-100 Inclusion Today — Down 2.1% Pre-Market
SpaceX (SPCX) becomes an official Nasdaq-100 Index member effective the market open today. Nasdaq's fast-track framework — enacted 2024 to accommodate large-cap listings — allowed inclusion just 15 trading days after the June 12 IPO. Passive-flow demand from index trackers is estimated by JPMorgan at $4.3 billion (revised down from our Monday $5.9B estimate — see Editor's Note above and Section 7 for the corrected framework). SPCX is indicated down 2.1% pre-market to roughly $158 as the broader tech-rout tape and the corrected historical pattern converge.
Yields Jump 10 bps on Tanker Attack + Strong ISM Services
The 10-year Treasury yield climbed 10 basis points overnight to nearly 4.48%. The 2-year rose 12 bps to 4.14%. The 30-year added 9 bps to 4.96%. The move is a combination of two forces. First, the Hormuz tanker attack has re-widened inflation expectations (the 10-year breakeven added 5 bps overnight to 2.34%). Second, the strong ISM Services employment component from Monday supports a more durable hawkish setup than Thursday's NFP miss suggested. CME FedWatch December-hike odds have moved back up to ~65% from ~55% pre-print — essentially reversing the post-NFP dovish repricing.
The macro setup for the balance of the week is dominated by two events. Tomorrow's FOMC Minutes release at 2:00 p.m. ET is Warsh's first Minutes as Chair — the writing style, level of detail, framework for internal discussion will be entirely new. Watch specifically for: (1) the range of views among voting members on the dot-plot dispersion, (2) any discussion of the participation-rate collapse and its inflation implications, (3) commentary on the July 30-31 FOMC setup, (4) the operative framework going forward.
Friday's June CPI at 8:30 a.m. is the more directly market-moving event. Consensus is Core CPI +0.27% m/m and Y/Y at 3.2%. Headline consensus is +0.30% m/m and +3.4% Y/Y. The hot direction — above +0.32% core m/m — pushes the December hike toward fully priced and could trigger a meaningful risk-off across duration and growth. The soft direction — below +0.20% core m/m — unwinds the tanker-attack yield jump AND the post-ISM hawkish repricing. We assign roughly 55% probability the print lands in the +0.20% to +0.32% consensus range, 25% upside risk, 20% downside.
THE GOOD-NEWS/BAD-NEWS READ OF MONDAY'S ISM SERVICES
Monday's ISM Services release created what economists call the 'good-news/bad-news' interpretation problem. The good news: the services sector remains in expansion for a 24th consecutive month, employment growth resumed after four months of contraction, business activity remains firm. That is fundamentally supportive of the durable-consumer thesis and the broader soft-landing framework. The bad news: the employment-component return to expansion means the June NFP miss was likely more idiosyncratic than structural — the labor market is not, in fact, cooling in the way Thursday's payrolls suggested. That undercuts the dovish read of the NFP that fueled the initial post-print yield rally. Warsh's dot-plot hike-bias is now more durable than yesterday's futures pricing reflected. If Friday's CPI supports the framework (in-line or hot), the market prices at least one 25 bp hike by year-end AND meaningful odds of a second. If Friday's CPI is soft, the market gets a dovish repricing but the underlying labor picture still supports Warsh's stance. The setup is asymmetric — the risk to the equity multiple sits with the hawkish scenario.
5. ECONOMIC CALENDAR — THIS WEEK
Day
Time (ET)
Release
Consensus / Actual
Mon 7/06
10:00 AM
ISM Services (released)
54.0 ✓ / Empl +3.3
Mon 7/06
Overnight
Hormuz tanker attack
Oil +4.5%
Tue 7/07
6:00 AM
NFIB Small Business
96.5
Tue 7/07
Open
SPCX joins Nasdaq-100
Down 2.1% pre-open
Wed 7/08
2:00 PM
FOMC Minutes — KEY
Warsh's first
Thu 7/09
8:30 AM
Weekly Claims / PPI
225K / +0.2%
Thu 7/09
1:00 PM
10-Year Treasury Auction
—
Fri 7/10
8:30 AM
JUNE CPI — KEY
+0.27% core m/m / 3.2% Y/Y
Mon 7/13
AM
Q2 season begins early
—
Tue 7/14
Pre-open
JPM / WFC / C — Q2 banks
Q2 season peak
6. EARNINGS WATCH
The Q2 earnings season opens next week with the big banks Tuesday July 14 pre-open — JPMorgan, Wells Fargo, Citigroup, and Goldman all report. The Q2 bank setup is distinctly favorable: the steepened curve (10Y-3M spread has expanded ~40 bps since the FOMC) supports net interest margin expansion; the M&A pipeline picked up meaningfully in Q2; capital markets activity has been robust. We expect JPM and GS to modestly beat consensus; WFC to beat on credit quality; C to beat on trading revenues but guide cautiously on the wealth-management build-out. Delta (DAL) reports Thursday July 16; PepsiCo the same day. Netflix the following Monday. Nvidia Q2 in early August remains the marquee AI event.
Yesterday's brief closed with an observation that the Iran ceasefire was fragile but was, per Vance, 'going well.' Overnight, that framing was tested. The 'unknown projectile' strike on an oil tanker near the Strait of Hormuz — with Axios reporting Iran had resumed attacks in the strait — is the most consequential geopolitical event in the Persian Gulf since the June 27-28 U.S.-Iran exchange of strikes. Today's spotlight covers what this means for oil, tanker equities, insurance rates, and the broader ceasefire durability question. Three charts.
Fig. 1 — Global seaborne oil transit by chokepoint. Hormuz at 20.5% is the world's most critical maritime chokepoint.
First, the underlying geography and the stakes. Roughly 20.5% of global seaborne oil transits the Strait of Hormuz every day — approximately 17 million barrels of crude and 3 million barrels of refined product. The strait is 21 miles wide at its narrowest point; the shipping channel is 2 miles wide in each direction. Saudi Arabia, the UAE, Qatar, Kuwait, Iraq, and Iran itself all rely on transit through the strait for their oil exports. A complete closure of the strait — which has been threatened multiple times over decades but never sustained beyond a few days — would cause immediate global oil prices to spike toward $150. The current environment is meaningfully less severe than that outcome, but the volatility premium is real and, as this morning's oil move demonstrates, immediately reflected in the tape.
Fig. 2 — Hormuz tanker war-risk insurance premium. Back to 0.55% overnight — 5.5x pre-conflict levels but off the June 27 peak.
Second, the tanker equity and insurance implications. War-risk insurance premiums on vessels transiting the Hormuz strait have re-widened to roughly 0.55% of hull value per voyage this morning — up from 0.35% at the June 29 de-escalation, but still below the June 27 peak of 0.75%. The insurance premium is charged per voyage on top of the standard hull cover, and for a VLCC (very large crude carrier) worth roughly $85 million, that translates to approximately $470,000 per Hormuz transit. Tanker operators can pass this cost through to shippers via the freight rate, which is why tanker equities (FRO, EURN, INSW, DHT) are all modestly bid pre-market despite the broader risk-off tone. The tanker complex is one of the few segments of the shipping-and-logistics space that structurally benefits from Middle East geopolitical volatility — the same premium that raises insurance costs raises freight rates, and the freight-rate move typically more than offsets the insurance cost.
Third, the oil-equity read. The integrated majors (XOM, CVX) rallied 3-4% overnight; E&P leverage names (FANG, EOG, DVN, MPC) are all up 4-6%. The oil-services complex (SLB, HAL, BKR) is bid but less dramatically. Refiners (VLO, MPC, PSX) will trade the crack-spread math depending on how the crude curve behaves over the next few days. Our tactical framework: use the initial oil pop to trim some of the June 29 defensive-tilt integrated-energy additions (XOM, CVX) into the pre-market bid, and maintain E&P leverage (FANG, EOG) for the tail-risk hedge. The tanker equity trade — long FRO, EURN, DHT — is a cleaner tactical expression of the Hormuz-specific risk premium.
THE BROADER CEASEFIRE DURABILITY QUESTION
Yesterday morning's characterization of the Iran ceasefire as 'progressing but fragile' has been directly tested. Overnight's tanker attack, if attributable to Iran or Iran-affiliated actors, would represent a material step back from the post-June 29 de-escalation baseline. There are two ways to read the setup. The constructive read: the Doha technical talks continue in parallel; the attack is a one-off provocation by a specific IRGC faction rather than an authorized Iranian-state action; the Islamabad Memorandum framework holds. The pessimistic read: the attack is the first of a series of escalations designed to extract concessions from the Doha talks; the U.S. will feel obligated to respond militarily within days; the June 27-28 exchange cycle repeats. We now assign roughly 40% probability the broader deal holds through July (down from 55% Monday), with the 60% downside case implying oil in the $85-95 range and equity multiples compressing further. Our positioning tilt: maintain and modestly increase defense exposure (LMT, BAH, RTX); maintain integrated energy but on lighter position sizing; add gold and silver on any Wednesday/Thursday weakness; carry incremental cash allocation into Friday's CPI print.
8. ANALYST CALLS DRIVING ACTION
Upgrades / target hikes: Goldman raised Exxon (XOM) PT to $145 pre-market on the geopolitical setup. Morgan Stanley raised Diamondback Energy (FANG) to $185. Wells Fargo raised LMT to $645. Bernstein raised BAH to $205 (up from $195). Citi upgraded Frontline (FRO) to Buy on the tanker-insurance-rate math.
Downgrades / target cuts: BofA cut SPCX PT to $135 on the Nasdaq-100 inclusion day framing correction. Wedbush trimmed Tesla (TSLA) to $410. Goldman cut Adobe (ADBE) modestly on continued AI-software multiple compression.
9. STOCKS TO WATCH
XOM / CVX — Integrated majors bid on Hormuz risk. Goldman XOM to $145.
FANG / EOG / DVN — E&P leverage to Brent over $75. MS FANG to $185.
FRO / EURN / INSW / DHT — Tanker equities benefit from Hormuz insurance-rate math. Citi FRO to Buy.
USD/JPY at 159.10 — MoF intervention rhetoric still relevant.
TLT — Duration under pressure again on tanker-attack yield jump.
10. GLOBAL MACRO SNAPSHOT
Asia: A weaker session on the Hormuz attack read-through. Nikkei -0.67%, Hang Seng -0.45%, Shanghai -0.53%. Korean semi names traded heavy on the broader chip-rout tape — Samsung -1.4%, SK Hynix -2.1%. The yen weakened modestly to 159.10 as the policy-divergence tape resumed on stronger U.S. yields.
Europe: Modestly negative on the Hormuz risk-off. Stoxx 600 -0.56%. Energy names provided some relative outperformance — Shell, BP, Total all bid. ECB commentary quiet this morning.
Emerging markets: Modest risk-off on the dollar strength + Hormuz risk. India, Korea, Indonesia all modestly weaker. The dollar-tightening tape resumes as the tanker-attack-driven yield jump increases the policy-divergence differential.
11. WEEK AHEAD PREVIEW
Today: NFIB Small Business Optimism at 6:00 AM; SPCX Nasdaq-100 debut at open.
Wednesday — KEY: FOMC Minutes at 2:00 PM (Warsh's first minutes release).
Thursday: Weekly claims + PPI at 8:30; 10Y Treasury auction 1:00.
Friday — KEY: JUNE CPI at 8:30. Consensus +0.27% core m/m / 3.2% Y/Y.
Next Tuesday: Q2 bank earnings open with JPM/WFC/C/GS.
12. THE CLOSING THOUGHT
Three cleanly separable stories are now overlapping in a way that requires more attention than the Monday tape suggested. The Hormuz tanker attack has, in a single overnight session, materially reversed the June 29 de-escalation narrative. Oil, yields, and cross-asset positioning have all repriced. The Iran ceasefire is now, on our probabilistic assessment, meaningfully more fragile than we characterized in yesterday's brief. The SPCX Nasdaq-100 inclusion is proceeding as scheduled but the pre-market tape is validating the corrected historical framework (-1.13% Day 1 average) rather than the framework we initially characterized. And the ISM Services employment jump has meaningfully undercut the dovish read of Thursday's NFP miss — Warsh's hike bias is more durable than the post-print futures repricing reflected. Two events dominate the balance of the week: tomorrow's FOMC Minutes and Friday's June CPI. Both will materially shape the July 30-31 FOMC decision that increasingly looks like a hold-with-hawkish-guidance rather than an in-line-with-forward-guidance meeting. Our positioning tilt: maintain and modestly increase defense; trim integrated energy into the morning rally; add tactical tanker equity exposure; maintain core AI-power and physical-AI picks-and-shovels; remain cautious on AI-semi and AI-software through the FOMC minutes; carry incremental cash into Friday's CPI. Trade carefully.
THE BROOKSIDE BRIEF · COMPILED 9:30 AM ET · SOURCES: CNBC / THESTREET (JULY 6 CLOSE), NASDAQ INDEX SERVICES (SPCX FAST-TRACK INCLUSION), JPMORGAN (PASSIVE FLOW EST.), BRITISH MARITIME SECURITY / AXIOS (TANKER ATTACK), ISM (JUNE SERVICES PMI), CME FEDWATCH, EIA / IEA (HORMUZ TRANSIT DATA), LLOYD'S MARKET ASSOCIATION (INSURANCE RATES), ASCHENBRENNER, CITRINI RESEARCH
Good morning. The single most important market event of the summer sits at 2:00 p.m. ET this afternoon: the FOMC Minutes release from the June 16-17 meeting — Chair Warsh's first Minutes as gavel-holder. Because Warsh made a point of withholding his own personal projection from the dot plot, the Minutes transcript becomes the primary on-record source of what he actually thinks about the September and Q4 rate path. The June dot plot revealed a committee split 9 members projecting hikes by year-end (three seeing one hike, six seeing two hikes), 8 members projecting no change, and 1 member projecting a cut. Today's Minutes will tell us — for the first time in the Warsh era — the actual language the hawks used to justify their positions and how the doves built their case for holding.
Yesterday's Tuesday session extended the semi-led selling that has defined the past week. The Nasdaq Composite fell 1.16% to 25,818.69, the S&P 500 slipped 0.45% to 7,503.85, and the Dow lost 0.25% to 52,925.15 (off Monday's 53,055.91 all-time high). The semiconductor rout was driven overnight by Samsung Electronics' Q2 earnings — the company reported a 19-fold profit increase but came up short of analysts' most optimistic outlook, sending the entire Asia-and-U.S. chip complex lower. SPCX made its Nasdaq-100 debut and closed at $159.10 (-1.49%), consistent with the corrected historical -1.13% Day 1 pattern we walked through in yesterday's spotlight.
This morning's pre-open is modestly firmer. Nasdaq 100 futures are up 0.35%; S&P futures are up 0.28%; Dow futures are up 165 points (+0.31%). Treasury yields are little changed heading into the Minutes — the 10-year at 4.469% (-1 bp from yesterday), 2-year at 4.114% (-1 bp). The dollar has softened modestly (DXY 100.05). Oil has retraced further from Monday's tanker-attack spike: WTI at $72.85, Brent at $75.20. The Iran situation is quieter this morning — no additional incidents overnight, and the Qatari Foreign Ministry is expected to release a statement later today on the status of the Doha technical talks.
Today's Sector Spotlight is a practical field guide to reading the FOMC Minutes when they arrive at 2:00 p.m. What language should you watch for? Which sub-topics have the largest cross-asset consequences? What does each scenario — hawkish, neutral, dovish — imply for equities, rates, and the dollar? Three charts walk through the framework. Friday's June CPI at 8:30 a.m. is the second decisive event of the week — the Minutes provide the framework for interpreting the print.
2. MARKETS AT A GLANCE
U.S. EQUITY FUTURES (PRE-OPEN, INTO FOMC MINUTES)
Asset
Last
Change
% Chg
S&P 500 (ES)
7,525
+21
+0.28%
Nasdaq 100 (NQ)
25,935
+90
+0.35%
Dow (YM)
53,090
+165
+0.31%
Russell 2000 (RTY)
2,398
+6
+0.25%
PRIOR CLOSE (TUESDAY, JULY 7 — CHIP ROUT EXTENDS ON SAMSUNG)
Asset
Last
Change
% Chg
S&P 500
7,503.85
-33.58
-0.45%
Nasdaq Composite
25,818.69
-302.47
-1.16%
Dow Jones Industrial Avg.
52,925.15
-130.76
-0.25%
Russell 2000
2,391.80
-10.10
-0.42%
VIX
19.20
+0.30
+1.58%
RATES & FX — YIELDS STABLE AHEAD OF MINUTES
Asset
Last
Change
% Chg
UST 2-Year
4.114%
-1 bp
—
UST 10-Year
4.469%
-1 bp
—
UST 30-Year
4.94%
-2 bps
—
10-Yr TIPS (real)
2.11%
-3 bps
—
DXY (Dollar Index)
100.05
-0.15
-0.15%
EUR/USD
1.0710
+0.0025
+0.23%
USD/JPY
158.85
-0.25
-0.16%
COMMODITIES & CRYPTO — OIL RETRACES FURTHER FROM TANKER-ATTACK PEAK
Asset
Last
Change
% Chg
WTI Crude (Aug)
$72.85
-$1.35 from Tue
-1.8%
Brent Crude (Aug)
$75.20
-$1.60 from Tue
-2.1%
Gold (spot)
$2,124
+$6
+0.28%
Silver (spot)
$21.50
+$0.10
+0.47%
Bitcoin
$85,400
+$500
+0.59%
ASIA & EUROPE (INTRADAY) — CHIP COMPLEX EXTENDS SELLING
Asset
Last
Change
% Chg
Nikkei 225
39,340
-145
-0.37%
Hang Seng
21,985
-65
-0.30%
Shanghai Composite
3,192
-6
-0.19%
Stoxx Europe 600
570.40
+1.20
+0.21%
FTSE 100
8,880
+5
+0.06%
DAX
20,485
+30
+0.15%
3. TOP STORIES
FOMC Minutes at 2:00 PM Today — Warsh's First, Most-Watched of the Summer
The FOMC Minutes from the June 16-17 meeting release at 2:00 p.m. ET this afternoon. This is Chair Warsh's first Minutes and, for reasons we walk through in Section 7, arguably the most consequential Fed communication event of the summer. Because Warsh declined to submit his own personal dot at the June meeting, the Minutes are the primary on-record source of his actual view. The June committee split — 9 members projecting hikes, 8 no change, 1 cut — creates a natural tension that the Minutes will resolve or amplify. Wall Street's key questions: (1) how confident are the hawks about their hike projections, (2) what specific triggers would move the doves toward the hawk camp, and (3) any explicit commentary on the September 16-17 meeting setup.
Chip Rout Extends on Samsung Q2 Miss — 19x Profit Increase, Missed Optimistic Outlook
Samsung Electronics reported Q2 results overnight Sunday-Monday featuring a 19-fold year-over-year profit increase — but the print came in below analysts' most optimistic outlook, sending the entire global semiconductor complex lower Tuesday. The Nasdaq Composite fell 1.16%; the SOX shed 2.8%. Nvidia lost 2.5%; Broadcom -3.1%; AMD -2.2%; Marvell -3.4%. The Samsung print matters not for the beat magnitude but for the ceiling it sets on the AI-memory narrative. If Samsung's Q2 was 'strong but not as strong as the bulls hoped,' Micron's early-August print becomes the swing factor for whether the AI-semi thesis re-accelerates through Q3.
SPCX Closes First N-100 Session at $159.10 (-1.49%) — Inline With Historical Pattern
SPCX made its Nasdaq-100 debut Tuesday and closed at $159.10, down 1.49% from Monday's $161.50. Intraday low was $155.20; the aftermarket bid brought the price back to $159. The performance is directly consistent with the corrected historical pattern we walked through yesterday: the average Day 1 for a fast-track Nasdaq-100 addition is -1.13%. The passive-flow demand build proceeded broadly as JPMorgan estimated — approximately $4.3 billion of net buying was absorbed by market-makers over the aftermarket Monday and the Tuesday session. The stock now enters the T+2 through T+10 window where the historical pattern implies further downside (peak cumulative -3.41% by Day 5). We remain patient on establishing meaningful long positions.
The Iran situation was notably quieter overnight. No additional Hormuz incidents reported; commercial tanker traffic continued at normal speeds with U.S. Navy escort presence unchanged from Tuesday's elevated posture. The Qatari Foreign Ministry is expected to release a statement later today on the status of the Doha technical talks — Vice President Vance's team has been in Doha since Monday. Oil has retraced further from Monday's tanker-attack peak: WTI at $72.85, Brent at $75.20. Insurance premiums on Hormuz-transiting vessels remain at 0.55% of hull value per voyage but have stopped widening.
The wave of AI-semi target-price reductions that began with the June 23 BofA rates note has extended. Wedbush cut Micron (MU) PT to $1,350 from $1,500 on the Samsung read-through. Bernstein cut Nvidia (NVDA) PT to $195. Wells Fargo cut Broadcom to $1,780. Notably: the fundamental cases haven't changed — Micron's HBM3E supply is still sold out through 2027, Nvidia's Blackwell backlog is still growing — but the multiples the market is willing to pay for AI-semi exposure have compressed meaningfully in the past three weeks. That is the Citrini AI-capex-discipline thesis playing out in real-time.
4. MACRO & FED WATCH — ALL EYES ON 2:00 PM
The macro debate for the balance of the summer collapses to a single sentence: does the market believe Warsh's 9-vs-8-vs-1 committee split is a genuinely open hawk-dove debate that could tip in either direction, or does it read as a committee that is already leaning hawkish and will formalize that lean at the July 30-31 or September 16-17 meetings? Today's Minutes will materially shape the answer. Our read of the setup: the base case is that the Minutes reveal a moderately hawkish internal committee discussion — 60% probability — with 25% probability the language is materially more hawkish than expected and 15% probability the language is meaningfully dovish.
Fig. 1 — June 2026 dot plot member distribution. 9 project at least one hike by year-end; 8 project no change; 1 projects a cut.
Section 7 walks through the specific language cues to watch and the scenario matrix for cross-asset reactions. In macro terms, we expect CME FedWatch to move as follows: hawkish Minutes take December-hike odds from ~65% back to ~75%; September-hike odds move from ~15% to ~30%. Neutral Minutes hold current pricing (65% Dec / 15% Sep). Dovish Minutes push December-hike odds down to ~50% and September-hike essentially to zero. Friday's June CPI at 8:30 a.m. becomes the confirming or contradicting data point.
Two additional macro pieces worth flagging. First, Warsh's Sintra debut last Wednesday reinforced the 'data-dependent, meeting-by-meeting' framework — the Minutes will provide the operative test of whether that framework survives internal committee scrutiny or whether the hawks are pushing for a more explicit forward guidance-lite framework. Second, the ISM Services Employment jump from Monday (51.2, first expansion in four months) provides fresh data support for the hawks' position — the Minutes will telegraph whether that support was already appreciated at the June 16-17 meeting or whether the labor-market data has meaningfully outpaced the June committee's assumptions.
5. ECONOMIC CALENDAR — THIS WEEK
Day
Time (ET)
Release
Consensus / Actual
Mon 7/06
10:00 AM
ISM Services (released)
54.0 ✓ / Empl +3.3
Tue 7/07
Open
SPCX joins Nasdaq-100 (done)
-1.49% Day 1
Tue 7/07
Overnight
Samsung Q2 miss vs opt outlook
Chip rout
Wed 7/08
2:00 PM
FOMC Minutes — KEY
Warsh's first
Thu 7/09
8:30 AM
Weekly Claims / PPI
225K / +0.2%
Thu 7/09
1:00 PM
10-Year Treasury Auction
—
Fri 7/10
8:30 AM
JUNE CPI — KEY
+0.27% core m/m / 3.2% Y/Y
Fri 7/10
2:00 PM
Fed Balance Sheet
—
Mon 7/13
AM
Q2 earnings early names
—
Tue 7/14
Pre-open
JPM / WFC / C / GS — Q2 banks
Q2 season opens
Wed 7/15
AM
JNJ / UNH
—
Thu 7/16
Pre-open
Delta (DAL) / PEP
—
6. EARNINGS WATCH
Q2 season formally opens next week with JPMorgan, Wells Fargo, Citigroup, and Goldman all reporting Tuesday July 14 pre-open. The Q2 bank setup remains distinctly favorable: the steepened curve supports NIM expansion; M&A activity picked up meaningfully in Q2; capital markets revenue is expected to be strong. Delta reports Thursday July 16 pre-open; PepsiCo same day. Netflix the following Monday. Nvidia's Q2 in early August remains the marquee AI event — with Micron's supply-constraint print behind us and Samsung's below-optimistic-outlook print now setting the framework, Nvidia's disclosure will materially move the AI-semi tape.
7. SECTOR SPOTLIGHT: HOW TO READ THE FOMC MINUTES AT 2:00 PM TODAY
For the first time in nearly a decade of monthly-brief writing, we are dedicating a Sector Spotlight to how to read an FOMC Minutes release rather than to any specific single sector or theme. The reason is direct: today's Minutes are unusually consequential because Warsh's first meeting produced an unusually split dot plot AND Warsh personally withheld his own dot, making the internal-debate transcript the primary source of Warsh's actual thinking. Today's Minutes will materially shape the July 30-31 FOMC decision, the September 16-17 meeting, and Q3-Q4 rate path pricing. Three charts and a language-cue framework walk you through it.
Fig. 1 — Dot plot member distribution (repeated for context).
First, the language cues that historically indicate a hawkish tilt in FOMC Minutes. Watch for: (a) 'many participants' (a phrase used when 10+ members shared a view) attributing inflation stickiness to 'services excluding shelter' or 'wage pressure' or 'labor-market tightness'; (b) explicit references to 'firming' or 'stronger-than-anticipated' economic data; (c) discussion of 'balance-of-risks' language shifting toward the upside on inflation; (d) any specific member positions arguing for 'further tightening' rather than 'holding.' The June dot plot had 3 members seeing one hike and 6 seeing two hikes — the Minutes will tell you whether those positions were nuanced or forceful.
Second, the language cues that indicate a dovish tilt. Watch for: (a) 'several participants' (a phrase used when 5-9 members shared a view) noting 'increased downside risks' to employment or growth; (b) explicit discussion of the participation-rate collapse we walked through Monday and its implications for the sustainability of the labor market; (c) any framing of inflation as 'moderating' rather than 'elevated'; (d) discussion of 'financial stability' or 'commercial real estate' concerns as reasons to prioritize a hold. If the Minutes reveal that the 8 hold-members and the 1 cut-member forced a genuine debate at the June meeting, the hawkish 9-member majority looks less durable than the dot plot implies.
Fig. 2 — Cross-asset scenario matrix. Same-session equity/rate/FX reactions to hawkish, neutral, and dovish Minutes outcomes.
Third, the specific sub-topics with the largest cross-asset consequences. Watch particularly for: (1) any explicit language on the September 16-17 meeting setup — even a single sentence like 'many members judged that additional data would be needed to inform the September decision' can move the rate curve materially; (2) discussion of the Warsh task-force framework and whether the Minutes reveal how the internal Fed process is going to work under Warsh; (3) any mention of the participation-rate collapse specifically — this became a live topic after Thursday's NFP miss and the Minutes will reveal whether it was already a live topic at the June 16-17 meeting; (4) explicit references to the Iran conflict and its implications for the inflation path — the meeting occurred pre-June-19 Islamabad Memorandum signing, so this is a natural sub-topic; (5) any Committee discussion of the AI-capex boom and its inflation implications — this would be a novel-and-notable topic if it appears.
CROSS-ASSET SCENARIO MATRIX — WHAT EACH OUTCOME MEANS FOR POSITIONING
Same-session reactions to FOMC Minutes are among the most reliably tradeable cross-asset patterns in the current cycle. The scenario matrix (Fig. 2) shows our expected reactions. HAWKISH outcome (25% probability): S&P falls roughly 2% into the close as duration multiples compress; 10-year jumps 12 bps as September-hike odds move to 30%; dollar (DXY) rises 0.7% on the policy-divergence math; growth and semi names suffer disproportionately; defensives (staples, healthcare) outperform. NEUTRAL outcome (60% probability): S&P edges up 0.2% on the no-surprise read; 10-year drifts down 1 bp as positioning adjusts; dollar flat; AI-power and physical-AI picks-and-shovels catch modest bid. DOVISH outcome (15% probability): S&P rallies 1.5% on the growth-multiple relief; 10-year drops 10 bps as December-hike odds fall below 50%; dollar softens 0.5%; growth names outperform materially, with SPCX and Tesla catching a tactical bid. Our recommended positioning tilt into the release: net long AI-power (CEG, VST, TLN) at core weight, defense at heightened weight (LMT, BAH, RTX), tactical tanker equity (FRO, EURN, DHT), cash at 15% allocation into the 2:00 print, and Micron on any pullback into $1,000. We are not adding SPCX in the T+2-to-T+10 window even in the dovish scenario — the mean-reversion pattern is more reliable than the tactical outcome-dependent bid.
Fig. 3 — SPCX Day 1 as N-100 member. Closed -1.49% at $159.10 — consistent with the corrected historical -1.13% Day 1 pattern.
One additional framework worth internalizing. Warsh's stated preference for less forward guidance means that the Minutes format itself is likely to evolve over coming quarters. Today's release is the first data point on whether Warsh has restructured the Minutes process. Watch specifically for: (a) length (shorter than recent 6,000-8,000 word Minutes would signal Warsh's editorial hand), (b) tone (more direct language would signal a Warsh-driven shift away from Fed-speak hedging), (c) member-attribution (specifically named versus generalized 'many participants' framing). Any structural shift in the Minutes format itself is meaningful information about Warsh's operating model as Chair.
8. ANALYST CALLS DRIVING ACTION
Upgrades / target hikes: Wells Fargo raised LMT to $655. JPMorgan raised Booz Allen (BAH) to $210. Bernstein raised Frontline (FRO) further to $28 on continued Hormuz risk premium. Goldman raised Delta (DAL) to $88 on the labor-cooling read for jet-fuel demand.
Downgrades / target cuts: Wedbush cut Micron (MU) PT to $1,350 from $1,500 on Samsung read-through. Bernstein cut Nvidia (NVDA) PT to $195. Wells Fargo cut Broadcom (AVGO) to $1,780. Morgan Stanley cut ServiceNow (NOW) further to $800.
Asia: A weaker session on continued chip weakness. Nikkei -0.37%, Hang Seng -0.30%, Shanghai -0.19%. Samsung down another 1.8% on the Q2 read-through. Yen firmed modestly to 158.85 as the pre-FOMC-Minutes tape leaves policy-divergence pricing at neutral.
Europe: Modestly positive. Stoxx 600 +0.21%, FTSE +0.06%, DAX +0.15%. ECB commentary quiet this morning. EUR/USD extended to 1.0710 on the modest dollar softening.
Emerging markets: Broadly firmer on the softer dollar. India, Korea, Indonesia all in the green. China Hang Seng consolidating recent gains.
11. WEEK AHEAD PREVIEW
Today — KEY: FOMC Minutes at 2:00 PM (Warsh's first minutes release).
Thursday: Weekly claims + PPI at 8:30; 10Y Treasury auction 1:00.
Friday — KEY: JUNE CPI at 8:30. Consensus +0.27% core m/m / 3.2% Y/Y.
Next Tuesday: Q2 bank earnings open with JPM/WFC/C/GS.
12. THE CLOSING THOUGHT
The FOMC Minutes at 2:00 p.m. today are the most important single Fed communication event of the summer, precisely because Warsh's decision to withhold his own dot made the internal-debate transcript the primary source of his actual thinking. The 9-vs-8-vs-1 committee split creates a natural tension that the Minutes will either resolve or amplify. Our base case is a moderately hawkish outcome (60% probability) that pushes the market's rate-path pricing modestly higher. The specific language cues and cross-asset scenario matrix in Section 7 provide the framework for parsing the release live. Friday's June CPI at 8:30 a.m. provides the confirming or contradicting data point. Between the two events, the July 30-31 FOMC decision will be materially shaped. Our positioning tilt: net long AI-power at core weight, defense at elevated weight, tactical tanker equity, cash at 15% into the 2:00 print, patient on Micron and SPCX. The chip-rout tape is a symptom of the broader AI-capex-discipline thesis; it does not, on its own, break the multi-quarter framework. Trade carefully — we will be back Thursday morning with the post-Minutes read.
THE BROOKSIDE BRIEF · COMPILED 9:30 AM ET · SOURCES: CNBC / THESTREET (JULY 7 CLOSE), TECHTIMES (FOMC MINUTES PREVIEW), FEDERAL RESERVE (JUNE 17 STATEMENT), CME FEDWATCH, INVESTING.COM (DOLLAR / MINUTES FOCUS), TREASURY H.15, LLOYD'S MARKET ASSOCIATION, ASCHENBRENNER, CITRINI RESEARCH
Good morning. Two competing forces shaped Wednesday's session and set up today's tape. The FOMC Minutes released at 2:00 p.m. delivered exactly the moderately-hawkish outcome we identified as our 60% base case in yesterday's spotlight. The transcript revealed a Committee more divided and more hawkishly-tilted than the June dot plot implied on its own: several participants explicitly stated that they do not view the current policy stance as restrictive at all, and 'a few' voting members actively built a case for raising interest rates AT the June meeting rather than waiting. The 'many participants' language broke unusually — many members believe the funds rate will finish 2026 within or slightly below the current range, while 'many other' participants judged that rates will need to rise ABOVE the current target range by year-end to combat persistent inflation.
The market read the Minutes exactly as our scenario matrix implied. Equities rolled over into the close: the Dow fell more than 600 points; the S&P closed lower; the Nasdaq Composite rebounded from an intraday low of -290 as several large-cap tech names stabilized in the afternoon. Treasury yields drifted higher into the release (10-year at 4.55% at the close, 2-year at 4.18%). The dollar firmed. Then a second event compounded the setup: President Trump declared the Iran ceasefire 'over' late Wednesday afternoon, and the U.S. carried out extensive strikes against Iranian military targets overnight — hitting air defenses, drone and missile sites. Brent jumped more than 5% Wednesday to $78, but has stabilized this morning at $76.40 as Iran has not yet retaliated.
This morning's pre-open is modestly firmer. Nasdaq 100 futures are up 0.46%; S&P futures are up 0.05%; Dow futures are down 120 points (-0.22%). The 'AI trade mounting a comeback for a second day' framing is the operative narrative for the cash open. Treasury yields are steady after Wednesday's spike. Weekly initial jobless claims at 8:30 a.m. (consensus 218K, up from 215K) and existing home sales at 10:00 a.m. are the day's data events. Tomorrow's June CPI at 8:30 a.m. remains the decisive event of the week.
Today's Sector Spotlight is dedicated to one of the sharpest pieces of AI-capex analysis published this year: Groundbreaker's July 2 Substack essay, 'The Second Derivative: Why No One Understands the AI Boom.' The piece extends and systematizes the AI-capex-discipline framework we walked through on June 18 (Citrini) and June 24 (Marvell customer concentration). Its central argument: the market is pricing AI as a technology cycle when its actual anatomy is that of a credit-driven real estate cycle, and the structure will break not on demand collapse but on demand deceleration — the second derivative — which has already rolled over while every level chart still points to the sky. Three richly-annotated charts walk through the argument.
2. MARKETS AT A GLANCE
U.S. EQUITY FUTURES (PRE-OPEN, AI COMEBACK CONTINUES)
Asset
Last
Change
% Chg
S&P 500 (ES)
7,445
+4
+0.05%
Nasdaq 100 (NQ)
25,875
+134
+0.46%
Dow (YM)
52,340
-120
-0.22%
Russell 2000 (RTY)
2,382
+3
+0.13%
PRIOR CLOSE (WEDNESDAY, JULY 8 — HAWKISH MINUTES + IRAN CEASEFIRE OVER)
Asset
Last
Change
% Chg
S&P 500
7,441.28
-62.57
-0.83%
Nasdaq Composite
25,741.35
-77.34
-0.30%
Dow Jones Industrial Avg.
52,321.10
-604.05
-1.14%
Russell 2000
2,379.20
-12.60
-0.53%
VIX
20.40
+1.20
+6.25%
RATES & FX — YIELDS STEADY AFTER WED SPIKE
Asset
Last
Change
% Chg
UST 2-Year
4.18%
+7 bps Wed
—
UST 10-Year
4.55%
+8 bps Wed
—
UST 30-Year
5.05%
+11 bps Wed
—
10-Yr TIPS (real)
2.20%
+9 bps
—
DXY (Dollar Index)
100.45
+0.40 Wed
+0.40%
EUR/USD
1.0665
-0.0045 Wed
-0.42%
USD/JPY
159.35
+0.50 Wed
+0.31%
COMMODITIES & CRYPTO — BRENT STABILIZES AFTER US STRIKES
Asset
Last
Change
% Chg
WTI Crude (Aug)
$74.10
+$1.25 vs Tue
Iran esc.
Brent Crude (Aug)
$76.40
+$1.20 vs Tue
US strikes
Gold (spot)
$2,135
+$11
+0.52%
Silver (spot)
$21.65
+$0.15
+0.70%
Bitcoin
$85,100
-$300
-0.35%
ASIA & EUROPE (INTRADAY)
Asset
Last
Change
% Chg
Nikkei 225
39,105
-235
-0.60%
Hang Seng
21,880
-105
-0.48%
Shanghai Composite
3,185
-7
-0.22%
Stoxx Europe 600
568.30
-2.10
-0.37%
FTSE 100
8,860
-20
-0.23%
DAX
20,430
-55
-0.27%
3. TOP STORIES
FOMC Minutes: Hawkish As Base Case Implied — Some Members Wanted to Hike AT June Meeting
The FOMC Minutes from the June 16-17 meeting released at 2:00 p.m. Wednesday and landed materially within the hawkish scenario we identified as the 60% base case. The most important disclosure: 'A few' voting members actively built a case for RAISING interest rates at the June meeting itself — not merely projecting hikes in the SEP, but arguing for immediate action. 'Several participants' stated they do not view the current policy stance as restrictive at all. The 'many participants' vs 'many other participants' split on the year-end path was explicit: half saw the funds rate at or slightly below the current 3.50-3.75% range, the other half judged rates would need to move ABOVE current range by year-end. Warsh's task force framework was referenced explicitly, confirming the institutional overhaul is real. CME FedWatch responded: December-hike odds moved from ~55% to ~72%; September-hike odds moved from ~15% to ~28%.
Trump Declares Iran Ceasefire 'Over' — US Strikes Overnight
President Trump declared the Iran ceasefire 'over' late Wednesday afternoon following unspecified 'unacceptable actions' by Iran-backed forces. The U.S. military carried out extensive strikes overnight against Iranian military targets including air defenses, drone storage, and ballistic missile sites. Brent jumped more than 5% Wednesday to $78 on the announcement but has stabilized at $76.40 this morning as Iran has not yet retaliated. Consistent with the June 27-28 cycle, the market's initial reaction is muted; the trade will pivot on whether the current U.S. posture prompts a proportional Iranian response or leaves the strait commercial-traffic-open. War-risk insurance premiums on Hormuz-transiting vessels widened to 0.70% overnight (up from 0.55% Tuesday, back toward the June 27 peak of 0.75%).
Nasdaq Bounces From Intraday Lows — AI Comeback Extends
The Nasdaq Composite closed at 25,741.35, down 0.30% — but the intraday tape was much worse before an afternoon recovery. The index was down more than 290 points at the intraday low (-1.14%) before large-cap tech stabilized in the last two hours of trading. Nvidia recovered from -3.2% intraday to close -1.4%; Broadcom, Micron, and Marvell all followed a similar path. This is the 'AI comeback for a second day' narrative that has framed today's pre-open. The Dow, meanwhile, took the full brunt of the hawkish-Minutes-plus-Iran-escalation setup — closing down 604.05 points (-1.14%).
Weekly Claims + Existing Home Sales Today; June CPI Tomorrow
Today's data calendar has two 8:30 a.m. releases and one 10:00 a.m. Weekly initial jobless claims (consensus 218K, up from 215K), 10-year Treasury auction at 1:00 p.m. Existing home sales at 10:00 a.m. (consensus 3.98M annualized rate). Tomorrow's June CPI at 8:30 a.m. is the decisive event: consensus Core CPI +0.27% m/m and +3.2% Y/Y. Given the hawkish Minutes and the Iran-driven inflation-expectations widening overnight, the risk-reward on CPI is now materially asymmetric to the upside. A hot print (>+0.32% core m/m) drives December-hike odds toward 80% and could trigger another semi-led rout on duration math.
Q2 Bank Earnings Open Tuesday — JPM, WFC, C, GS
The Q2 earnings season formally opens Tuesday July 14 with JPMorgan, Wells Fargo, Citigroup, and Goldman all reporting pre-open. The setup for banks is distinctly favorable — the steepened curve (10Y-3M spread has expanded ~40 bps since the FOMC) supports NIM expansion; M&A picked up meaningfully in Q2; trading revenue expected strong. We expect JPM and GS to modestly beat consensus and guide 2026 NII higher; WFC to beat on credit quality; C to beat on trading but guide cautiously on wealth-management build-out. Delta reports Thursday July 16, PepsiCo same day.
The Minutes have shifted the near-term Fed path meaningfully hawkish. December-hike odds are now at ~72% per CME FedWatch (up from ~55% pre-print); September-hike odds at ~28% (up from ~15%). The 'many other participants' who see rates needing to be higher by year-end represents a durable hawkish core within the Committee, and the disclosure that 'a few' members wanted to hike AT the June meeting itself is the sharpest hawkish signal we have seen in a Fed communication since 2022. The July 30-31 FOMC decision is now more asymmetric: the market is pricing a hold, but the risk of a 25 bp hike is meaningfully non-zero.
Tomorrow's June CPI at 8:30 a.m. is the decisive event. Consensus Core CPI +0.27% m/m / +3.2% Y/Y; Headline +0.30% m/m / +3.4% Y/Y. Given the Iran-driven energy widening overnight and the hawkish Minutes tone, a hot print (>+0.32% core m/m) pushes December-hike odds toward 80% and could trigger a meaningful risk-off across duration and growth. A soft print (<+0.20% core m/m) would materially unwind the post-Minutes hawkish repricing. We assign roughly 45% probability the print lands in the +0.20% to +0.32% consensus range, 40% upside risk (increased from 25% Monday given the Iran flare-up), 15% downside.
HOW THE MINUTES CHANGED THE Q3 RATE-PATH DEBATE
The June 17 dot plot had already established that 9 members projected hikes by year-end. Yesterday's Minutes made two specific incremental disclosures that harden the hawkish read. First, 'a few' members were building a case for hiking AT the June meeting — meaning the true hawkish caucus is larger than the dot plot alone implied (3 members saw one hike, 6 saw two, but if 'a few' members wanted immediate action, the intensity of the hawkish position is elevated). Second, the 'several participants' language on 'not restrictive at all' means at least 5-9 members explicitly disagree with the standard 'restrictive' framing that has underpinned the Powell-era rate stance. That is a fundamental reframing of how the Committee thinks about the current level. Third — and this may be the most durable takeaway — the Minutes revealed Warsh's task force framework is being actively deployed, with references to communications and data-sources reviews. The Powell-era Fed is genuinely being restructured. The 'meeting-by-meeting' data-dependent framework Warsh articulated at the June press conference is not rhetorical — it is the operating model. That means every macro print becomes a live policy moment, which structurally raises the term premium embedded in long-dated yields. It also means Friday's CPI is a bigger event than any single CPI print has been in three years.
5. ECONOMIC CALENDAR — THIS WEEK
Day
Time (ET)
Release
Consensus / Actual
Tue 7/07
Open
SPCX N-100 debut (done)
−1.49% Day 1
Wed 7/08
2:00 PM
FOMC Minutes — released
HAWKISH ✓
Wed 7/08
PM
Trump: Iran ceasefire OVER
Brent +5%
Thu 7/09
Overnight
US strikes on Iranian mil. targets
Brent to $76.40
Thu 7/09
8:30 AM
Initial Jobless Claims
218K est
Thu 7/09
10:00 AM
Existing Home Sales
3.98M
Thu 7/09
1:00 PM
10-Year Treasury Auction
—
Fri 7/10
8:30 AM
JUNE CPI — KEY
+0.27% core m/m / 3.2% Y/Y
Mon 7/13
AM
Q2 season early names
—
Tue 7/14
Pre-open
JPM / WFC / C / GS — Q2 banks
Q2 season opens
Wed 7/15
AM
JNJ / UNH earnings
—
Thu 7/16
Pre-open
Delta (DAL) / PEP
—
6. EARNINGS WATCH
Q2 season opens Tuesday July 14 with JPMorgan, Wells Fargo, Citigroup, and Goldman all reporting pre-open. Banks setup remains distinctly favorable: steepened curve supports NIM; M&A picked up in Q2; capital markets robust. Delta + PEP Thu July 16. Netflix following Monday. Nvidia Q2 early August remains the marquee AI event — and with the Second Derivative framework in Section 7 as the operative positioning lens, Nvidia's disclosure moves from 'important' to 'defining' the Q3-Q4 tape.
7. SECTOR SPOTLIGHT: THE SECOND DERIVATIVE — GROUNDBREAKER'S FRAMEWORK
Groundbreaker's July 2 Substack essay, 'The Second Derivative: Why No One Understands the AI Boom,' is one of the most rigorous pieces of AI-capex analysis we have encountered this cycle. It systematizes and extends the framework we walked through on June 18 (Citrini's trillion-to-trillions gap) and June 24 (Marvell's customer concentration). Today's spotlight walks through its central arguments, adapts its three most consequential charts, and identifies the positioning implications for the balance of 2026.
The essay's opening premise is a corrective to how the market remembers 2008. The conventional causal story — lax underwriting, prices fell, borrowers defaulted, securities detonated — is, as a matter of sequence, wrong. Subprime delinquencies inflected UPWARD in 2006 while national home-price appreciation was still POSITIVE but decelerating. The subprime machine did not run on prices; it ran on the change-in-prices, and more precisely on the change-in-that-change. The financial structure required ever-accelerating appreciation to keep refinancing its way out of its own reset schedule. When appreciation stopped accelerating, the structure began breaking — a full year before prices actually fell.
That deceptively-simple sequence — level (S), first derivative or velocity (S′), second derivative or acceleration (S″) — provides the framework Groundbreaker applies to the AI-capex tape. Markets are instrumented to observe the first two (sell-side forecasts model levels; momentum strategies trade velocity) and almost entirely blind to the third. That structural blindness is precisely where regime-change information lives.
Fig. 1 — Big-four hyperscaler capex. $150B (2023) → $1.1T (2027E). Growth rates +51%/+81%/+77%/+52%. Acceleration peaked +30pp, rolled over to −4pp, then −25pp.
Consider the big-four hyperscaler capex chart above. As a level, the numbers are the largest private capital-formation event in history. $150 billion in 2023; $226 billion in 2024; $410 billion in 2025; an estimated $725 billion in 2026; approaching $1.1 trillion in 2027. As a first derivative, growth rates read +51%, +81%, +77%, +52%. Every level chart still points to the sky. But watch the acceleration. The second derivative peaked at roughly +30 percentage points into 2025 and has already turned negative: about -4 points, then about -25. Growth is still high in absolute terms. But it has stopped accelerating. Under Groundbreaker's framework, this is the 2006-analog signal — the moment the structure begins breaking, well before any level or velocity indicator would show it.
The essay's second argument reframes the analogy itself. The market is asking 'is AI a bubble like dot-com?' and producing dot-com answers — maybe leaders survive, maybe multiples compress, maybe 50% drawdown-and-recover. That framing is, per Groundbreaker, a category error. The AI buildout is not primarily equity-financed the way 2000 was. It is increasingly financed by contracted future cash flows and borrowing against hardware: take-or-pay capacity deals, GPU-collateralized term loans, off-balance-sheet vehicles, asset-backed notes sold to insurers. That is not the architecture of 2000. That is the architecture of 2008. And every feature of the AI buildout — a data center on entitled land, debt-financed against structure, leased to tenants on take-or-pay terms — is a real estate cycle in disguise. This is not a software business that happens to own servers. It is a real estate business that happens to compute.
The essay's third argument concerns the borrower at the center of the AI credit structure: OpenAI. OpenAI's valuation trajectory measured as a level is the most remarkable appreciation in the history of private markets — roughly $86B early 2024, then $157B, $300B, $500B, $852B by early 2026. Measured as a rate of change (the round-over-round step-up), the same series inverts: 1.83x, 1.91x, 1.67x, 1.70x, and falls to roughly 1.23x implied by the reported public-offering target. Under Groundbreaker's frame, this deceleration is not arbitrary. It reflects two structural headwinds directly attacking the revenue growth the marks require: token efficiency (routing simple queries to cheap models, trimming 'thinking' tokens) and Chinese open-weight competition (repricing the commodity middle of inference to near-zero, capturing over 60% of OpenRouter tokens at a fraction of the price). Revenue still grows — adoption is real — but the RATE of growth is precisely what is under attack, and the rate is what the next mark needs to clear. This is, per the essay, the most probable explanation for OpenAI's recent IPO delay: the implied IPO step-up is both the lowest in the sequence and the hardest to negotiate, and the S-1 the borrower would have to file exposes exactly the fragility that makes the refinance necessary in the first place.
Fig. 3 — The loan book. ~$1.05T of the big-four hyperscalers' ~$2.1T backlog is owed by OpenAI and Anthropic — a concentrated credit exposure the market prices as forward demand.
The most consequential specific claim in the essay is the reframing of Wall Street's beloved 'RPO backlog' as a loan book. Roughly $2.1 trillion of aggregate contracted backlog sits across the big-four hyperscaler balance sheets. About half — on the order of $1.05 trillion — is owed by OpenAI and Anthropic specifically. Microsoft's book is ~49% these two names; Oracle's is 54% (with roughly $300 billion owed by OpenAI alone); Google's is 43%; Amazon's is 51%. When Wall Street values RPO as 'forward revenue,' it is in reality valuing a concentrated credit exposure to two firms with no independent operating income. Groundbreaker separates the two: Anthropic is a speculative-grade credit but highly insulated (80% enterprise revenue, unit economics above water, protected by a 'monoline wrap' from Google and Broadcom guarantees on the $35B Apollo/Blackstone TPU facility). OpenAI is the 'naked' borrower — ~60% consumer revenue, burn at ~57% of revenue through 2027, cumulative cash destruction marching toward $115B by 2029, no independent path to positive cash flow this decade. And critically: OpenAI has no real co-signer since Microsoft stripped exclusivity and revenue share in April 2026.
THE REFLEXIVE FLIP — WHEN THE ARMS RACE ENDS
The essay's most tradeable argument is about how the equilibrium ends. The hyperscaler capex arms race is a Nash equilibrium, but a conditional one: it holds only while the market rewards the next dollar of spending as a call option on growth. In that regime, every CFO spends because every other CFO is spending and the multiple rewards the spender. Morgan Stanley's Delta One desk caught the psychology exactly: 'The first hyperscaler to signal that it can slow the pace of spending will likely see its share price rewarded (and will crush semiconductor stocks). If that happens, others will take notice. That is the reflexivity that ultimately stalls the capex cycle - not a lack of demand, but investors deciding that incremental returns on the next dollar of spend are no longer attractive.' The flip is a coordination inversion, not a gradual repricing. The day the market cheers a cut is the day the arms race ends. Groundbreaker's identification of the most likely first-mover is Meta: Zuckerberg holds dual-class control, has run this exact playbook before (2022's 'Year of Efficiency,' rewarded with a tripling of the stock), and Meta has the weakest direct AI-capex monetization (no public cloud). Google will not blink (TPU cost advantage; $460B+ cloud backlog). Oracle cannot blink (86% of sales to capex; balance sheet stretched around Stargate). Amazon may be forced (FCF already turning negative). The positioning implication is significant: watching for the first hyperscaler capex cut announcement, and buying that name aggressively into the initial equity reaction, is a genuinely asymmetric setup for H2 2026 and H1 2027.
Our synthesis and positioning implications. The Second Derivative framework does not, in our view, invalidate the multi-quarter AI-capex thesis we have carried since May. Micron's June 24 print validated that HBM supply is genuinely sold out through 2027; the AI-power complex is genuinely capacity-constrained; the physical-AI picks-and-shovels have genuinely-visible revenue trajectories. What the essay does is meaningfully sharpen the framework for identifying which names have durable structural exposure (the picks-and-shovels: CEG, VST, TLN, GEV, ETN, PWR, SYM, CGNX, TER, MU) versus which have exposure that is contingent on the second-derivative continuing to accelerate (the customer-concentrated names: MRVL via hyperscaler concentration; ORCL via OpenAI concentration; the neoclouds; and tactically SPCX via post-IPO xAI-adjacency). It also strengthens our preference for MSFT and GOOGL over ORCL and META within the hyperscaler set — MSFT walked away from OpenAI structurally in April 2026 (the most-informed counterparty shortening duration on the credit); GOOGL has the strongest cloud backlog with the best diversification. The July 30-31 FOMC decision and the August Nvidia Q2 print are the two catalysts that could accelerate or delay the reflexive flip.
8. ANALYST CALLS DRIVING ACTION
Upgrades / target hikes: Goldman raised MSFT PT to $615 on the Second-Derivative-aware AI-capex framing. Morgan Stanley raised Alphabet (GOOGL) to $245. Bernstein raised Booz Allen (BAH) to $215. Wells Fargo raised LMT to $665.
Downgrades / target cuts: Wedbush cut Oracle (ORCL) PT to $195 on OpenAI-concentration read. Bernstein cut Nvidia (NVDA) further to $190. Wells Fargo cut CoreWeave (CRWV) to $75. Morgan Stanley cut ServiceNow (NOW) further to $780.
9. STOCKS TO WATCH
MSFT / GOOGL — Citrini-preferred and Second-Derivative-preferred hyperscalers. Cleanest capex-to-revenue conversion. Goldman MSFT to $615; MS GOOGL to $245.
CEG / VST / TLN — AI-power core. Contracted cash flows; not dependent on hyperscaler capex acceleration.
Meta (META) — Watch for capex commentary — Groundbreaker identifies Meta as most likely first-mover to cut. Position for the tape-reaction if cut announced.
CoreWeave (CRWV) — Wells Fargo cut to $75. Neocloud spread-trade is the most fragile structure.
NOW / ADBE — Continue to trim on multiple compression.
TLT — Duration under renewed pressure from hawkish Minutes; watch Fri CPI.
10. GLOBAL MACRO SNAPSHOT
Asia: Weaker session on Wednesday's hawkish U.S. tape and Iran re-escalation. Nikkei -0.60%, Hang Seng -0.48%, Shanghai -0.22%. Samsung -1.1% on continued Q2-guidance overhang. Yen weakened to 159.35 on the yield-driven dollar strength.
Europe: Modestly negative. Stoxx 600 -0.37%, FTSE -0.23%, DAX -0.27%. Energy provided relative outperformance on oil bid. ECB commentary quiet.
Emerging markets: Risk-off on dollar strength + Iran. India, Korea, Indonesia all weaker.
11. WEEK AHEAD PREVIEW
Today: Claims + existing home sales 8:30/10:00; 10Y auction 1:00.
Friday — KEY: JUNE CPI at 8:30. Consensus +0.27% core m/m / 3.2% Y/Y.
Nvidia Q2 early August remains the marquee AI event.
12. THE CLOSING THOUGHT
Yesterday's tape delivered exactly the hawkish-Minutes + Iran-escalation setup we identified as our base case going in. The moderately-hawkish Minutes have shifted the December-hike odds to ~72%; Trump's declaration that the Iran ceasefire is over has pushed oil back to $76.40 with war-risk insurance re-widening; the AI-comeback narrative is fragile but persistent. Tomorrow's CPI is the make-or-break event of the week. Today's Section 7 dedicated to Groundbreaker's Second Derivative essay is, on our reading, the sharpest positioning framework published for AI-capex exposure this year — not because it invalidates the multi-quarter thesis but because it materially sharpens which names have durable structural exposure and which have exposure contingent on the second derivative continuing to accelerate. The picks-and-shovels (AI-power, physical-AI, Micron) survive and extend regardless of the reflexive flip. The customer-concentrated names (Marvell, Oracle, the neoclouds) do not. The hyperscalers bifurcate: MSFT and GOOGL are preferred; ORCL and META (though META is potentially the first-mover cut) are under structural pressure. We continue to favor cash at elevated allocation (15%) into tomorrow's CPI and next week's bank earnings. Trade carefully — the Second Derivative framework is the operative lens for the balance of 2026.
THE BROOKSIDE BRIEF · COMPILED 9:30 AM ET · SOURCES: CNBC / THESTREET (JULY 8 CLOSE), TECHTIMES / GOLDSILVER (FOMC MINUTES), FED (JUNE MINUTES + JUNE STATEMENT), CME FEDWATCH, GROUNDBREAKER 'THE SECOND DERIVATIVE' (JULY 2, 2026, HTTPS://GROUNDBREAKER.SUBSTACK.COM), MORGAN STANLEY (RATES DESK / DELTA ONE), CITRINI RESEARCH, ASCHENBRENNER, LLOYD'S MARKET ASSOCIATION
MORNING EDITION · FRIDAY, JULY 10, 2026 · AI RALLY EXTENDS · CPI NOW TUE · VIX 18.6
Daily Markets Briefing
The Brookside Brief
Markets · Macro · The Day Ahead
EDITOR'S NOTE — TWO CORRECTIONS FROM PRIOR BRIEFS
First: June CPI has been on our calendar as Friday July 10 for several briefs running. The actual BLS release date is Tuesday July 14 at 8:30 a.m. ET — the same morning as the Q2 bank earnings open. This is a calendar error we've been carrying and want to correct explicitly. Today (July 10) is a genuinely lighter session on the data side than we had positioned for. Second: yesterday's brief used a dark-navy 'editorial' chart style adapted from Groundbreaker's Substack aesthetic. Feedback was that the figures came out oddly in the docx — the dense annotations and dark background did not read as cleanly as intended. Today's charts use a lighter, WSJ-newspaper-style palette (cream background, larger typography, fewer overlapping labels) with the same analytical structure. We will iterate further as needed.
1. THE MORNING SETUP
Good morning. Yesterday's tape delivered a substantially stronger day than we characterized in yesterday's pre-open framing. The S&P 500 rallied 0.81% to 7,543.64, the Nasdaq Composite jumped 1.30% to 26,206.89, and the Dow added 139.02 points (+0.27%) to 52,487.41. Semiconductors led the tape decisively: the SMH (VanEck Semi ETF) climbed 2.5%, led by Micron up 4.5%. The 'AI comeback for a second day' framing we noted in the pre-open turned into a genuine third-day rally by the close. Weekly initial jobless claims fell 4,000 to 215K for the week ended July 4 — below the 218K consensus and the lowest reading since May 23.
Two crosswinds shaped Thursday's session in ways worth flagging. First, the Iran situation quieted materially through the day. The overnight U.S. strikes on Iranian air-defense and missile-site infrastructure appear to have produced no immediate proportional retaliation from Tehran, and by Thursday afternoon the risk-off tone from Wednesday's ceasefire-declaration-over headline had fully dissipated. Oil retraced further: WTI to $71.85, Brent to $74.20. Second, the hawkish FOMC-Minutes tape from Wednesday found its footing in the equity market through a specific mechanical response — the yield curve steepened meaningfully (the 10Y-3M spread expanded to +42 bps by Thursday's close from -2 bps pre-FOMC), and that steepening supports bank NIM expansion, which is the setup for the Q2 bank earnings that open Tuesday.
Today's calendar is genuinely quiet. There are no data releases of consequence on the U.S. calendar. Federal Reserve balance-sheet data comes out at 2:00 p.m. ET (as it does every Friday); Consumer Credit at 3:00 p.m. Otherwise the tape is shaped by positioning into next week's binary events: June CPI at 8:30 a.m. Tuesday, Q2 bank earnings pre-open Tuesday, and June PPI Thursday. The market is coming off two-and-a-half consecutive winning sessions for the AI-semi complex on the back of Thursday's Micron-led rally.
Today's Sector Spotlight steps back from macro and takes the natural setup Tuesday creates: a Q2 bank earnings preview covering JPMorgan, Goldman Sachs, Wells Fargo, and Citigroup. The three charts we walk through cover the yield-curve steepening that drives the NIM tailwind, the consensus estimates for each bank, and the recent bank-stock performance (which has created a meaningfully elevated bar the Tuesday prints must clear).
2. MARKETS AT A GLANCE
U.S. EQUITY FUTURES (PRE-OPEN, QUIET FRIDAY)
Asset
Last
Change
% Chg
S&P 500 (ES)
7,548
+5
+0.06%
Nasdaq 100 (NQ)
26,240
+35
+0.13%
Dow (YM)
52,510
+25
+0.05%
Russell 2000 (RTY)
2,395
+3
+0.13%
PRIOR CLOSE (THURSDAY, JULY 9 — AI RALLY EXTENDS, IRAN QUIETS)
Asset
Last
Change
% Chg
S&P 500
7,543.64
+60.53
+0.81%
Nasdaq Composite
26,206.89
+336.15
+1.30%
Dow Jones Industrial Avg.
52,487.41
+139.02
+0.27%
Russell 2000
2,391.80
+8.90
+0.37%
VIX
18.60
-1.80
-8.82%
RATES & FX — YIELDS STEADY AFTER WED SPIKE
Asset
Last
Change
% Chg
UST 2-Year
4.15%
-3 bps Thu
—
UST 10-Year
4.51%
-4 bps Thu
—
UST 30-Year
5.02%
-3 bps Thu
—
10Y-3M Spread
+42 bps
+50 bps vs pre-FOMC
—
DXY (Dollar Index)
100.10
-0.35 Thu
-0.35%
EUR/USD
1.0725
+0.0060 Thu
+0.56%
USD/JPY
158.75
-0.60 Thu
-0.38%
COMMODITIES & CRYPTO — OIL RETRACES FURTHER
Asset
Last
Change
% Chg
WTI Crude (Aug)
$71.85
-$2.25 Thu
-3.04%
Brent Crude (Aug)
$74.20
-$2.20 Thu
-2.88%
Gold (spot)
$2,145
+$10 Thu
+0.47%
Silver (spot)
$21.85
+$0.20 Thu
+0.92%
Bitcoin
$86,400
+$1,300 Thu
+1.53%
ASIA & EUROPE (INTRADAY)
Asset
Last
Change
% Chg
Nikkei 225
39,470
+305
+0.78%
Hang Seng
22,105
+225
+1.03%
Shanghai Composite
3,205
+20
+0.63%
Stoxx Europe 600
570.10
+1.80
+0.32%
FTSE 100
8,890
+30
+0.34%
DAX
20,505
+75
+0.37%
3. TOP STORIES
AI Rally Extends — Micron +4.5%, SMH +2.5%
Thursday's tape delivered the third consecutive session of AI-semi outperformance and the strongest single-day rally in the complex since the June 24 Micron print. Micron itself climbed 4.5% on a combination of analyst-desk repositioning after the hawkish-Minutes-driven consolidation and the continued read-through from the $50 billion FQ4 guide. Nvidia gained 2.2%. Broadcom rose 1.8%. The broader SMH ETF rose 2.5% — the strongest single-day print for the semi complex since late June. That the semi-led rally coincided with a small dovish tick in the front-end yields (2-year fell 3 bps to 4.15%) is notable — the 'AI trade catches a bid on the first sign the yield jump has stalled' pattern that has characterized this cycle is playing out cleanly.
Weekly Claims at 215K — Lowest Since May 23
Initial jobless claims for the week ended July 4 came in at 215,000 — down 4,000 from the prior week's 219K (revised) and well below the 218K consensus. The 215K print is the lowest reading since May 23. Continuing claims increased modestly by 8,000 to 1.814 million. The labor tape continues to defy the participation-collapse narrative from the June NFP: neither the initial claims path nor the continuing claims trajectory shows evidence of accelerating separations. That is genuinely supportive of the hawkish Fed setup, and consistent with the Minutes' hawkish framing that policy is 'not restrictive at all.'
Iran Situation Quiets — Oil Retraces Further
The Iran situation quieted materially through Thursday. The overnight U.S. strikes on Iranian military infrastructure appear to have produced no immediate proportional retaliation from Tehran, and by Thursday afternoon the risk-off posture from Wednesday's ceasefire-declaration had fully dissipated. Oil retraced further: WTI to $71.85, Brent to $74.20 — both roughly $5 below the Wednesday-PM peaks. War-risk insurance premiums on Hormuz-transiting vessels tightened modestly back to 0.65% (from 0.70% Wednesday-Thursday intraday peak). The Doha technical talks are reportedly continuing, though with a lower-key posture.
CPI Rescheduled Read: Tuesday July 14, 8:30 AM
A calendar correction we want to make explicit: the June CPI release has been on our calendar as Friday July 10 for several briefs. The actual BLS release date is Tuesday July 14 at 8:30 a.m. ET — the same morning as JPM, WFC, C, and GS report Q2 earnings. That creates an unusually consequential 8:30-a.m. window: hot CPI + strong bank prints would extend the steepened-curve, defensive-rotation-tilt narrative meaningfully; soft CPI + strong bank prints would deliver a genuinely risk-on setup for the balance of July.
Q2 Bank Earnings Tuesday — Setup Favorable
JPMorgan, Wells Fargo, Citigroup, and Goldman all report Q2 pre-open Tuesday. The setup is favorable: the steepened yield curve supports NIM expansion; M&A picked up in Q2; capital markets robust. Section 7 walks through the specific estimates and the elevated bar bank stocks have created going into the print.
4. MACRO & FED WATCH
The macro debate for the balance of July collapses to a single Tuesday morning. At 8:30 a.m., BLS releases June CPI (consensus Core +0.27% m/m / +3.2% Y/Y; Headline +0.30% / +3.4% Y/Y). Also at 8:30 a.m., JPMorgan, Wells Fargo, and Citigroup report Q2 earnings; Goldman follows within the same window. The two events create asymmetric positioning tension we have not seen in a single-morning window since 2022.
The CPI setup remains asymmetric to the upside given the Iran-driven overnight widening and the hawkish Minutes tape. A hot print (Core >+0.32% m/m) drives December-hike odds toward 80% and could trigger a meaningful risk-off across duration and growth on the same morning the banks report. A soft print (Core <+0.20% m/m) would materially unwind the post-Minutes hawkish repricing and would combine with strong bank prints to deliver a genuinely risk-on setup. Our probability distribution: 45% in-range (+0.20% to +0.32%), 40% upside risk, 15% downside. This is meaningfully more bearish-tilted than we ran into the June CPI release given the Iran overhang and the labor tape.
The Fed calendar beyond CPI is quiet through the July 30-31 FOMC. No FOMC speakers today; two 'blackout' days ahead of the meeting begin July 20. The market will read the June CPI print and the Q2 bank earnings together, and the July 30-31 meeting decision — currently priced at 95% probability of a hold — will be shaped meaningfully by the Tuesday morning combined signal.
5. ECONOMIC CALENDAR — CORRECTED
Day
Time (ET)
Release
Consensus / Actual
Wed 7/08
2:00 PM
FOMC Minutes — released
HAWKISH ✓
Wed 7/08
PM
Trump: Iran ceasefire OVER
Brent +5%
Thu 7/09
8:30 AM
Claims 215K (released)
Below 218K est
Thu 7/09
Close
AI rally extends
Nasdaq +1.30%
Fri 7/10
2:00/3:00 PM
Fed Balance Sheet / Consumer Credit
—
Mon 7/13
AM
Quiet
—
Tue 7/14
8:30 AM
JUNE CPI — KEY
+0.27% core m/m est
Tue 7/14
Pre-open
JPM / WFC / C / GS — Q2 banks
Q2 season opens
Wed 7/15
Pre-open
JNJ, UNH earnings
—
Wed 7/15
8:30 AM
Empire State Manufacturing
-2.5
Thu 7/16
8:30 AM
JUNE PPI
+0.2% m/m est
Thu 7/16
Pre-open
Delta (DAL) / PEP
—
Fri 7/17
8:30 AM
Retail Sales / Building Permits
—
6. EARNINGS WATCH
Q2 season opens Tuesday July 14 with the big banks — JPM, WFC, C, GS all pre-open. See Section 7 for the detailed preview. Wednesday July 15: JNJ, UNH. Thursday: Delta (DAL), PepsiCo. Netflix reports the following Monday. Nvidia's Q2 in early August remains the marquee AI-infrastructure event — with the Second Derivative framework from yesterday as the operative lens, Nvidia's disclosure moves from 'important' to 'defining' the Q3-Q4 tape.
7. SECTOR SPOTLIGHT: Q2 BANK EARNINGS PREVIEW
Tuesday July 14 pre-open, JPMorgan (JPM), Wells Fargo (WFC), and Citigroup (C) all report Q2 2026 earnings; Goldman Sachs (GS) follows within the same window. The setup is one of the more favorable Q2 bank earnings seasons since 2022. Three factors drive the constructive framing.
First, and most importantly, the yield curve steepening. The 10Y-3M Treasury spread has expanded by roughly 50 basis points since the June 17 FOMC — from essentially flat (-2 bps) pre-meeting to +42 bps at Thursday's close. Curve steepenings of this magnitude in a five-week window are historically associated with meaningful net-interest-margin expansion for the money-center banks. JPMorgan's Q2 NII guide is the single number to focus on: consensus is $22.5B, consistent with a modest sequential decline; the setup argues for a hold or small upside surprise, with FY26 NII guidance the swing factor for the stock's post-print reaction.
Fig. 1 — 10Y-3M Treasury spread through the FOMC-and-Minutes window. Curve steepened ~50 bps in five weeks — cleanest bank-NIM tailwind of 2026.
Second, capital markets and investment banking. Q2 was the strongest M&A environment since late 2021 by announced deal value: several megadeals in energy, biotech, and financial services closed or moved into definitive-agreement status. Advisory revenue for GS specifically is expected to inflect meaningfully — consensus $2.1B versus $1.4B a year ago. Trading revenue is also expected to beat given the elevated Q2 volatility (VIX averaged 17 in Q2 versus 13 in Q1). The FICC-vs-equities mix will matter for the specific bank reactions: GS beats cleanest on FICC beats; MS and Citi on equities beats.
Fig. 2 — Q2 2026 consensus estimates by bank. JPM the anchor at ~$43.5B revenue / $4.35 EPS; GS the beat-and-raise candidate.
Third, the credit-quality picture remains constructive despite the hawkish Fed tape. Charge-offs have stabilized at ~40-45 bps annualized across the money-center portfolios. Consumer credit-card delinquencies ticked up modestly in Q2 but from a low base. Commercial real estate remains the risk we watch most carefully — office exposure at WFC and Citi is the single-largest CRE overhang in the group. Neither bank is expected to take incremental Q2 CRE reserves beyond what's already been guided, but a surprise here would materially compress the stock reactions.
THE SPECIFIC BAR BANK STOCKS HAVE SET GOING INTO TUESDAY
Bank stocks have rallied meaningfully into Tuesday's prints — a fact that materially raises the bar the earnings must clear. Since the June 17 FOMC meeting, the bank complex has outperformed the S&P by a wide margin: JPM is +11.4%, GS +14.2%, MS +9.8%, WFC +8.3%, BAC +7.5%, C +6.2%. The regional bank ETF KRE is up 12.5%. The S&P 500 is up just 3.2% in the same window. The implication is that Tuesday's prints must not just be strong in absolute terms; they must clear elevated expectations that have already been priced into the stocks. GS in particular has moved most into the print — the +14.2% run since FOMC leaves the stock trading at roughly 13x forward earnings, meaningfully above its 10-year average of 10.5x. A GS beat gets diminished stock reaction given the run-up; a GS miss produces a much larger downside move than the earnings alone would justify.
Fig. 3 — Bank stock returns since June 17 FOMC. JPM +11.4%, GS +14.2%. S&P +3.2%. Elevated bar into Tuesday's prints.
Our positioning framework for the Tuesday setup. We maintain a core long in JPMorgan (the cleanest earnings profile with the best NIM setup and the most diversified revenue mix). We hold Goldman modestly but recognize the run-up creates asymmetric downside — we would trim into any strength on the print rather than adding aggressively. We remain cautious on Wells Fargo given residual CRE exposure. Citigroup we prefer to avoid on the print — the wealth-management build-out remains the swing factor for the FY26 guide and is the single most-likely area of negative surprise. The regional bank complex (KRE) is the most binary trade — a strong money-center print sets up KRE for continued outperformance, but any credit-quality surprise cascades harder in regionals.
8. ANALYST CALLS DRIVING ACTION
Upgrades / target hikes: JPMorgan raised BAC to $54 pre-earnings. Wells Fargo raised GS to $650 (from $625) on the trading-revenue setup. Bernstein raised JPM to $225. Morgan Stanley raised MU to $1,550 on the Q2 read-through. Goldman raised DAL to $92.
Downgrades / target cuts: BofA cut ORCL further to $185. Wedbush cut CoreWeave (CRWV) to $65. Morgan Stanley trimmed Meta (META) modestly on Second-Derivative-aware capex-monetization concerns.
9. STOCKS TO WATCH
JPM — Our core long into Tuesday's print. Bernstein PT $225. Cleanest NIM setup.
GS — Wells Fargo PT $650. +14.2% run creates asymmetric downside; trim into strength.
TLT — Curve steepening is the primary story; watch Tuesday CPI.
10. GLOBAL MACRO SNAPSHOT
Asia: Constructive follow-through session on Thursday's U.S. rally. Nikkei +0.78%, Hang Seng +1.03%, Shanghai +0.63%. Korean and Taiwan semi names all firmer on the Micron-led U.S. tape. Yen firmed to 158.75.
Europe: Modestly positive on the softer dollar and lower yields. Stoxx 600 +0.32%, FTSE +0.34%, DAX +0.37%. ECB commentary quiet through the summer break.
Emerging markets: Constructive as dollar eased and Iran quieted. India, Korea, Indonesia all firmer.
Tuesday — KEY: JUNE CPI 8:30 AM + Q2 banks (JPM/WFC/C/GS) pre-open.
Wednesday: JNJ, UNH; Empire manufacturing.
Thursday: PPI; DAL, PEP; retail sales.
Friday July 17: Housing starts.
12. THE CLOSING THOUGHT
Yesterday's tape delivered a substantially stronger third-day AI-comeback rally than the pre-open framing implied, with the Nasdaq up 1.30%, Micron up 4.5%, and the SMH up 2.5%. Weekly claims at 215K reinforced the resilient-labor tape that underpins the hawkish Fed setup. Oil retraced further as Iran quieted. Today is genuinely quiet on the data side. Tuesday July 14 becomes the single most consequential 8:30-a.m. window of the month: June CPI plus JPM, WFC, C, and GS Q2 earnings, all at the open. Our Section 7 preview walks through the bank setup in detail — the yield curve steepening is a genuine tailwind, but the bank complex has rallied 8-14% into the print, creating an elevated bar. We continue to favor JPM as the core long, trim GS on strength, remain cautious on WFC, and prefer to avoid Citi on the print. The Second Derivative framework from yesterday remains the operative AI-capex lens for the balance of 2026. Trade carefully — we will be back Monday morning with the pre-Tuesday setup.
THE BROOKSIDE BRIEF · COMPILED 9:30 AM ET · SOURCES: CNBC / THESTREET / INVESTRADE (JULY 9 CLOSE), BLS (WEEKLY CLAIMS), TREASURY H.15, CME FEDWATCH, REFINITIV (Q2 BANK CONSENSUS), MORGAN STANLEY, GROUNDBREAKER (JULY 2 SUBSTACK), CITRINI RESEARCH, ASCHENBRENNER
Good morning. Friday's session closed the week on a constructive note — the S&P 500 added 0.42% to 7,575.39, the Nasdaq Composite gained 0.29% to 26,281.61, the Dow Jones rose 149.60 points (+0.29%) to 52,637.01. Both the S&P and Nasdaq notched weekly gains after a volatile trading week. The AI-semi rally we walked through Friday extended a fourth session — Nvidia climbed roughly 4% Friday on the day, Meta Platforms jumped about 6%, and the broader tech complex posted modest breadth. Meta's specific move is worth flagging: the 6% gain came without obvious single-headline catalyst, and Meta's positioning ahead of any potential AI-capex commentary is now the single most-watched stock in the AI-capex reflexive-flip framework from Groundbreaker's Second Derivative essay we walked through last Wednesday.
The single most consequential single-name story of Friday's session was outside the U.S. large-cap tape entirely. SK Hynix — the South Korean HBM memory leader and Micron's primary competitor — completed its U.S. public listing at $170 per share, up more than 14% from its IPO pricing. The company raised approximately $26.5 billion in the U.S. share offering, making its U.S. listing the largest ever by a foreign company. For context, that dwarfs Alibaba's 2014 U.S. IPO ($25.0B) and sits second only to SPCX's June 2026 raise ($75B) among 2026 IPOs overall. The size and reception matters directly for the AI-semi complex: SK Hynix produces roughly 48% of global HBM supply, and its willingness to raise $26.5B of fresh capital in the U.S. public market is a strong signal that the demand-side trajectory for HBM is being underwritten by public investors. Section 7 walks through the read-through for Micron, Samsung, and Nvidia specifically.
The macro tape into the weekend hinges on tomorrow morning. At 8:30 a.m. ET Tuesday, BLS releases June CPI. Also at 8:30 a.m. ET Tuesday, JPMorgan, Wells Fargo, and Citigroup all report Q2 earnings pre-open; Goldman Sachs reports within the same window. That is the single most consequential 8:30-a.m. window since 2022, and Section 4 and Section 7 today walk through the framework for parsing the two events simultaneously. Consensus for CPI is Core +0.27% m/m / +3.2% Y/Y; Headline +0.30% m/m / +3.4% Y/Y. The Cleveland Fed's inflation nowcasting model is projecting June CPI Y/Y at 3.96% — the upside skew we have been carrying into the print looks broadly consistent with the nowcast.
The weekend delivered a second Iran-U.S. escalation. Overnight reports from Doha confirmed additional military exchanges between U.S. naval assets and Iranian IRGC vessels near the Strait of Hormuz. Brent has jumped back toward $80 this morning (currently $79.85, up roughly $5.60 from Friday's close). WTI is at $77.20. The oil re-widening this morning is meaningful for the CPI setup — a hot CPI print combined with an oil bid pushes the December-hike odds from ~72% back toward 80% almost mechanically. The Iran situation is the single-most-important swing factor for the trajectory of Tuesday's tape.
Today's Sector Spotlight combines a preview of tomorrow's binary CPI + Q2-banks window with a shorter piece on the SK Hynix debut and its implications for the AI-memory complex. Three charts.
2. MARKETS AT A GLANCE
U.S. EQUITY FUTURES (PRE-OPEN, WAVERING ON IRAN + CPI SETUP)
Asset
Last
Change
% Chg
S&P 500 (ES)
7,562
-13
-0.17%
Nasdaq 100 (NQ)
26,105
-135
-0.51%
Dow (YM)
52,590
-45
-0.09%
Russell 2000 (RTY)
2,388
-7
-0.29%
PRIOR CLOSE (FRIDAY, JULY 10 — WEEKLY WINS FOR SPX + NDX)
Asset
Last
Change
% Chg
S&P 500
7,575.39
+31.75
+0.42%
Nasdaq Composite
26,281.61
+74.72
+0.29%
Dow Jones Industrial Avg.
52,637.01
+149.60
+0.29%
Russell 2000
2,395.10
+3.30
+0.14%
VIX
18.90
+0.30
+1.61%
RATES & FX — 10Y EDGED BACK TO 4.56%
Asset
Last
Change
% Chg
UST 2-Year
4.16%
+1 bp Mon
—
UST 10-Year
4.56%
+5 bps vs Fri
—
UST 30-Year
5.07%
+5 bps vs Fri
—
10Y-3M Spread
+45 bps
+3 bps vs Fri
—
DXY (Dollar Index)
100.35
+0.25 Mon
+0.25%
EUR/USD
1.0698
-0.0025 Mon
-0.23%
USD/JPY
159.15
+0.40 Mon
+0.25%
COMMODITIES & CRYPTO — OIL JUMPS ON IRAN RE-ESCALATION
Asset
Last
Change
% Chg
WTI Crude (Aug)
$77.20
+$5.35 vs Fri
+7.4%
Brent Crude (Aug)
$79.85
+$5.65 vs Fri
+7.6%
Gold (spot)
$2,168
+$23 vs Fri
+1.07%
Silver (spot)
$22.10
+$0.25
+1.14%
Bitcoin
$87,200
+$800 vs Fri
+0.93%
ASIA & EUROPE (INTRADAY)
Asset
Last
Change
% Chg
Nikkei 225
39,320
-150
-0.38%
Hang Seng
22,210
+105
+0.47%
Shanghai Composite
3,215
+10
+0.31%
Stoxx Europe 600
568.20
-1.90
-0.33%
FTSE 100
8,872
-18
-0.20%
DAX
20,420
-85
-0.41%
3. TOP STORIES
SK Hynix U.S. Listing Raises $26.5B — Largest Foreign IPO in U.S. History
SK Hynix completed its U.S. share offering Friday at $170 per share, up more than 14% from the IPO price. Total proceeds of approximately $26.5 billion make this the largest U.S. listing by a foreign company ever — exceeding Alibaba's 2014 U.S. IPO ($25.0B). The Korean HBM memory leader is Micron's primary competitor in the AI-memory supply chain. The company produces approximately 48% of global HBM supply and is the primary HBM3E supplier to Nvidia's Blackwell platform. The public-market validation from institutional flow into the IPO is materially constructive for the broader HBM-supply thesis — but the specific implication for Micron is more nuanced. Section 7 walks through the read-through in detail.
Iran-U.S. Escalates Over Weekend — Brent Jumps Back to $80
The Iran-U.S. tape re-escalated over the weekend. Reports from Doha confirmed additional military exchanges between U.S. naval assets and Iranian IRGC vessels near the Strait of Hormuz. The specific triggering event was not publicly confirmed by U.S. authorities, but the incident sequence appears to follow the cadence of the June 27-28 and the July 6 tanker-attack cycles. Brent jumped roughly $5.60 to $79.85; WTI added $5.35 to $77.20. War-risk insurance premiums on Hormuz-transiting vessels re-widened overnight to 0.75% (from 0.65% Friday). The oil re-widening is meaningful for the CPI setup and creates asymmetric upside risk to Tuesday's print.
Meta Jumps 6% Friday — AI-Capex Commentary Watchpoint
Meta Platforms rose approximately 6% Friday without an obvious single-headline catalyst. Trading desks flagged the move as consistent with positioning ahead of Q2 earnings (Meta reports July 27) and possible capex-commentary anticipation. As we walked through in Wednesday's Second Derivative spotlight, Groundbreaker specifically identifies Meta as the most likely first-mover to signal AI-capex discipline — Zuckerberg holds dual-class control, ran the exact playbook in 2022 (Year of Efficiency), and Meta has the weakest direct AI-capex monetization (no public cloud). Friday's move is not confirmation of anything specific, but the positioning bias into the July 27 print is now firmly in place. The reflexive-flip framework we walked through Wednesday would treat any Meta capex-cut announcement as a genuinely asymmetric buying opportunity — trim the position modestly ahead of the print to be able to add aggressively on the initial equity reaction.
Tuesday 8:30 AM ET: CPI + Q2 Banks — The Single Most Consequential Window of the Month
The Tuesday morning window is the most consequential single-morning setup we have carried since the July 30-31 FOMC calendar was established. At 8:30 a.m. ET: June CPI (Core +0.27% m/m / +3.2% Y/Y consensus). Also at 8:30 a.m. ET: JPMorgan, Wells Fargo, Citigroup, and Goldman Sachs Q2 earnings pre-open. The interaction matters more than either event alone. Hot CPI + strong bank prints extends the steepened-curve, defensive-rotation tape meaningfully. Soft CPI + strong bank prints delivers a genuinely risk-on setup for the balance of July. Hot CPI + cautious bank prints (CRE surprise, wealth-mgmt disappointment) is the worst-case risk-off outcome. Section 4 and 7 walk through the framework.
4. MACRO & FED WATCH — TUESDAY'S BINARY SETUP
The macro debate for the balance of July collapses to Tuesday's 8:30 window. The market is currently priced for December-hike odds at ~70% per CME FedWatch and September-hike odds at ~28%. Both readings could move meaningfully by Tuesday's close. The scenario matrix (Fig. 1 in Section 7) walks through the specific cross-asset implications.
Our updated probability distribution for the June CPI print, revised modestly higher on the Iran-driven oil bid this morning: 40% hot (Core >+0.32% m/m), 45% in-line (Core +0.20% to +0.32%), 15% soft (Core <+0.20%). The Cleveland Fed inflation nowcasting model projecting June CPI Y/Y at 3.96% argues for continued upside risk to the headline. The specific mechanics we watch closely: the June energy component (given the June 12-through-July 6 oil retracement should mean headline is materially softer than April/May), the services-ex-shelter component (which has been the Fed's primary anchor for 'persistent' inflation), and the shelter component (particularly OER, which has been running above core CPI for 18 months).
The June CPI print combined with the Q2 bank earnings creates an unusually clean read of the current macro tape. If the CPI print is hot AND JPM guides FY26 NII materially higher, the read is that the yield curve steepening is durable and that inflation persistence is genuinely worse than expected. That combination supports meaningful positioning into the July 30-31 FOMC decision — and the hawkish tilt of the Minutes suggests the July decision is materially less certain (the 95% hold currently priced) than a month ago.
5. ECONOMIC CALENDAR — THIS WEEK
Day
Time (ET)
Release
Consensus / Actual
Fri 7/10
Close
S&P +0.42% / NDX +0.29% / SK Hynix debut
IPO $26.5B, +14%
Sat-Sun
Wknd
Iran-US escalation resumed
Brent to $80
Mon 7/13
Quiet
No major data
—
Tue 7/14
8:30 AM
JUNE CPI — KEY
+0.27% core m/m est
Tue 7/14
Pre-open
JPM / WFC / C / GS — Q2
Q2 season opens
Wed 7/15
Pre-open
JNJ, UNH earnings
—
Wed 7/15
8:30 AM
Empire State Manufacturing
-2.5
Wed 7/15
AM
BAC / MS Q2 earnings
—
Thu 7/16
8:30 AM
JUNE PPI
+0.2% m/m est
Thu 7/16
8:30 AM
Retail Sales (Jun)
+0.3% m/m est
Thu 7/16
Pre-open
Delta (DAL) / PEP earnings
—
Fri 7/17
8:30 AM
Housing Starts / Permits
1.35M
6. EARNINGS WATCH
Q2 season formally opens tomorrow with JPM, WFC, C, and GS all pre-open. See Friday's brief for the detailed preview; the framework hasn't changed. Wednesday brings JNJ and UNH before-open (health-care read) plus Bank of America and Morgan Stanley Q2. Thursday: PPI plus Delta and PepsiCo. Netflix reports the following Monday. Nvidia's Q2 early August remains the marquee AI event.
7. SECTOR SPOTLIGHT: TUESDAY'S SETUP + THE SK HYNIX DEBUT
This morning's spotlight has two parts. First, a compressed positioning framework for the Tuesday CPI + Q2-banks 8:30 window. Second, a shorter piece on the SK Hynix U.S. debut and its implications for the AI-memory complex.
Part I — The Tuesday CPI + Q2-Banks Setup
Tuesday's binary window is unusually consequential because the CPI print and the bank earnings interact directly rather than independently. In a normal earnings morning, market participants can trade the individual bank prints against pre-expectations without a simultaneous macro-print overhang. Tuesday's setup breaks that pattern: any given bank print will be interpreted through the lens of the CPI outcome, and the CPI print will be interpreted through the lens of the aggregate bank-earnings signal.
Fig. 1 — Same-session cross-asset reactions to CPI outcomes. Our probability distribution: 40% hot, 45% in-line, 15% soft — modestly more bearish than we ran into June CPI given Iran overhang.
The scenario matrix implies specific positioning tilts. Hot CPI + strong bank prints extends the steepened-curve, defensive-rotation tape meaningfully — banks continue to outperform, semis compress on duration math, S&P edges modestly lower on the composite. Soft CPI + strong bank prints delivers genuinely risk-on — banks rally further, semis catch a bid on the yield relief, S&P leads. Hot CPI + cautious bank prints is the worst-case outcome — CRE reserve surprises at WFC or Citi combined with a hot inflation print would compress bank multiples and force a positioning unwind across the complex.
THE SPECIFIC TAPE MECHANICS TO WATCH
In the 15 minutes between the 8:30 a.m. CPI release and the bank earnings press releases arriving on the wire, the setup is unusually thin liquidity. Bond market reacts first (in ~2 minutes to the CPI print); equity futures reprice over the next 4-6 minutes; then bank stocks either confirm or contradict the macro read as the earnings hit. That 15-minute window will produce the cleanest signal of the Q3 tape. Watch specifically: (a) the immediate 10Y yield reaction to CPI — a hot print that pushes 10Y toward 4.65% is the highest-conviction hawkish signal we could get; (b) JPM's Q2 NII actual versus $22.5B consensus, and more importantly the FY26 NII guide direction — flat or lower is a meaningful negative surprise; (c) GS advisory revenue actual versus the $2.1B consensus (which implies a 50% Y/Y beat versus $1.4B a year ago); and (d) any explicit language on CRE reserves at WFC or Citi. Our recommended trading posture into the print: 15% cash allocation carried in; small tactical long in JPM going into 8:30; short-dated puts on GS as an asymmetric hedge given the 14.2% run since FOMC; and no incremental positioning in semis until the CPI print clears.
Part II — The SK Hynix Debut and the HBM Read-Through
SK Hynix's U.S. listing Friday at a $26.5B raise and a +14% Day-1 gain is the single most consequential AI-memory event since Micron's June 24 print. Three specific implications for the broader AI-memory complex are worth walking through.
Fig. 2 — HBM market share by supplier. SK Hynix leads at 48% in 2026E (down from 52% in 2024); Micron's share has expanded to ~20% from 8%.
First, the market-share picture. SK Hynix has been the dominant HBM supplier — roughly 52% share in 2024 — but has ceded modest share to Micron over the past 18 months as Micron's HBM3E ramp has proceeded on schedule. Our current estimate for 2026: SK Hynix ~48%, Samsung ~32%, Micron ~20%. The Micron share gain is structurally meaningful — it validates the Q3 FY26 print and the FQ4 $50B guide we walked through on June 25. SK Hynix's public listing does not change Micron's trajectory in any near-term sense; if anything, it validates the demand-side signal that HBM supply is genuinely tight through 2027.
Second, the capital raise. SK Hynix raising $26.5B in a U.S. public listing is a notable positive signal for the broader AI-capex tape. Foreign issuers pursuing U.S. listings during periods of expected sector weakness typically do not clear at 14% Day-1 gains — the reception argues that institutional capital continues to view AI-memory supply as under-priced. That is directionally supportive of the AI-capex-durability thesis and modestly cuts against the Second-Derivative-framework skepticism we walked through Wednesday. The reconciliation: SK Hynix's capex trajectory is more tied to physical HBM4/4E capacity than to hyperscaler-reflexive-flip risk, and the demand-side visibility (Nvidia, AWS, Google TPU) is structurally cleaner.
Fig. 3 — SK Hynix's $26.5B raise contextualized. Largest US listing by a foreign company ever, exceeding Alibaba's $25.0B in 2014.
Third, the read for Micron and Nvidia. For Micron, the specific implication is modestly positive but not decisive. SK Hynix's listing gives long-term investors a purer-play HBM comparable, which supports Micron's multiple. But Micron's own print in Q3 already delivered the dispositive demand-side signal (HBM3E/HBM4 sold out through 2027). For Nvidia, the read is genuinely positive — SK Hynix's willingness to raise $26.5B of U.S. capital signals confidence in the ability to sustain HBM supply expansion on the Blackwell / Rubin roadmap. Nvidia's Q2 print in early August is the definitive event; the SK Hynix debut is a supportive but not conclusive incremental data point.
8. ANALYST CALLS DRIVING ACTION
Upgrades / target hikes: Morgan Stanley raised MU to $1,575 (from $1,550) on SK Hynix debut read-through. Goldman raised JPM to $232 pre-earnings. Bernstein raised NVDA to $205. Wells Fargo raised BAC to $58.
Downgrades / target cuts: Wedbush cut ORCL further to $180. BofA trimmed C modestly on wealth-mgmt build-out concerns. Morgan Stanley trimmed META modestly further on Second-Derivative-aware capex-monetization concerns.
9. STOCKS TO WATCH
JPM — Core long into tomorrow's 8:30 print. Goldman PT $232.
GS — WF PT $650. Trim into strength; asymmetric downside.
WFC — Watch CRE reserves closely.
C — Prefer to avoid; wealth-mgmt build-out is negative-surprise risk.
BAC — Reports Wednesday. WF PT $58.
MS — Reports Wednesday. Watch equities trading beat.
KRE (Regionals) — Binary on Tuesday.
SK Hynix (HYNI ADR) — Debut Friday +14%. Buyers on any post-IPO pullback.
Micron (MU) — MS raised to $1,575 on SK Hynix read-through. Buyers in $1,000-1,100.
Nvidia (NVDA) — Bernstein PT $205. Q2 August the defining event.
Gold (GLD) — Safe-haven bid firming as Iran re-escalates.
TLT — Cautious ahead of Tuesday CPI.
10. GLOBAL MACRO SNAPSHOT
Asia: Mixed. Nikkei -0.38% on Iran escalation + softer yen. Hang Seng +0.47% on continued China-property policy hopes. Shanghai +0.31%. SK Hynix in Seoul traded firm on the U.S. listing success.
Friday's session closed the week constructively with Nvidia +4%, Meta +6%, and the SK Hynix U.S. debut raising $26.5 billion at a +14% Day-1 pop — the largest foreign IPO in U.S. history. The AI-memory tape is being underwritten by institutional capital at scale. The weekend delivered a second Iran-U.S. escalation cycle, with Brent jumping back toward $80 and war-risk insurance premiums re-widening. Tomorrow's 8:30 AM window — June CPI plus JPM/WFC/C/GS Q2 earnings — is the single most consequential single-morning setup since 2022. Our probability distribution has shifted modestly more bearish given the Iran-driven overnight oil bid: 40% hot CPI, 45% in-line, 15% soft. Our positioning: 15% cash allocation carried in; core long JPM; short-dated puts on GS as asymmetric hedge; cautious on WFC and Citi; no incremental semi positioning until CPI clears; maintain core AI-power and physical-AI picks-and-shovels regardless. Trade carefully — back Tuesday morning with the initial print read.
MORNING EDITION · WEDNESDAY, JULY 15, 2026 · CPI + PPI SOFT · ALL BANKS BEAT · VIX 16.5
Daily Markets Briefing
The Brookside Brief
Markets · Macro · The Day Ahead
EDITOR'S NOTE — CRITICAL DATA CORRECTION
Reader feedback flagged material errors in our recent market-data figures. Specifically: Bitcoin has been running in the $62,000-64,000 range, not the $85,000-87,000 range we have been citing. VIX has been in the 16-16.5 range, not the 18-20 range we have been citing. These are not small errors and they impact downstream users of the brief data — specifically the macro terminal on the Brookside Brief website (index.html). We regret the inaccuracy and are correcting effective today. Both figures matter substantively: Bitcoin at ~$63K vs ~$86K represents a fundamentally different risk-appetite regime, and VIX at 16 vs 20 represents a fundamentally different equity-volatility regime. Today's brief carries the corrected data and we will be more rigorous going forward on cross-checking cryptocurrency and volatility levels alongside the equity/rates figures we verify daily.
1. THE MORNING SETUP
Good morning. Yesterday delivered the outcome we assigned only 15% probability to in Monday's spotlight: a materially SOFT June CPI print. The data landed on the dovish side of every consensus estimate we track. Headline CPI printed -0.4% month-over-month versus a consensus of -0.2%. Headline Y/Y came in at 3.5%, well below the 3.8% consensus. Core CPI was FLAT for the month (0.0% versus +0.2% consensus), taking the 12-month rate down to 2.6% from 2.9% consensus. This is a comprehensive dovish miss across every headline and every sub-component — the cleanest cool-inflation print we have had since early 2025. Fed-funds futures responded immediately: CME FedWatch shows July-hike odds collapsed from 42% pre-print to 17% at the close; September-hike odds moderated modestly to 60% from 65%; December-hike odds fell to 55% from 70%. The market read the print as a meaningful and durable dovish repricing.
The equity tape responded proportionally. The S&P 500 rallied, boosted by semiconductor stocks — the specific 'soft CPI + strong bank prints = risk-on' scenario from Monday's Section 7 matrix played out cleanly. And the bank print side of the equation was also strong. All five major banks that reported pre-open Tuesday — JPMorgan, Wells Fargo, Citigroup, Goldman Sachs, and Bank of America — beat EPS estimates. This is the eighth consecutive quarterly beat for the bank complex. Goldman shares closed more than 3% higher on the trading and advisory revenue beat.
This morning delivered more constructive data. The June PPI came in at -0.3% m/m (versus 0.0% consensus), extending the dovish inflation signal. Core PPI at +0.2% (versus +0.3% consensus) was also modestly soft. The Empire State Manufacturing Index is expected to improve to 8.6 from 5.7 (releases 8:30 AM). And Morgan Stanley delivered an enormous Q2 beat pre-open — EPS of $3.46 versus $2.94 consensus on revenue of $21.35B versus $19.64B — sending the stock materially higher. Johnson & Johnson beat modestly ($2.90 vs $2.85 EPS) but the stock is down 1.7% pre-market on cautious FY guidance. Elevance Health is down 7.2% pre-market after a Q2 miss on rising medical costs. BlackRock beat and is up 4.4% pre-market.
Pre-open futures are firmer. S&P 500 futures are up 0.35%; Nasdaq 100 futures are up 0.55%; Dow futures are up 0.15% (dragged by the JNJ decline). Treasury yields extended their post-CPI decline overnight: the 10-year is at 4.51%, down 6 basis points from Monday's close. The 2-year is at 4.05%. The dollar has softened modestly (DXY 99.85). Oil retraced modestly on the softer inflation-expectations tape and the absence of fresh Iran headlines overnight — WTI at $75.30, Brent at $77.85.
Today's Sector Spotlight walks through the post-CPI positioning framework — what the print changes about our September and December FOMC-decision probabilities, how the bank Q2 results interact with the dovish rates tape, and the specific stocks-to-watch adjustments. Three charts.
2. MARKETS AT A GLANCE
U.S. EQUITY FUTURES (PRE-OPEN, POST-CPI RISK-ON CONTINUES)
Asset
Last
Change
% Chg
S&P 500 (ES)
7,568
+27
+0.35%
Nasdaq 100 (NQ)
26,120
+143
+0.55%
Dow (YM)
52,720
+80
+0.15%
Russell 2000 (RTY)
2,405
+12
+0.50%
PRIOR CLOSE (TUESDAY, JULY 14 — CPI-DRIVEN RALLY)
Asset
Last
Change
% Chg
S&P 500
7,540.72
+25.38
+0.34%
Nasdaq Composite
26,050.14
+176.96
+0.68%
Dow Jones Industrial Avg.
52,635.20
+136.56
+0.26%
Russell 2000
2,393.10
+14.20
+0.60%
VIX
16.50
-1.20
-6.78%
RATES & FX — YIELDS EXTENDED POST-CPI DECLINE OVERNIGHT
Asset
Last
Change
% Chg
UST 2-Year
4.05%
-11 bps 2-day
—
UST 10-Year
4.51%
-6 bps Tue-Wed
—
UST 30-Year
5.02%
-5 bps 2-day
—
10Y-3M Spread
+40 bps
-2 bps vs Mon
—
DXY (Dollar Index)
99.85
-0.50 2-day
-0.50%
EUR/USD
1.0745
+0.0055
+0.51%
USD/JPY
158.10
-1.05 2-day
-0.66%
COMMODITIES & CRYPTO — CORRECTED FIGURES
Asset
Last
Change
% Chg
WTI Crude (Aug)
$75.30
-$1.90 2-day
-2.5%
Brent Crude (Aug)
$77.85
-$2.00 2-day
-2.5%
Gold (spot)
$2,155
-$13 vs Mon
-0.60%
Silver (spot)
$22.05
-$0.05
-0.23%
Bitcoin
$63,850
+$1,150 vs Mon
+1.8%
ASIA & EUROPE (INTRADAY)
Asset
Last
Change
% Chg
Nikkei 225
39,485
+165
+0.42%
Hang Seng
22,340
+130
+0.59%
Shanghai Composite
3,222
+7
+0.22%
Stoxx Europe 600
571.80
+3.60
+0.63%
FTSE 100
8,895
+23
+0.26%
DAX
20,485
+65
+0.32%
3. TOP STORIES
June CPI Comes in Materially Soft — Every Line a Dovish Miss
The June CPI print released Tuesday at 8:30 AM ET landed on the dovish side of every consensus estimate. Headline -0.4% m/m (vs -0.2% consensus), Headline Y/Y 3.5% (vs 3.8% consensus), Core 0.0% m/m (vs +0.2% consensus), Core Y/Y 2.6% (vs 2.9% consensus). This is the cleanest cool-inflation print since early 2025. Fed-funds futures repriced immediately: July-hike odds 42% to 17%, September moderated to 60%, December to 55%. The specific components matter: shelter inflation moderated as OER (owners' equivalent rent) came in soft; energy provided a meaningful drag as the June oil retracement worked through the index; services-ex-shelter (Warsh's primary anchor) was subdued at +0.15% m/m. This is the kind of print that materially shifts the Fed's near-term calculus and delivers the July 30-31 hold with high probability.
All Five Major Banks Beat — Eighth Consecutive Quarterly Sector Beat
JPMorgan, Wells Fargo, Citigroup, Goldman Sachs, and Bank of America all reported Q2 pre-open Tuesday, and all five beat consensus EPS estimates. This extends the money-center bank complex's run to eight consecutive quarterly EPS beats. Goldman closed more than 3% higher on the trading and advisory revenue beat. JPMorgan and Citigroup delivered modest beats with in-line FY guidance. Wells Fargo beat but reported flat CRE reserves — the concern we flagged Friday did not materialize in the Q2 print (though it remains a risk into H2). Bank of America beat on trading revenue and expanded FY 2026 NII guidance. The complex results validate the steepened-curve, NIM-expansion framework we walked through Friday and Monday.
Morgan Stanley Delivers Enormous Q2 Beat Pre-Open
Morgan Stanley reported Q2 pre-open this morning and delivered one of the cleanest bank beats of the season: EPS of $3.46 versus $2.94 consensus (+18% beat) on revenue of $21.35 billion versus $19.64B consensus (+9% beat). Wealth-management revenue was the standout — $8.5B versus $7.9B expected, driven by both AUM growth and higher fee capture. Trading revenue was strong across FICC and Equities. The stock is indicated up 5-6% pre-market. The Morgan Stanley beat validates the Q2 bank thesis we walked through Friday and confirms the durability of the wealth-management build-out.
June PPI Also Soft — Inflation Repricing Continues
This morning's June PPI print extended the dovish inflation signal. Headline PPI came in at -0.3% m/m (vs 0.0% consensus). Core PPI was +0.2% (vs +0.3% consensus). The combined CPI + PPI signal points to a meaningfully softer inflation trajectory than the Warsh-hawkish Minutes tape implied. Our July 30-31 FOMC framework has shifted meaningfully: from 'meaningfully non-zero hike risk' Monday to 'hold with modest dovish tone' this morning. December remains the more interesting decision — 55% cumulative hike probability still reflects a meaningful skew.
Iran Headlines Quiet Overnight — Oil Retraces
The Iran-U.S. tape was notably quieter overnight. No additional strikes reported; Doha talks reportedly continuing at low-key deputy-level. Oil retraced with the softer inflation-expectations tape and the absence of fresh headlines: WTI to $75.30, Brent to $77.85. War-risk insurance premiums on Hormuz-transiting vessels edged modestly tighter to 0.70%.
4. MACRO & FED WATCH
The dovish CPI + PPI combination has meaningfully repriced the near-term Fed path. July-hike odds have collapsed to 15-17%; September moderated to 58-60%; December to 50-55%. The July 30-31 FOMC decision, which we characterized Monday as 'materially less certain than a month ago,' is now firmly a hold with modestly dovish guidance the base case (75% probability). The September decision remains the more consequential swing: a further soft inflation print for July (releasing August 12) would push September-hike odds toward 35% and make a September hold the base case; a re-acceleration in July inflation would extend the hawkish setup back into the fall.
Fig. 1 — CME FedWatch cumulative hike probability by meeting. July collapsed 42% → 17% on CPI; September moderated to 60%; December held at 55%.
Two macro pieces to flag for the balance of the week. First, this morning's Empire State Manufacturing at 8:30 (consensus 8.6 from 5.7). A print in line or hot would reinforce the resilient-manufacturing tape and support the hawkish-hold framing at the July 30-31 FOMC. Second, tomorrow's retail sales (consensus +0.3% m/m headline; +0.4% control group). A soft consumer print combined with soft CPI is the ideal setup for the dovish-hold scenario at the July FOMC.
5. ECONOMIC CALENDAR — THIS WEEK
Day
Time (ET)
Release
Consensus / Actual
Mon 7/13
Close
S&P -0.79% on Iran blockade
Oil to $77
Tue 7/14
8:30 AM
JUNE CPI (released)
SOFT: Core 0.0% m/m ✓
Tue 7/14
Pre-open
JPM/WFC/C/GS/BAC Q2
All 5 BEAT ✓
Tue 7/14
Close
Post-CPI rally
SPX +0.34%
Wed 7/15
Pre-open
MS Q2 (released)
Big beat $3.46 vs $2.94
Wed 7/15
Pre-open
JNJ / UNH / BLK / ELV
Mixed
Wed 7/15
8:30 AM
JUNE PPI (released)
SOFT: -0.3% m/m ✓
Wed 7/15
8:30 AM
Empire State Mfg
8.6 est
Thu 7/16
8:30 AM
Retail Sales (Jun)
+0.3% m/m est
Thu 7/16
Pre-open
Delta (DAL) / PEP / TSM
—
Fri 7/17
8:30 AM
Housing Starts / Permits
1.35M
Fri 7/17
AM
Netflix (NFLX) Q2
—
6. EARNINGS WATCH
Today's earnings calendar: JNJ, UNH, ELV, BLK all reported pre-open — mixed results. MS also pre-open with a huge beat. Tomorrow: Delta, PepsiCo, TSMC pre-open; Netflix Friday. The bank sector's 8-consecutive-quarter EPS beat streak is now the longest for the money-center complex since 2019. Section 7 walks through the bank results in detail.
7. SECTOR SPOTLIGHT: THE POST-CPI REPRICING AND BANK Q2 RESULTS
Tuesday's CPI print and the Q2 bank earnings that landed simultaneously delivered the specific outcome that was lowest probability in our Monday scenario matrix — soft CPI + strong bank prints — and the market responded proportionally. Today's spotlight walks through what the print changes for the balance of 2026, how the bank Q2 results interact with the dovish rates tape, and the positioning adjustments we are making.
Fig. 1 — June CPI actuals vs consensus. All four inputs missed to the dovish side.
The CPI print is materially more dovish than we thought possible going in. Our distribution assigned 15% probability to the soft outcome; the actual print was meaningfully softer than even the dovish tail. Core Y/Y at 2.6% versus 2.9% consensus is a full 30 basis points of downside surprise. The Cleveland Fed's nowcasting model had been projecting June CPI Y/Y at 3.96% — the actual print at 3.5% represents a 45 bp miss versus the Fed's own regional-bank projection. This is not noise; this is a signal that the inflation glide path has genuinely shifted lower.
Three specific components of the CPI report deserve attention. First, shelter inflation moderated meaningfully — OER at +0.20% m/m versus a trailing 6-month average of +0.27%. Shelter has been the single largest sticky component of core inflation for two years; the moderation matters. Second, energy provided the expected drag as the June oil retracement worked through the index; the Iran-related re-widening we've seen through July has not yet hit the CPI reports. Third, services-ex-shelter — Warsh's primary anchor for 'persistent' inflation — came in at +0.15% m/m. That is the softest services-ex-shelter print in 18 months and is the specific number that will most influence the July 30-31 FOMC decision.
Fig. 2 — CME FedWatch cumulative hike probability by meeting. July collapsed on CPI; September moderated; December held meaningfully elevated at 55%.
The CME FedWatch repricing chart above shows the specific probability shifts. July hike odds essentially collapsed. September moderated but held above 50% — meaning the market is now pricing a September hike as a plausible but not expected outcome. December-hike odds fell but remained meaningfully elevated at 55% — meaning the market is still pricing at least one 2026 hike as the base case. That is the specific asymmetry to trade: if the July print (released August 12) also comes soft, December-hike odds move toward 30% and the entire yield curve reprices lower. If the July print re-accelerates, the December hike is fully priced and the front-end backs up meaningfully.
Fig. 3 — Q2 2026 bank EPS beats. All six major banks beat — the eighth consecutive quarterly beat for the sector.
The bank Q2 results validate the setup we walked through in Friday's brief. All six major money-center banks beat EPS estimates. The specific standouts: Morgan Stanley delivered the largest beat at +18% ($3.46 vs $2.94), driven by the wealth-management build-out that has now been a two-year investment thesis delivering incremental fee capture. Goldman Sachs beat by +3% on trading and advisory revenue — the M&A pipeline commentary was constructive for H2 activity. JPMorgan and Bank of America both beat modestly with NII guides slightly higher than consensus expected — the steepened curve is delivering as anticipated. Wells Fargo beat with flat CRE reserves — the office-exposure risk we flagged did not materialize in Q2 but remains a watchpoint into H2.
OUR UPDATED H2 POSITIONING FRAMEWORK
Yesterday's combined CPI + bank prints represent one of the cleanest constructive setups we have had in 2026. The soft inflation print takes near-term Fed hike risk off the table; the strong bank results validate the earnings anchor for the S&P complex; the semi-led equity rally suggests the AI-capex thesis is finding footing after the June-early-July consolidation. But the setup is not without friction. First, December-hike odds still at 55% mean the front-end is not fully priced for a dovish outcome — a July CPI re-acceleration would reprice yields materially higher. Second, the Iran tape remains fragile — the July 6 and July 13 escalation cycles are recent reminders. Third, the Second Derivative framework from Groundbreaker (Section 7, July 9) remains the operative medium-term lens for AI-capex exposure. Our updated positioning: maintain core AI-power (CEG, VST, TLN, GEV, ETN, PWR) and physical-AI (SYM, CGNX, TER) as the durable-exposure names. Maintain Micron (buyers in $1,000-1,100 pullbacks; SK Hynix debut provides purer-play comparable). Add JPM and Morgan Stanley as core longs (both beat, both benefit from durable steepened curve). Trim GS on the run-up; hold BAC. Cautious on Citi given the wealth-mgmt build-out timing. Continue to prefer MSFT/GOOGL over ORCL/META within the hyperscaler set. Reduce cash allocation from 15% to 10% given the constructive post-CPI setup. Watch the July NFP and CPI as the swing factors for September and December.
8. ANALYST CALLS DRIVING ACTION
Upgrades / target hikes: Morgan Stanley raised MU to $1,600 on the Micron / SK Hynix comparable framework. Goldman raised MS to $150 post-earnings. Wells Fargo raised JPM to $240. Bernstein raised GS to $675.
Downgrades / target cuts: BofA cut UNH modestly on the health-insurance cost backdrop. Morgan Stanley trimmed ELV to $340 post-print. Wedbush cut ORCL further to $175.
9. STOCKS TO WATCH
JPM — Core long. Wells Fargo PT $240. NIM setup delivered as expected.
MS — +5-6% pre-open on huge Q2 beat. Goldman PT $150. Wealth-mgmt build-out validated.
GS — +3% Tuesday. Bernstein PT $675. Trim on further strength.
BAC — Modest beat. Steady positioning.
WFC — CRE reserves flat in Q2. Watch H2.
C — Modest beat but wealth-mgmt build-out remains 2027 story.
KRE (Regionals) — Steady on the constructive bank tape.
SK Hynix ADR — Debut Friday +14%; monitoring post-IPO trading.
Micron (MU) — MS raised to $1,600. Buyers in $1,000-1,100.
XOM / CVX / FANG / EOG — Oil retraced with softer inflation tape.
TSMC (TSM) — Reports tomorrow.
Netflix (NFLX) — Reports Friday.
Gold (GLD) — Steady bid.
Bitcoin — At $63,850. Corrected level.
TLT — Beneficiary of the post-CPI yield decline.
10. GLOBAL MACRO SNAPSHOT
Asia: Constructive session on the post-CPI dovish read. Nikkei +0.42%, Hang Seng +0.59%, Shanghai +0.22%. TSMC in Taipei bid ahead of tomorrow's Q2 print.
Europe: Positive on softer dollar + lower yields. Stoxx 600 +0.63%, FTSE +0.26%, DAX +0.32%.
Emerging markets: Constructive on softer dollar and improved risk appetite. India, Korea, Indonesia all firmer.
11. WEEK AHEAD PREVIEW
Today: JNJ/UNH/BLK/MS earnings (released); PPI released; Empire Mfg 8:30 AM.
July 30-31: FOMC decision (base case: hold with dovish tone; 75% probability).
12. THE CLOSING THOUGHT
Tuesday's combined CPI print + Q2 bank earnings delivered one of the cleanest constructive setups we have had in 2026. Every CPI input missed to the dovish side; all five major bank prints beat consensus; Morgan Stanley extended the beat run to a sixth major this morning. The specific 'soft CPI + strong bank prints' scenario was the 15% tail of our Monday probability distribution; the market responded proportionally. July-hike odds collapsed to 17%; September moderated to 60%; December held meaningfully elevated at 55%. Our updated framework: maintain core AI-power and physical-AI picks-and-shovels; add JPM and MS as core longs; reduce cash allocation from 15% to 10% given the constructive post-CPI setup. The July NFP (August 1) and July CPI (August 12) are the swing factors for September and December. Trade the constructive tape with appropriate discipline; the December 55% hike odds still represent meaningful asymmetry to be aware of. And a specific note: we have corrected the Bitcoin and VIX figures in this brief following reader feedback that our prior data was materially off. We appreciate the flag and will be more rigorous going forward on those specific figures.
MORNING EDITION · THURSDAY, JULY 16, 2026 · TSMC BEAT -5% ON CAPEX · SPCX BELOW IPO · VIX 16.5
Daily Markets Briefing
The Brookside Brief
Markets · Macro · The Day Ahead
1. THE MORNING SETUP
Good morning. Two market events overnight and pre-open collectively make the clearest real-time case for Groundbreaker's Second Derivative thesis we have seen since the essay was published on July 2. First, Taiwan Semiconductor Manufacturing Company (TSMC) reported Q2 earnings that beat consensus on both top and bottom lines. The company posted record quarterly profit, underscoring that demand for AI chips remains exceptionally strong. And yet — TSMC is down approximately 5% pre-market. The specific trigger: management raised the 2026 capital-expenditure guide by roughly $6 billion, from a prior range implying ~$42B to a new range closer to ~$48B. Under any prior tape framework, a beat combined with a capex raise would be received as bullish (demand-side signal). Under the Second Derivative framework, it is received as bearish — capex accelerating means the structure is more levered to the very deceleration the framework predicts. This is the reflexive-flip mechanism playing out in real time.
The contagion is significant across the AI-semi complex. Memory names — the cleanest AI-capex-derivative exposure — are down 7% pre-market: SK Hynix -7.5%, SanDisk -7.2%, Micron -4.8%. Nvidia is down 2.4%; Broadcom -1.8%; AMD -1.5%. TSMC itself down 5%. This is the first time we have seen the AI-semi complex sell in a coordinated fashion on a bullish demand-side print — the market is beginning to price capex-intensity as a negative rather than a positive. Section 7 walks through the framework and the implications for Nvidia's Q2 print in early August (which is now materially more decisive than a week ago).
Second event overnight: SpaceX (SPCX) dipped BELOW its $135 IPO price for the first time. The stock closed Wednesday at approximately $132.85, down 25% from the June 22 peak of $177.99 and now below the June 12 IPO price. This is the clean vindication of the SPCX bear case we walked through in the June 16 brief. The specific pattern — passive-flow-driven post-IPO peak, then gradual erosion as fundamental questions (customer concentration, orbital-AI viability, xAI capital allocation) worked through the tape — has now played out precisely as the Damodaran / Observation Post / Malkiel frameworks anticipated.
Yesterday's session closed constructively despite the pre-market TSMC-driven selling that has crystallized this morning. The S&P 500 rose 0.4% to 7,543.89, the Nasdaq Composite gained 0.9% to 26,107.01, the Dow was essentially flat (+0.02% to 52,508.66). Apple notched a fresh all-time high on continued iPhone-17 optimism. ASML's bullish Q2 outlook lifted the broader semi complex. VIX at 16.50 (unchanged from Tuesday). Bitcoin holding in the $63,000-64,000 range.
Today's data: June retail sales came in modestly light at +0.2% m/m versus +0.3% consensus. The control-group internals were mixed. Together with yesterday's soft CPI and PPI, the inflation-plus-consumer tape now points to a soft-landing outcome that structurally supports the July 30-31 FOMC hold. Netflix reports after the close — the streaming subscriber and advertising commentary will influence the communication-services complex meaningfully. Iran-related headlines quieter overnight but ongoing military exchanges keep the tail risk live.
Today's Sector Spotlight walks through the TSMC capex-raise / semi-complex selloff as the crystallizing moment for the Second Derivative thesis, and the SPCX below-IPO print as the completion of the June 16 bear case. Three charts.
2. MARKETS AT A GLANCE
U.S. EQUITY FUTURES (PRE-OPEN, TSMC-DRIVEN SEMI SELLOFF)
Asset
Last
Change
% Chg
S&P 500 (ES)
7,528
-15
-0.20%
Nasdaq 100 (NQ)
25,995
-125
-0.48%
Dow (YM)
52,510
0
0.00%
Russell 2000 (RTY)
2,398
-7
-0.29%
PRIOR CLOSE (WEDNESDAY, JULY 15 — APPLE RECORD + POST-CPI EXTENSION)
Asset
Last
Change
% Chg
S&P 500
7,543.89
+3.17
+0.04%
Nasdaq Composite
26,107.01
+56.87
+0.22%
Dow Jones Industrial Avg.
52,508.66
-126.54
-0.24%
Russell 2000
2,395.10
+2.00
+0.08%
VIX
16.50
0.00
0.00%
RATES & FX — 10Y AROUND 4.51%, DOLLAR STEADY
Asset
Last
Change
% Chg
UST 2-Year
4.06%
+1 bp Wed
—
UST 10-Year
4.51%
0 bps Wed
—
UST 30-Year
5.02%
0 bps
—
DXY (Dollar Index)
99.90
+0.05
+0.05%
EUR/USD
1.0740
-0.0005
-0.05%
USD/JPY
158.20
+0.10
+0.06%
COMMODITIES & CRYPTO — VERIFIED LEVELS
Asset
Last
Change
% Chg
WTI Crude (Aug)
$76.20
+$0.90 Wed
+1.2%
Brent Crude (Aug)
$78.80
+$0.95 Wed
+1.2%
Gold (spot)
$2,148
-$7 Wed
-0.32%
Silver (spot)
$22.00
-$0.05
-0.23%
Bitcoin
$63,650
-$200 Wed
-0.31%
ASIA & EUROPE (INTRADAY) — TSMC DRAG ON SEMI COMPLEX GLOBALLY
Asset
Last
Change
% Chg
Nikkei 225
39,395
-90
-0.23%
Hang Seng
22,205
-135
-0.60%
Shanghai Composite
3,215
-7
-0.22%
Stoxx Europe 600
569.80
-2.00
-0.35%
FTSE 100
8,880
-15
-0.17%
DAX
20,455
-30
-0.15%
3. TOP STORIES
TSMC Beats but Falls 5% on $6B Capex Raise — The Reflexive Flip in Real-Time
Taiwan Semiconductor Manufacturing Company (TSMC) reported Q2 earnings pre-open with a record quarterly profit that underscored continued exceptional AI-chip demand. The company beat consensus on both revenue and EPS. And yet, TSMC ADRs are indicated down approximately 5% in pre-market trade. The specific catalyst: management raised the 2026 capital-expenditure guide by ~$6 billion, from a prior range implying ~$42B to a new range closer to ~$48B. That +$6B represents a 14% increase to already-elevated capex intensity. Under a normal earnings framework, a beat combined with a capex raise would be received as bullish. Under the Second Derivative framework that Groundbreaker walked through on July 2 (and we covered in the July 9 spotlight), it is received as bearish — capex accelerating means the structure is more levered to the very deceleration the framework predicts. The coordinated selloff across the AI-semi complex this morning is the reflexive-flip mechanism playing out in the specific way the framework anticipated.
SPCX Falls Below IPO Price — June 16 Bear Case Vindicated
SpaceX (SPCX) closed Wednesday at approximately $132.85 — below the $135 IPO price for the first time since the June 12 debut. The stock is now down 25% from the June 22 peak of $177.99. This is the clean vindication of the SPCX bear case we walked through in the June 16 brief. The specific pattern that played out: post-IPO passive-flow-driven run-up, mean-reversion after the Nasdaq-100 inclusion (July 7), and gradual erosion as the fundamental questions we identified — customer concentration to xAI, orbital-AI valuation discipline, capital-allocation structural questions — worked through the tape. Section 7 walks through the specific chart and what it means for the broader AI-IPO complex.
June Retail Sales Modestly Light at +0.2%
June retail sales came in at +0.2% m/m versus +0.3% consensus — the fifth consecutive month of growth but light of expectations. Control-group internals were mixed: nonstore retailers rose 0.7% (continued e-commerce strength); restaurants and bars +0.4%; motor vehicle sales +0.5%; but general merchandise fell 0.3% and building materials was flat. Combined with yesterday's soft CPI and PPI, the tape now points cleanly to a soft-landing outcome that structurally supports the July 30-31 FOMC hold. Fed-funds futures little changed on the print.
Netflix After Close — Subscriber and Ad Commentary in Focus
Netflix reports Q2 earnings after the close today. Consensus: EPS $7.05 on revenue of $11.5B. The three metrics to watch: (1) subscriber growth (net adds expected to be 5.2M globally); (2) advertising revenue trajectory and 2027 guide (the ad tier is now the second-largest source of new subscriber additions); (3) any commentary on Q4 sports rights or Q3 content lineup. Netflix has beaten EPS consensus in each of the past six quarters; the stock is up 42% YTD. The post-print reaction will influence the broader communication-services complex meaningfully.
PepsiCo and Delta Beats Pre-Open
PepsiCo reported Q2 pre-open with EPS of $2.35 versus $2.28 consensus and organic revenue growth of 2.1% versus 1.8% expected. Guidance maintained; stock essentially flat pre-market. Delta reported Q2 with EPS of $2.42 versus $2.38 consensus on capacity growth of 2.5%. Q3 guide slightly light; stock indicated -2% pre-market on continued jet-fuel-hedge unwinding concerns. Neither print moves the macro tape meaningfully.
4. MACRO & FED WATCH
The soft-landing tape has crystallized through this week. Soft CPI Tuesday, soft PPI Wednesday, modestly-light retail sales this morning — the inflation-plus-consumer complex now supports the dovish FOMC framing. Fed-funds futures: July hike odds essentially zero (5%); September 55%; December 50%. The July 30-31 FOMC hold is now firmly base case (85% probability). September has become the more consequential decision — a soft July CPI (August 12) would push September-hike odds toward 30% and make September hold the base case; re-acceleration would extend the hawkish setup.
The Iran tape remains fragile — U.S. continues striking Iran per overnight reports; crude stayed near recent highs. War-risk insurance on Hormuz-transiting vessels remains at 0.70-0.75%. The oil complex is the primary near-term inflation-tail risk into H2. If Brent sustains above $80 through August, the September FOMC hike calculus tilts hawkish again regardless of the underlying core inflation trajectory.
5. ECONOMIC CALENDAR — THIS WEEK
Day
Time (ET)
Release
Consensus / Actual
Tue 7/14
8:30 AM
June CPI (released)
SOFT: Core 0.0% m/m ✓
Wed 7/15
8:30 AM
June PPI (released)
SOFT: -0.3% m/m ✓
Wed 7/15
Close
SPCX below $135 IPO
BEAR CASE VINDICATED
Wed 7/15
AH
TSMC Q2 (released)
BEAT / stock -5% on capex
Thu 7/16
8:30 AM
Retail Sales (released)
+0.2% m/m (light of 0.3%)
Thu 7/16
Pre-open
DAL / PEP earnings
Mixed
Thu 7/16
After close
Netflix (NFLX) Q2
EPS $7.05 / rev $11.5B est
Fri 7/17
8:30 AM
Housing Starts / Permits
1.35M
Mon 7/20
AM
Q2 season continues
IBM, VZ, BLK, etc
Wed 7/22
AM
Tesla (TSLA) Q2
Key AI/robotics disclosure
Wed 7/29
AM
Meta (META) Q2
KEY: capex commentary
Wed 7/30-31
2:00 PM
FOMC decision
Hold + dovish tone
6. EARNINGS WATCH
Today: TSMC (released, -5% on capex); DAL/PEP pre-open (mixed); Netflix after close. Tomorrow: Housing Starts data. Next week ramps up: IBM, VZ, BLK Monday; GE Aerospace + Coca-Cola Tuesday; ASML Wednesday. The big AI event of the quarter is Nvidia Q2 in early August — with today's TSMC capex-raise / semi-selloff, Nvidia's Q2 disclosure is now materially more decisive than we characterized it a week ago.
7. SECTOR SPOTLIGHT: THE SECOND DERIVATIVE CRYSTALLIZING — TSMC + SPCX
Two events overnight and pre-open collectively make the clearest real-time case for the Second Derivative framework we have seen since Groundbreaker's essay was published on July 2. Today's spotlight walks through both events and updates the positioning framework accordingly.
Part I — TSMC Beat + Capex Raise = Reflexive Flip
TSMC reported Q2 earnings with a record quarterly profit, beating consensus on both top and bottom lines. In any prior tape regime, that print would have sent TSMC higher. Instead, the stock is down 5% pre-market, and the memory complex is down 7%. The specific trigger: management raised the 2026 capex guide by ~$6 billion.
Fig. 1 — TSMC 2026 capex guide raised from ~$42B to ~$48B. Under the Second Derivative framework, a beat + capex-raise triggers the reflexive-flip mechanism.
The chart above shows the TSMC capex trajectory. The specific mechanism at work: when a hyperscaler-adjacent supplier raises capex guidance during a period when the market is questioning the durability of the AI-capex cycle, the incremental capex is priced as INCREMENTAL RISK rather than as incremental demand-side confidence. The Second Derivative framework specifically anticipates this — Groundbreaker argues that the market will eventually reprice the payoffs on the capex arms race, and the CFOs who continue to spend will be punished for it. Today is the first specific tape event where that dynamic has played out cleanly in a bullish print.
The contagion across the AI-semi complex is the specific evidence for the reflexive-flip mechanism. Memory names — the cleanest AI-capex-derivative exposure — are down 7% pre-market. SK Hynix, which debuted in the U.S. Friday at +14% on the day, is now down 7.5% pre-market this morning. Micron is down 4.8%. Nvidia is down 2.4%; Broadcom -1.8%; AMD -1.5%. The specific pattern to note: the pain is proportional to the customer-concentration profile that Groundbreaker identified. Memory has the cleanest capex-derivative exposure (no diversification); Micron and SK Hynix are the purest plays. Broadcom and AMD, with diversified end-markets, take smaller hits. Nvidia's reaction (-2.4%) is the least severe of the AI-semi names because its Q2 print (early August) provides a specific catalyst that could rehabilitate the tape.
WHY CAPEX-RAISE = STOCK-DOWN IS THE SPECIFIC SECOND DERIVATIVE SIGNAL
Under the classic tech-cycle framework, a company that raises capex guidance is signaling confidence in demand. The stock rewards the signal because increased capex means increased revenue capacity, and the market prices demand-side confidence at a premium. Under the Second Derivative framework, however, the specific problem is that AI capex is not a discretionary investment — it is collateralized borrowing. Each incremental dollar of capex is, in Groundbreaker's framing, an incremental dollar of loan-book origination against contracted customer commitments that have unknown credit quality. When the market's framework shifts from 'capex = confidence' to 'capex = leverage,' the equity reaction to capex-raises inverts. TSMC's 5% decline this morning is not a trading anomaly — it is the specific signal Groundbreaker predicted the tape would produce when the Second Derivative reprice began. The specific stock to watch now is Meta (July 27 print): if Meta announces a capex CUT and the stock rallies materially in response, the reflexive flip becomes structural rather than isolated to this morning's TSMC event.
Part II — SPCX Falls Below IPO Price
The second event overnight is the specific completion of the SPCX bear case we walked through in the June 16 brief. SpaceX closed Wednesday at approximately $132.85 — below the $135 IPO price for the first time since the June 12 debut. The specific pattern that played out matches the framework we outlined precisely: post-IPO passive-flow-driven peak at $177.99 (June 22), mean-reversion following the Nasdaq-100 inclusion (July 7), and gradual erosion as the fundamental questions we identified — customer concentration to xAI, orbital-AI valuation discipline, capital-allocation structural questions — worked through the tape.
Fig. 3 — SPCX price trajectory June 12 through July 15. Below the $135 IPO price for the first time.
The specific milestone matters for three reasons. First, it validates the medium-term bear case we articulated on June 16 — the customer-concentration risk (~65% xAI-adjacent exposure through direct and indirect channels), the orbital-AI valuation discipline questions (Damodaran's $1.3T vs the $1.77T IPO valuation), the capital-allocation concerns (public investors funding vertically-integrated Musk-empire capital transfers). Second, it validates the corrected historical Nasdaq-100 fast-track inclusion framework we walked through on July 7 — the average -1.13% Day 1 / -3.41% Day 5 pattern held cleanly, and the mean-reversion has continued into a T+10 through T+20 window that has produced a further -14% decline. Third, it sets a specific technical marker for the AI-IPO complex broadly. If SPCX cannot hold above the $135 IPO price on any post-print bounce, the psychological damage cascades into the pipeline: OpenAI's already-delayed IPO becomes structurally harder to launch, and the AI-IPO financing chain that has underwritten the past 18 months of AI infrastructure capital becomes meaningfully more constrained.
THE SPECIFIC STOCKS-TO-WATCH ADJUSTMENTS FOR THE SECOND DERIVATIVE REGIME
This morning's TSMC event combined with the SPCX below-IPO milestone justifies a specific reordering of positioning. We are REDUCING core longs in the customer-concentrated names: Micron (customer concentration to hyperscalers via HBM), SK Hynix (same), Marvell (top-3 hyperscaler concentration), Oracle (54% OpenAI backlog). We are MAINTAINING core longs in the picks-and-shovels: AI-power (CEG, VST, TLN, GEV, ETN, PWR) which is capex-independent given contracted cash flows; physical-AI (SYM, CGNX, TER) which has diversified end-market exposure; and Broadcom (diversified within semis). We are ADDING core longs in the hyperscaler-CFO-discipline candidates: Meta specifically (Groundbreaker identifies Meta as most likely first-mover to cut capex — if Meta announces a cut on July 27 and the stock rallies, the reflexive flip becomes structural). We remain net long the bank complex (JPM, MS) which benefits from the steepened curve regardless of the AI-capex framework. Cash allocation raised back to 12% given the elevated single-name catalyst risk between now and the July 30-31 FOMC decision.
8. ANALYST CALLS DRIVING ACTION
Upgrades / target hikes: Goldman raised NFLX to $850 pre-earnings. Wells Fargo raised MS to $255 post-earnings. Bernstein raised JPM to $245.
Downgrades / target cuts: Wedbush cut MU to $1,450 on the TSMC-driven memory complex reset. BofA cut TSMC to $190 on the capex-raise. Morgan Stanley cut SPCX to $130 on the sub-IPO breakdown. Wells Fargo cut ORCL further to $170.
9. STOCKS TO WATCH
TSMC (TSM) — -5% pre-open on capex raise. The specific reflexive-flip trigger.
Micron (MU) — -4.8% pre-open. Wedbush cut to $1,450. Reduce core position sizing.
SK Hynix ADR — -7.5% pre-open. IPO Day-4 hangover meets Second Derivative flip.
SanDisk — -7.2% pre-open on memory complex reset.
Nvidia (NVDA) — -2.4% pre-open. Q2 August print is now more decisive than a week ago.
TLT — Beneficiary of the post-CPI/PPI yield decline.
10. GLOBAL MACRO SNAPSHOT
Asia: Weak session on TSMC capex-driven semi selling. Nikkei -0.23%, Hang Seng -0.60%, Shanghai -0.22%. Samsung -3.5% pre-market on the memory-complex reset. TSMC in Taipei was up 1.5% initially on the Q2 beat but faded through the session as U.S. ADR trade digested the capex guide.
Europe: Modestly softer on the semi-complex read-through. Stoxx 600 -0.35%. ASML in Amsterdam was up early on continued strong Q2 tape but faded modestly into the U.S. open.
Emerging markets: Mixed on the softer dollar tape and the AI-semi selloff. India firm; Korea and Taiwan under semi-driven pressure.
11. WEEK AHEAD PREVIEW
Today: Retail Sales (released, light); DAL/PEP earnings; Netflix after close.
Friday: Housing Starts 8:30 AM.
Monday: IBM, VZ, BLK earnings.
Tuesday: GE Aerospace, Coca-Cola, Tesla earnings.
Wednesday: ASML earnings.
July 27: Meta Q2 — CAPEX WATCHPOINT.
July 30-31: FOMC decision.
12. THE CLOSING THOUGHT
Two overnight events collectively made the clearest real-time case for the Second Derivative thesis we have seen since Groundbreaker published on July 2. TSMC beat consensus with a record profit AND raised 2026 capex guide by $6B — and the stock is down 5% pre-market, memory names down 7%. Under the classic framework this would not happen. Under the Second Derivative framework, this is precisely the reflexive-flip mechanism. Second: SPCX closed Wednesday below its $135 IPO price for the first time — vindicating the bear case we walked through on June 16 and completing the corrected Nasdaq-100 inclusion trajectory we corrected on July 7. Combined, the two events justify a meaningful positioning reordering: reduce customer-concentrated exposures (MU, HYNI, MRVL, ORCL), maintain picks-and-shovels (AI-power, physical-AI, Broadcom), add hyperscaler-CFO-discipline candidates (Meta specifically ahead of July 27), maintain bank complex on steepened curve, raise cash to 12%. The July 30-31 FOMC decision is now firmly a hold with dovish tone (85%). September has become the more consequential decision; the July CPI (August 12) is the swing factor. Nvidia's Q2 in early August is now materially more decisive than a week ago — a capex raise from Nvidia against this backdrop would extend the AI-semi complex selloff meaningfully. Trade carefully.
THE BROOKSIDE BRIEF · COMPILED 9:30 AM ET · SOURCES: CNBC / THESTREET (JULY 15 CLOSE), TSMC Q2 EARNINGS RELEASE, INVESTING.COM (TSMC CAPEX + JULY 16 SETUP), SEC (SPCX PRICING), BLS (JUNE RETAIL SALES), CME FEDWATCH, TREASURY H.15, CBOE (VIX), YAHOO / FORTUNE (BITCOIN), GROUNDBREAKER 'THE SECOND DERIVATIVE' (JULY 2), CITRINI RESEARCH, ASCHENBRENNER
Yesterday's brief incorrectly reported TSMC's 2026 capex guide as raised from ~$42B to ~$48B (a $6B raise). The actual numbers, verified against TSMC's earnings release: prior guide $52-56B, new guide $60-64B — approximately an $8B raise on a materially larger base. Directionally the call was correct (capex raise, stock -5%, memory names -6 to -8%) but the specific numbers were wrong. Fig. 1 in today's brief presents the corrected series. Apologies for the error; we are tightening the verification process further, given how central capex disclosures are to the Second Derivative framework.
1. THE MORNING SETUP
Good morning. Thursday delivered the second consecutive session where a bullish print — this time UnitedHealth's strong earnings — could not offset the specific damage in the AI-semi complex from Wednesday night's TSMC capex disclosure. Thursday's cash-session close: S&P 500 -0.51% to 7,533.77; Nasdaq Composite -1.47% to 25,881.95; Dow -0.20% to 52,552.97. The VanEck Semiconductor ETF (SMH) fell nearly 4%. Arm Holdings was the worst single-name performer at -5.2%. Memory names extended pre-market losses through the session — Micron closed -6.2%, SanDisk -6.0%, SK Hynix ADRs down 7.8% on the two-day cumulative reset. Nvidia was down 3.1% Thursday, on top of the 2.4% pre-market weakness, for a two-day drawdown of roughly 5.5% into today's open. The specific point: the Wednesday-night TSMC capex-raise signal was not a one-print reaction. The tape extended it, and pre-open Friday is pricing further downside.
The Second Derivative framework is now visibly the operating thesis for the semi complex specifically. UnitedHealth's beat and the modestly-light retail sales print earlier Thursday could not stabilize semis. Healthcare provided a partial offset — UnitedHealth up 5%, contributing to the Dow's relative outperformance. Financials mixed. The rotation OUT of semis and INTO defensives (healthcare, staples) is beginning to look structural rather than tactical. Today's Sector Spotlight walks through this in detail and updates the positioning framework.
Netflix reported Q2 after the close. The print itself was constructive: EPS beat consensus; revenue of $12.56B was modestly light of the $12.58B estimate but represented 13% YoY growth; net income $3.40B; operating margin 33.4%. However, Q3 revenue guidance came in at approximately +12% YoY — below the consensus expectation of +13-14%. Q3 EPS guidance similarly light. Netflix was down 9% in after-hours trade. The market's read: even a category-defining consumer-subscription franchise cannot exceed the guidance bar in a market that has been front-running earnings-multiple expansion. This will drag the communication-services complex into Friday's open.
Housing Starts posted a large upside surprise. June starts came in at 1.427M SAAR versus 1.320M consensus — a 19.0% month-over-month increase from the revised May 1.199M reading. This is the largest single-month jump of the cycle. Building permits (the leading indicator) declined modestly, so the read-through is nuanced — the June jump reflects catch-up spending on projects delayed by weather and rate uncertainty earlier in Q2. Housing-adjacent equities (homebuilders, home-improvement retail, building-products, mortgage insurance) will trade meaningfully higher pre-open on this print.
Geopolitical: Iran launched fresh strikes on U.S. facilities in the Middle East overnight, including the first direct attack in Syria. This follows a sixth straight night of U.S. strikes on Iranian military facilities. The oil complex has not yet responded aggressively (crude near recent highs but not breaking out), but the Syria-strike escalation moves the risk framework into higher-vol territory. Defense names (LMT, RTX, NOC, GD) will trade higher pre-open; oil complex bid.
Pre-open Friday futures: S&P -0.77%, Nasdaq -1.46%, Dow -0.63%. Setting up for a red weekly close — the S&P is down roughly 0.7% on the week even after yesterday's session, which will be the first losing week in five. VIX closed 16.73 (up 6.76% Thursday) — the vol-of-vol has begun to expand. Bitcoin $64,000-$64,700 range (verified levels). Today's Sector Spotlight walks through the extended semi selloff as confirmation of the Second Derivative thesis, presents the corrected TSMC capex numbers, and updates the positioning framework for the rotation that has now begun in earnest.
2. MARKETS AT A GLANCE
U.S. EQUITY FUTURES (PRE-OPEN FRIDAY — EXTENDING THURSDAY SELLOFF)
Asset
Last
Change
% Chg
S&P 500 (ES)
7,477
-58
-0.77%
Nasdaq 100 (NQ)
25,590
-427
-1.46%
Dow (YM)
52,220
-330
-0.63%
Russell 2000 (RTY)
2,382
-15
-0.63%
THURSDAY JULY 16 CLOSE — SEMI SELLOFF EXTENDED
Asset
Last
Change
% Chg
S&P 500
7,533.77
-10.12
-0.51%
Nasdaq Composite
25,881.95
-225.06
-1.47%
Dow Jones Industrial Avg.
52,552.97
-105.67
-0.20%
Russell 2000
2,397.10
+2.00
+0.08%
VIX
16.73
+0.23
+6.76%
RATES & FX — STEADY
Asset
Last
Change
% Chg
UST 2-Year
4.05%
-1 bp Thu
—
UST 10-Year
4.49%
-2 bps Thu
—
UST 30-Year
5.00%
-2 bps
—
DXY (Dollar Index)
99.85
-0.05
-0.05%
EUR/USD
1.0745
+0.0005
+0.05%
USD/JPY
158.15
-0.05
-0.03%
COMMODITIES & CRYPTO — VERIFIED LEVELS
Asset
Last
Change
% Chg
WTI Crude (Aug)
$76.85
+$0.65 Thu
+0.85%
Brent Crude (Aug)
$79.50
+$0.70 Thu
+0.88%
Gold (spot)
$2,155
+$7 Thu
+0.33%
Silver (spot)
$22.05
+$0.05
+0.23%
Bitcoin
$64,065
+$415 Thu
+0.65%
ASIA & EUROPE (INTRADAY) — SEMI COMPLEX DRAG CONTINUING GLOBALLY
Asset
Last
Change
% Chg
Nikkei 225
39,285
-110
-0.28%
Hang Seng
22,080
-125
-0.56%
Shanghai Composite
3,207
-8
-0.25%
Stoxx Europe 600
568.40
-1.40
-0.25%
FTSE 100
8,865
-15
-0.17%
DAX
20,420
-35
-0.17%
3. TOP STORIES
Semi Selloff Extends — SMH -4%, Arm -5%, Memory -6 to -8% Two-Day
Thursday's cash session confirmed that Wednesday night's TSMC capex-raise signal was not a one-print reaction. The VanEck Semiconductor ETF (SMH) fell nearly 4% on Thursday's session, taking the two-day drawdown for the AI-semi complex to -6 to -8% for memory names and -5% for pure-play foundry and design. Specifically: Micron -6.2% (2-day cumulative), SanDisk -6.0%, SK Hynix ADRs -7.8%, TSMC -5.9%, Nvidia -3.1% Thursday close on top of the pre-market -2.4%, Broadcom -1.8%, AMD -1.5%. Arm Holdings led the individual-stock selling at -5.2% Thursday alone. The specific character of the two-day move: the pain is proportional to the customer-concentration profile Groundbreaker identified. This is now firmly the operating thesis in the semi complex.
Netflix -9% After-Hours on Q3 Guidance Disappointment
Netflix reported Q2 earnings after the close with a nominally constructive print: EPS beat consensus; revenue of $12.56B was modestly light of the $12.58B estimate but represented 13% YoY growth; net income $3.40B; operating margin 33.4% (slightly ahead of internal targets on favorable content-amortization timing). However, Q3 revenue guidance of approximately +12% YoY came in below the consensus expectation of +13-14%. Q3 EPS guidance was similarly light. Netflix was down 9% in after-hours trade. Notable subtext: Netflix said engagement is 'healthy' following recent reports of a slowdown, but also said it would 'cut back on the frequency of its What We Watched reports' — a transparency step-back that investors are pricing as defensive.
Housing Starts +19% m/m — Biggest Jump of the Cycle
June Housing Starts came in at 1.427M SAAR versus 1.320M consensus — a 19.0% month-over-month increase from the revised May 1.199M reading (which was itself revised down from 1.177M — meaning both directions of the surprise are meaningful). Building permits declined modestly to 1.415M, so the read-through is nuanced: the June jump reflects catch-up spending on projects delayed by weather and rate uncertainty earlier in Q2, not a sustained new trend. Still, the print will lift housing-adjacent equities meaningfully into Friday's open. Watch homebuilders (DHI, LEN, TOL, KBH), home-improvement (HD, LOW), building-products (SHW, VMC, MLM, EXP, MAS, LII), and mortgage insurance (MTG, ESNT).
Iran Strikes Syria — First Direct Attack; Sixth Night of U.S. Response
Overnight: Iran launched fresh strikes on U.S. facilities in the Middle East, including the first direct attack in Syria. This follows a sixth straight night of U.S. strikes on Iranian military facilities. The Syria escalation is geopolitically meaningful — moves the conflict beyond the direct U.S.-Iran exchange into a broader regional-proxy pattern. Oil complex has not yet broken out (crude near recent highs but stable), but the vol-of-vol framework has expanded. Defense names bid pre-open: LMT, RTX, NOC, GD, HII expected +1-2%. Oil complex bid: XOM, CVX, FANG, EOG expected +1%. War-risk insurance on Hormuz-transiting vessels expected to tick up from the current 0.70-0.75% range.
UnitedHealth Beat Provides Healthcare Offset
UnitedHealth Group reported Q2 earnings pre-open Thursday with a clean beat: EPS $7.85 versus $7.62 consensus; revenue $103.4B versus $101.8B expected. Medicare Advantage margins better than feared; Optum-Health growth reaccelerated. Stock +5% Thursday; contributed roughly 45 basis points to the Dow's relative outperformance (Dow -0.20% vs S&P -0.51%). The broader read-through: healthcare is beginning to function as the specific defensive-rotation destination for capital leaving the AI-semi complex. Sector-relative-strength metrics support this — XLV outperformed XLK by 1.4 points on Thursday, the largest single-day gap in six weeks.
4. MACRO & FED WATCH
The macro tape has now delivered three clean data prints this week that collectively support the soft-landing framework: soft CPI Tuesday, soft PPI Wednesday, mixed retail sales Thursday (light on headline, positive on control group), and today's Housing Starts blowout. The composite: the Fed does not need to hike at the July 30-31 meeting, and the September decision has become the more consequential debate. Fed-funds futures little changed: July hike odds 5%; September 55%; December 50%. The market is pricing the FOMC at a hold with dovish tone at 85% probability.
The specific risk to the dovish framing remains the Iran-oil complex. Brent at $79.50 is elevated but not runaway. If the Syria escalation extends into sustained oil disruption — Brent sustains above $80 through August, or a Strait of Hormuz insurance-repricing event occurs — the September FOMC calculus tilts hawkish again regardless of the underlying inflation trajectory. This is the specific tail risk we are tracking.
5. ECONOMIC CALENDAR — THIS WEEK AND NEXT
Day
Time (ET)
Release
Consensus / Actual
Tue 7/14
8:30 AM
June CPI (released)
SOFT: Core 0.0% ✓
Wed 7/15
8:30 AM
June PPI (released)
SOFT: -0.3% m/m ✓
Wed 7/15
AH
TSMC Q2 (released)
BEAT / stock -5% on capex
Thu 7/16
8:30 AM
Retail Sales (released)
+0.2% (light of 0.3%)
Thu 7/16
Pre-open
UNH earnings
BEAT ✓ / stock +5%
Thu 7/16
After close
Netflix (NFLX) Q2
EPS beat / rev light / -9% AH
Fri 7/17
8:30 AM
Housing Starts (released)
1.427M vs 1.320M ✓ BIG BEAT
Fri 7/17
Overnight
Iran Syria strike
GEOPOLITICAL ESCALATION
Mon 7/20
AM
Q2 season continues
IBM, VZ, BLK
Tue 7/21
AM
GE Aero, Coca-Cola
Cyclicals / consumer
Wed 7/22
AM
Tesla (TSLA) Q2
Robotaxi / AI progress
Wed 7/23
AM
ASML
Semi capex read-through
Wed 7/29
AM
Meta (META) Q2
KEY: capex commentary
Wed 7/30-31
2:00 PM
FOMC decision
Hold + dovish tone (85%)
Fri 7/31
8:30 AM
June Core PCE
Fed's preferred inflation
Fri 8/1
8:30 AM
July NFP
Employment tape
6. EARNINGS WATCH
This week: TSMC (Wed, -5% on capex); UNH (Thu, +5% clean beat); NFLX (Thu AH, -9% on guide); DAL/PEP (Thu, mixed). Next week: IBM, VZ, BLK Monday; GE Aero + KO + Tesla Tuesday; ASML Wednesday. The pre-Meta capex disclosures matter: ASML on July 23 is the specific bellwether that will confirm or disconfirm the TSMC-signaled capex acceleration. If ASML also raises capex guide, the Second Derivative framework becomes structurally more decisive; if ASML moderates capex signaling, it gives the semi complex a specific rehabilitation catalyst before Nvidia's Q2 in early August. Meta July 29 remains the specific hyperscaler-CFO-discipline watchpoint.
Thursday's extended semi selloff confirms that Wednesday night's TSMC signal was not a one-print reaction. The Second Derivative framework is now visibly the operating thesis for the semi complex specifically, and the rotation OUT of semis / INTO defensives (healthcare, staples) is beginning to look structural rather than tactical. Today's spotlight presents the corrected TSMC capex numbers, walks through the two-day cumulative damage across the semi complex, and updates the positioning framework for the rotation that has now begun.
Part I — The Corrected TSMC Capex Numbers
Yesterday's brief incorrectly reported TSMC's 2026 capex guide as raised from ~$42B to ~$48B (a $6B raise). The actual numbers, verified against TSMC's earnings release: prior guide $52-56B, new guide $60-64B — approximately an $8B raise on a materially larger base. Directionally the call was correct (capex raise, stock -5%, memory names -6 to -8%) but the specific numbers were wrong. The corrected series is presented in Fig. 1 below.
Fig. 1 — CORRECTED: TSMC 2026 capex guide raised from $52-56B to $60-64B (~$8B raise). The specific base is 30% larger than what we reported yesterday.
The specific implication of the corrected numbers: the capex-intensity signal is more severe than yesterday's brief conveyed. A $60-64B 2026 capex run-rate represents approximately 47% of TSMC's projected 2026 revenue — the most capex-intensive year in the company's history. Under the classic framework, this signals extraordinary demand-side confidence in AI-chip production. Under the Second Derivative framework, it signals extraordinary leverage to the very deceleration Groundbreaker anticipates. The market's Thursday response — SMH -4%, Arm -5%, memory -6% cumulative — is proportionate to the corrected $8B/$60-64B disclosure, not to yesterday's incorrect $6B/$48B framing.
Part II — Two-Day Cumulative Damage in the Semi Complex
Fig. 2 — Two-day cumulative move Wed close → Thu close across the AI-semi complex. Memory names down 6-8%; Arm down 8.5%; SMH ETF down 4%.
The two-day cumulative damage is the specific evidence that the TSMC signal is being priced as a regime change rather than a one-print anomaly. Arm Holdings led the individual-stock selling at -8.5% two-day cumulative — its exposure to hyperscaler AI-inference royalty payments makes it uniquely levered to the capex-cycle narrative. Memory (SK Hynix -7.8%, Micron -6.2%, SanDisk -6.0%) took the second-worst hit, consistent with the customer-concentration framework. TSMC itself -5.9%. Nvidia -3.1% Thursday close on top of the pre-market -2.4%, for a two-day drawdown of roughly 5.5%. Broadcom -1.8%; AMD -2.1%. The specific pattern: pain proportional to capex-derivative exposure and customer concentration.
WHY THE TWO-DAY PATTERN MATTERS MORE THAN THE ONE-DAY PRINT
A one-day selloff in the semi complex on a specific bad print could be a tactical reaction — profit-taking after a strong run, momentum-chase unwinding, or algorithmic reflexivity. A two-day cumulative selloff, where the second day is not a bounce but an extension, is the specific signal that the market is repricing the regime rather than reacting to a specific print. The Second Derivative framework anticipated exactly this pattern: once the market's framework shifts from 'capex = confidence' to 'capex = leverage,' the reaction to capex disclosures does not mean-revert on the next session — it compounds into a series of downward re-ratings. Thursday's -4% for SMH on top of Wednesday-night's -3% pre-market damage is the compounding pattern. Watch today's session closely: if SMH takes ANOTHER -1% to -2% into Friday's close, the compounding pattern is fully in force and the Second Derivative regime is structural. If SMH stabilizes or bounces meaningfully today, the reaction is isolated to the TSMC-specific news.
Part III — The Rotation Into Defensives
The specific complementary evidence for a structural regime shift is the rotation into defensives on Thursday. UnitedHealth beat and rallied 5%, contributing 45 basis points to the Dow's relative outperformance (Dow -0.20% vs S&P -0.51%). XLV (healthcare) outperformed XLK (tech) by 1.4 points — the largest single-day gap in six weeks. Staples names (PG, KO, PEP, CL) all closed positive on a down-tape session. This is the specific characteristic of a defensive rotation regime, not a tactical hedge event.
Fig. 3 — June Housing Starts blowout: 1.427M SAAR vs 1.320M consensus, +19% m/m. Building permits softer, so mixed read-through.
Housing Starts +19% m/m to 1.427M SAAR provides a specific positive-tape counterweight for cyclicals. Homebuilders (DHI, LEN, TOL, KBH), home-improvement (HD, LOW), building-products (SHW, VMC, MLM, EXP, MAS, LII), and mortgage insurance (MTG, ESNT) will trade meaningfully higher pre-open. The specific caution: permits declined modestly, so the June jump is catch-up spending rather than a sustained trend. Nonetheless, in a tape where semi is under pressure and defensives are getting the bid, housing-adjacent cyclicals represent a specific complementary rotation destination worth adding at the margin.
THE UPDATED POSITIONING FRAMEWORK — SECOND DERIVATIVE IN FORCE + DEFENSIVE ROTATION BEGUN
The combination of the extended semi selloff and the visible defensive rotation justifies the following specific positioning updates. REDUCE further in customer-concentrated names: Arm Holdings (highest capex-cycle beta at -8.5% two-day; avoid on any pre-open bounce), Micron (Wedbush cut yesterday validated), SK Hynix (worst-in-class memory pain), Marvell (customer-concentration risk), Oracle (OpenAI concentration overhang). MAINTAIN core longs in picks-and-shovels: AI-power (CEG, VST, TLN, GEV, ETN, PWR) — capex-independent; physical-AI (SYM, CGNX, TER) — diversified end-markets; Broadcom (diversified within semis). ADD to healthcare (UNH specifically after Thursday's beat + XLV; also consider MRK, LLY, ABBV); staples (PG, KO, PEP, COST). Add housing-adjacent cyclicals on the +19% Starts print: DHI, LEN, HD, LOW, SHW. MAINTAIN bank complex (JPM, MS) on the steepened curve. Meta remains the specific hyperscaler-CFO-discipline watchpoint on July 29 — if Meta announces a capex CUT and stock rallies materially, the reflexive flip becomes structural. Cash allocation raised to 14% (from 12% yesterday) given the elevated single-name catalyst risk and the geopolitical vol-of-vol expansion from the Syria escalation.
8. ANALYST CALLS DRIVING ACTION
Upgrades / target hikes: JPMorgan raised UNH to $685 post-print. Goldman raised healthcare sector view to Overweight. Wells Fargo raised MS to $255 post-earnings. Bernstein maintained JPM at $245.
Downgrades / target cuts: BofA cut TSMC to $185 on the corrected capex read. Wedbush cut MU further to $1,400 after Thursday's -6% session. Morgan Stanley cut Arm to $155 on capex-cycle exposure. Barclays cut NFLX to $780 on Q3 guide disappointment. Wells Fargo cut ORCL further to $165. Morgan Stanley cut SPCX to $130 held.
9. STOCKS TO WATCH
Arm Holdings — -8.5% two-day cumulative. Highest capex-cycle beta. Avoid.
JPM / MS — Bank complex core long on steepened curve.
DHI / LEN / TOL / KBH — Homebuilders. +19% Starts print catalyst.
HD / LOW — Home improvement retail beneficiary.
SHW / VMC / MLM / MAS / LII — Building products.
MTG / ESNT — Mortgage insurance.
Netflix (NFLX) — -9% AH on Q3 guide. Barclays cut to $780.
LMT / RTX / NOC / GD / HII — Defense bid on Syria escalation.
XOM / CVX / FANG / EOG — Oil bid on Iran headlines.
SPCX — $132.85 below IPO. MS held $130 cut.
Oracle (ORCL) — WF cut further to $165.
Marvell (MRVL) — Customer concentration; reduce.
Bitcoin — $64,065 (verified).
VIX — 16.73 close (up 6.76% Thu). Vol-of-vol expanding.
TLT — Beneficiary of dovish tape.
10. GLOBAL MACRO SNAPSHOT
Asia: TSMC read-through continues weighing on regional semi complex. Nikkei -0.28%, Hang Seng -0.56%, Shanghai -0.25%. Samsung, SK Hynix (local), Tokyo Electron all under semi-driven pressure. Bank of Japan continues to signal no urgency around normalization; yen stable at 158.15 to the dollar.
Europe: Modestly softer on the semi read-through and the Syria escalation. Stoxx 600 -0.25%. ASML in Amsterdam lower ahead of next Wednesday's Q2 print. European defense names (BAE, Thales, Rheinmetall) bid on the geopolitical tape.
Emerging markets: Mixed. India strong on domestic tape. Korea, Taiwan under semi-driven pressure. Turkey, MENA under geopolitical-tape pressure.
11. WEEK AHEAD PREVIEW
Today: Housing Starts (released, blowout); positioning into weekend after semi selloff.
Monday: IBM, VZ, BLK earnings.
Tuesday: GE Aerospace, Coca-Cola, Tesla earnings.
Wednesday: ASML — KEY semi capex read-through.
July 29 — CRITICAL: Meta Q2 (capex watchpoint).
July 30-31: FOMC (85% hold with dovish tone).
July 31: Core PCE (Fed's preferred inflation).
August 1: July NFP.
Early August: Nvidia Q2 — decisive for AI-semi tape.
12. THE CLOSING THOUGHT
Thursday extended the TSMC-driven semi selloff, confirming that Wednesday night's signal was regime rather than tactical. The two-day cumulative damage — SMH -4%, Arm -8.5%, memory -6 to -8%, Nvidia -5.5% — is the specific compounding pattern the Second Derivative framework anticipated. The rotation into defensives is now visible: XLV outperformed XLK by 1.4 points Thursday; UNH +5% on a clean beat; staples all positive on a down tape. Housing Starts +19% m/m to 1.427M provides a specific positive catalyst for housing-adjacent cyclicals to complement the defensive rotation. Netflix -9% AH on Q3 guide disappointment will drag communication services but is idiosyncratic rather than tape-defining. The specific correction to yesterday's brief: TSMC's capex raise was $52-56B → $60-64B (not $42B → $48B); direction was right, specific numbers were wrong; the corrected numbers are more severe than the prior framing conveyed. Iran-Syria strike is the geopolitical wildcard; VIX closed 16.73 up 6.76%, so vol-of-vol is expanding. Cash raised to 14%. The specific stocks to watch today are ASML into next Wednesday's print (will confirm or disconfirm the capex-acceleration signal), Meta into July 29 (specific hyperscaler-CFO-discipline watchpoint), and Nvidia into early August (now decisive for AI-semi tape). Have a good weekend.
THE BROOKSIDE BRIEF · COMPILED 9:30 AM ET · SOURCES: CNBC / STOCKTWITS / MOTLEY FOOL / THESTREET (JULY 16 CLOSE), TSMC Q2 EARNINGS RELEASE (CORRECTED CAPEX), NETFLIX Q2 EARNINGS RELEASE, U.S. CENSUS BUREAU / HUD (HOUSING STARTS JUNE), CME FEDWATCH, TREASURY H.15, CBOE (VIX 16.73), FORTUNE / YAHOO FINANCE (BITCOIN $64,065), REUTERS / BLOOMBERG (IRAN SYRIA STRIKE), GROUNDBREAKER 'THE SECOND DERIVATIVE' (JULY 2), CITRINI RESEARCH, ASCHENBRENNER
MORNING EDITION · MONDAY, JULY 20, 2026 · NASDAQ -2.9% WEEKLY · MOONSHOT KIMI · IRAN WEEKEND STRIKES · BIG TECH WEEK
Friday's brief listed BlackRock (BLK) among Monday's earnings. BLK actually reported Wednesday of last week (July 15), with a clean beat: EPS $13.91 vs $12.69 consensus, revenue $7.08B vs $6.73B expected. The Monday morning earnings lineup instead centers on IBM (after close), Verizon (pre-open), and SAP. Apologies for the calendar error.
1. THE MORNING SETUP
Good morning. Coming off a week that established the Second Derivative framework as the operating tape thesis for the AI-semi complex specifically. The week's box score: S&P 500 -1.6% on the week; Nasdaq Composite -2.9%; Dow -0.4%. Friday alone: S&P -1.0%, Nasdaq -1.4%, Dow -0.7%. Netflix closed Friday at $68.95 (-7.26% on the guidance miss). Weekly damage in the semi complex was the story: SMH ETF -6.2% on the week; Arm Holdings -9.4%; SK Hynix -8.5%; Micron -7.1%; Nvidia -5.8%. Healthcare provided the rotation destination: UNH +5.4% on the week, XLV +1.2%. The Housing Starts blowout on Friday helped stabilize the broader tape late-session, but the semi damage was the primary weekly story.
Weekend added a second-derivative catalyst: Moonshot AI released its Kimi K2 model at approximately $0.15 per million input tokens — roughly 17x cheaper than GPT-4o's $2.50 pricing, and materially cheaper than even DeepSeek V3. This is the second Chinese-AI cost-shock event of 2026 (following the January DeepSeek R1 release), and it directly reinforces the specific concern Groundbreaker articulated: if training-and-inference costs collapse structurally, the AI-capex arms race becomes more speculative rather than more justified. Semi names in Asia sold off further overnight on the read-through; U.S. semi futures modestly softer despite the broader-index bounce.
Geopolitical: U.S. and Iran exchanged mutual airstrikes over the weekend. The Strait of Hormuz safe-passage tape reopened as a live concern. Brent crude surged more than 2% to near $80 per barrel; WTI up 2%+ to approximately $78. Bitcoin fell more than 1% to near $63,000 on the risk-off tape. Cash VIX closed Friday at 15.02 with the front VIX future repricing 3.5% higher to 17.55 — meaning near-term risk is being priced higher than realized volatility would suggest.
Pre-open Monday futures indicate a modest bounce: S&P 500 futures +0.29%, Nasdaq 100 futures +0.17%, Dow futures +0.19%. The bounce is being led by healthcare and staples continuation, and by housing-adjacent cyclicals catching up to Friday's Housing Starts print. Semi complex remains under pressure pre-open on the Moonshot Kimi read-through.
This week's earnings pipeline is the defining setup for the tape. Wednesday is the critical day: Alphabet (GOOGL), Tesla (TSLA), ASML, and IBM all report. ASML is the specific semi-capex-cycle bellwether that will confirm or disconfirm the TSMC signal from last week. Alphabet's capex-and-AI-monetization disclosure will be the specific hyperscaler-CFO-discipline read. Tesla's robotaxi and Optimus disclosures will move physical-AI names. Intel Thursday adds the semi-fab-capex read-through. Monday's earnings themselves are more modest — IBM after close, Verizon pre-open, SAP overnight from Europe — but the week's setup positions each of the next four sessions as more decisive than most weeks of Q2 season.
Today's Sector Spotlight walks through the weekly box-score, the Moonshot Kimi cost-shock and its Second Derivative implications, and the specific positioning framework for a week where GOOGL/TSLA/ASML on Wednesday will be the specific tape-defining events. Three charts.
2. MARKETS AT A GLANCE
U.S. EQUITY FUTURES (PRE-OPEN — MODEST BOUNCE, SEMI STILL SOFT)
Asset
Last
Change
% Chg
S&P 500 (ES)
7,555
+22
+0.29%
Nasdaq 100 (NQ)
25,635
+44
+0.17%
Dow (YM)
52,240
+99
+0.19%
Russell 2000 (RTY)
2,393
+9
+0.38%
FRIDAY JULY 17 CLOSE — SEMI SELLOFF DEEPENED, WEEKLY LOSSES LOCKED IN
ASIA & EUROPE (INTRADAY) — SEMI COMPLEX STILL UNDER PRESSURE ON MOONSHOT
Asset
Last
Change
% Chg
Nikkei 225
39,205
-80
-0.20%
Hang Seng
22,145
+65
+0.30%
Shanghai Composite
3,220
+13
+0.40%
Stoxx Europe 600
570.20
+1.80
+0.32%
FTSE 100
8,880
+15
+0.17%
DAX
20,470
+50
+0.24%
3. TOP STORIES
Nasdaq Posts -2.9% Weekly Loss — First Losing Week in Five
The week ending Friday July 17 delivered the AI-semi complex's worst weekly performance since the January DeepSeek-R1 selloff. Weekly moves: Nasdaq Composite -2.9%; SMH ETF -6.2%; Arm Holdings -9.4%; SK Hynix -8.5%; Micron -7.1%; Nvidia -5.8%; TSMC -7.2%. The trigger sequence: Wednesday-night TSMC Q2 earnings + $8B capex raise → Thursday extended selloff on TSMC read-through → Friday deepened selling as concerns about hyperscaler capex scale-back compounded → weekend Moonshot Kimi release accelerated the cost-collapse narrative. Healthcare provided the rotation destination: XLV +1.2% weekly, UnitedHealth +5.4% on Thursday's beat. The specific market signal: this is not a tactical drawdown, it is a regime shift. Cash VIX at 15.02 misleading on the surface (very compressed) but the front VIX future at 17.55 (+3.5%) shows the market repricing near-term risk higher than realized vol.
Moonshot Kimi K2 — Chinese AI Cost Gap Widens 17x
Chinese AI lab Moonshot released its Kimi K2 model on Friday at pricing that opens the widest cost gap versus U.S. hyperscalers to date. K2 input pricing sits at approximately $0.15 per million tokens — 17 times cheaper than GPT-4o's $2.50 pricing, and materially cheaper than DeepSeek V3 (which itself was 9x cheaper than GPT-4o at $0.27). The model's benchmark performance reportedly rivals GPT-4o on reasoning tasks. This is the second major Chinese-AI cost-shock event of 2026 following the January DeepSeek R1 release. The specific Second Derivative concern this reinforces: if training-and-inference costs collapse structurally, the AI-capex arms race becomes more speculative rather than more justified. Hyperscalers spending $50-100B in 2026 capex each face a specific ROI question that Moonshot's pricing forces to the surface.
Weekend U.S.-Iran Mutual Strikes — Brent to $80
The U.S. and Iran exchanged mutual airstrikes over the weekend, extending the conflict that escalated Thursday-Friday with Iran's first direct strike on U.S. facilities in Syria. The Strait of Hormuz safe-passage tape reopened as a live concern. Brent crude surged more than 2% to near $80 per barrel; WTI up 2%+ to approximately $78. Bitcoin fell more than 1% to near $63,000 on the risk-off tape. War-risk insurance on Hormuz-transiting vessels expected to tick up from 0.75% into the 0.80-0.85% range this morning. Defense names bid pre-open: LMT, RTX, NOC, GD, HII expected +1-2%. Oil complex bid: XOM, CVX, FANG, EOG expected +1-2%. Airlines negative on jet-fuel cost pressure: DAL, UAL, AAL expected -1 to -2% pre-open.
IBM After Close — First Q2 Big-Cap Read
IBM reports Q2 after the close today. Consensus: EPS $2.75 on revenue $16.90B, with software segment growth expected +9% and consulting +4%. The specific watchpoint: hybrid-cloud and Red Hat commentary, which represent IBM's most AI-adjacent revenue stream. If IBM disappoints on hybrid-cloud or provides a cautious H2 guide, the read-through to the broader enterprise-AI-monetization narrative is bearish. If IBM beats and raises, the market gets an early positive data point ahead of Alphabet's Wednesday print.
Verizon Pre-Open — Post-Paying Subscribers in Focus
Verizon reports Q2 pre-open today. Consensus: EPS $1.20 on revenue $33.55B. Post-paid phone net adds expected 210K (vs 218K a year ago). The specific watchpoint: whether Verizon's fixed-wireless-access growth remains 400K+ per quarter (a proxy for consumer broadband disruption) and whether capex remains on the $17-18B annual pace. Verizon is a specific defensive-rotation beneficiary — the stock's 6.8% dividend yield anchors it in the current tape framework. Watch pre-open reaction: >2% up move on the print would confirm the defensive rotation is broadening.
4. MACRO & FED WATCH
The week's macro tape (soft CPI Tue, soft PPI Wed, mixed retail sales Thu, Housing Starts blowout Fri) supports the soft-landing framework. Composite: Fed hold at July 30-31 remains firmly base case (85% probability). September has become the more consequential decision — the July CPI print on August 12 will be the swing factor. The specific risk to the dovish framing is now the Iran-oil complex. Brent at $80 is elevated but not runaway. If the Hormuz-passage disruption becomes structural — Brent sustains above $82 through August — the September FOMC calculus tilts hawkish regardless of underlying core inflation trajectory. Fed-funds futures Monday morning: July hike odds 5%; September 55%; December 50%.
5. ECONOMIC CALENDAR — THIS WEEK AND NEXT
Day
Time (ET)
Release
Consensus / Watchpoint
Mon 7/20
Pre-open
Verizon (VZ) Q2
EPS $1.20 / rev $33.55B
Mon 7/20
After close
IBM Q2
EPS $2.75 / hybrid-cloud watch
Tue 7/21
AM
GE Aero, KO, Lockheed
Consumer + defense reads
Tue 7/21
AM
GM Q2
Auto cycle read
Wed 7/22
10:00 AM
Existing Home Sales
Housing follow-through
Wed 7/22
AM
Alphabet (GOOGL) Q2
KEY: capex + AI monetization
Wed 7/22
AM
Tesla (TSLA) Q2
Robotaxi + Optimus
Wed 7/22
Pre-open
ASML Q2
KEY: semi capex read-through
Thu 7/23
8:30 AM
Weekly jobless claims
230K
Thu 7/23
AM
Intel (INTC) Q2
Foundry + fab-capex
Fri 7/24
8:30 AM
Durable Goods Orders
+0.6%
Wed 7/29
AM
Meta Q2
CRITICAL: capex commentary
Wed 7/30-31
2:00 PM
FOMC decision
Hold + dovish tone (85%)
Fri 7/31
8:30 AM
June Core PCE
Fed's preferred inflation
Fri 8/1
8:30 AM
July NFP
Employment tape
6. EARNINGS WATCH
This week is the tape-defining stretch of Q2 season. Monday: IBM (AH), Verizon (pre-open), SAP (Europe). Tuesday: GE Aerospace, Coca-Cola, Lockheed, GM. Wednesday — the critical day: Alphabet, Tesla, ASML, IBM (moved from Monday in some calendars — we're tracking IBM as Monday-AH). Thursday: Intel, T-Mobile, American Airlines. Friday: Colgate-Palmolive. The specific setups: ASML Wednesday is the semi-capex bellwether (will confirm/disconfirm TSMC signal); Alphabet Wednesday is the hyperscaler-CFO-discipline read (capex + AI monetization); Tesla Wednesday is the physical-AI read (robotaxi + Optimus); Intel Thursday is the fab-capex read.
7. SECTOR SPOTLIGHT: WEEKLY BOX SCORE, MOONSHOT KIMI COST SHOCK, BIG TECH WEEK SETUP
Today's spotlight covers three things: the weekly box-score of what was, in our view, the most consequential week for the AI-semi complex since the January DeepSeek R1 selloff; the specific Second Derivative implications of Moonshot AI's Kimi K2 release over the weekend; and the specific positioning framework for a week where Wednesday alone will produce four tape-defining earnings prints.
Part I — The Weekly Box Score
The specific pattern that emerged over the week is the clean confirmation of the Second Derivative framework as the operating tape thesis. Five specific elements: (1) capex-raise = stock-down inversion on TSMC Wednesday; (2) extension rather than mean-reversion on Thursday; (3) further extension on Friday with SMH down another 2%; (4) visible rotation into healthcare (UNH +5.4%, XLV +1.2%) that was structural rather than tactical; (5) housing-adjacent cyclicals catching a bid on the +19% Housing Starts print. The chart below quantifies the specific weekly damage across the AI-semi complex and the specific rotation into defensives.
Fig. 1 — Weekly performance July 13-17. Semi complex -6 to -9%; healthcare +1 to +5%.
The specific data point that anchors the week: Arm Holdings -9.4%. Arm sits at the intersection of every specific pain point — hyperscaler-AI-inference royalty exposure, elevated valuation multiple, customer concentration to specific hyperscaler platforms, and the specific reflexive-flip signal from TSMC. Second: UnitedHealth +5.4%. UNH sits at the intersection of every specific relief point — defensive rotation destination, medically-necessary-cash-flow business model, elevated dividend, low correlation to the AI-capex narrative, and specific earnings-beat catalyst. Third: SMH ETF -6.2%. The ETF-level move is the specific evidence that this is a sector-level regime shift rather than individual-name specific concern.
Part II — Moonshot Kimi K2 as Second Derivative Catalyst
Chinese AI lab Moonshot released its Kimi K2 model on Friday with pricing that opens the widest cost gap versus U.S. hyperscalers to date. Input pricing $0.15 per million tokens — 17 times cheaper than GPT-4o's $2.50 pricing, and materially cheaper than DeepSeek V3 (which itself was ~9x cheaper than GPT-4o at $0.27). The chart below shows the specific cost gap.
Fig. 3 — Chinese AI cost gap widens: Moonshot Kimi K2 at $0.15/M tokens vs GPT-4o at $2.50/M — 17x cost gap.
The specific Second Derivative implication is important. Groundbreaker's framework does not require that Chinese AI equals U.S. AI on capability — it requires that the market's framework shifts from 'capex = confidence' to 'capex = leverage.' A 17x cost gap between the marginal Chinese-hosted inference token and the marginal U.S.-hyperscaler-hosted token is the specific evidence that the AI-capex ROI equation is more speculative than the current capex trajectory implies. Meta announced $70B in 2026 capex; Alphabet is on the same trajectory; Microsoft ~$80B. If Chinese models provide 80% of the value at 6% of the cost, the specific unit-economics question that Groundbreaker articulated becomes the specific tape question for the hyperscaler complex.
WHY MOONSHOT KIMI MATTERS MORE THAN DEEPSEEK DID
The January DeepSeek R1 selloff was a specific one-print event — DeepSeek showed that a Chinese lab could reach GPT-4-level reasoning on notably less compute. The immediate market reaction (-17% for NVDA on the day) mean-reverted within three weeks. Moonshot Kimi K2 is different in a specific structural way: it is the second such release of 2026, from a different Chinese lab, at pricing 40% below DeepSeek V3, which itself was 9x below GPT-4o. The specific pattern is a curve rather than a data point. Second, the release lands into a tape where the Second Derivative framework is already the operating thesis for the semi complex. Third, it lands three days before Alphabet's Wednesday print — the specific hyperscaler most exposed to search-substitution risk from cheap Chinese inference (via developer-tier substitution). The mean-reversion pattern that saved NVDA in January is unlikely to repeat because the market's framework has already shifted. Watch specifically how Alphabet's Q2 call handles the question of capex efficiency vs. capex scale.
Part III — Big Tech Week Setup + Positioning
Fig. 2 — This week's earnings pipeline. Wednesday concentrates GOOGL / TSLA / ASML / IBM — the tape-defining day.
Wednesday concentrates the four tape-defining prints of the week. Alphabet and Tesla are the marquee names but ASML is the specific semi-capex-cycle bellwether. If ASML raises 2026 lithography orders guide, the TSMC signal becomes structurally confirmed and the semi complex takes another leg down. If ASML moderates guidance or holds, the semi complex gets a specific rehabilitation catalyst that could support a technical bounce into Meta's July 29 print. Alphabet's capex disclosure will be watched more closely than any single number in the actual earnings — the specific question is whether Alphabet raises 2026 capex above the current $75-80B trajectory. Tesla's robotaxi progress and Optimus disclosure will move physical-AI names (SYM, CGNX, TER) meaningfully. Intel Thursday is the fab-capex read-through.
THE UPDATED POSITIONING FRAMEWORK — HOLD DEFENSIVE ROTATION, PREPARE FOR WEDNESDAY
Coming into Monday the positioning framework carried forward from Friday: REDUCE in customer-concentrated names (Arm, MU, HYNI, MRVL, ORCL); MAINTAIN picks-and-shovels (AI-power CEG/VST/TLN/GEV/ETN/PWR; physical-AI SYM/CGNX/TER; Broadcom); ADD healthcare (UNH, MRK, LLY, ABBV, XLV); ADD staples (PG, KO, PEP, COST); ADD housing-adjacent cyclicals (DHI, LEN, HD, LOW, SHW); MAINTAIN bank complex (JPM, MS); cash 14%. For this week specifically: (1) TRIM further into ASML Wednesday if it approaches recent highs pre-print; (2) HOLD Alphabet into Wednesday's print — the AI-monetization story is the specific catalyst for a re-rating regardless of capex commentary; (3) ADD Tesla exposure sparingly ahead of the robotaxi read if the pre-print stock is in the $260-$280 range; (4) ADD defense (LMT, RTX) on the Iran weekend escalation; (5) ADD oil complex (XOM, CVX, FANG, EOG) on the Brent breakout to $80. Cash allocation held at 14% given the concentration of catalyst risk into Wednesday.
8. ANALYST CALLS DRIVING ACTION
Upgrades / target hikes: Wells Fargo raised UNH to $700 post-print. Goldman reiterated healthcare sector view Overweight. Bernstein raised Verizon to $52 into today's print. JPMorgan raised BLK to $1,200 following Wednesday's clean beat.
Downgrades / target cuts: BofA cut Alphabet to $220 pre-print on the Moonshot read-through. Morgan Stanley cut Arm further to $145. Wedbush cut Micron to $1,350. Barclays cut NFLX further to $760 on Friday close weakness. Bernstein cut Nvidia to $215 ahead of the Wednesday-cluster event risk.
LMT / RTX / NOC / GD / HII — Defense bid on Iran weekend strikes.
XOM / CVX / FANG / EOG — Oil bid; Brent $80.
DAL / UAL / AAL — Airlines negative on jet-fuel cost.
SPCX — $132.85 below IPO. MS held $130.
Bitcoin — $63,020 (weekend risk-off).
VIX cash — 15.02; front future 17.55 signaling risk repricing.
TLT — Beneficiary of dovish tape but Iran-oil risk caps upside.
10. GLOBAL MACRO SNAPSHOT
Asia: Semi complex under continued pressure on the Moonshot Kimi read-through. Nikkei -0.20%, Hang Seng +0.30% (Chinese domestic tape modestly better on the Moonshot pride/nationalism angle), Shanghai +0.40%. Samsung, SK Hynix (local), Tokyo Electron all softer.
Europe: Modestly firmer on the futures bounce plus defense-sector bid. Stoxx 600 +0.32%. ASML in Amsterdam quiet ahead of Wednesday's Q2 print. European defense (BAE, Thales, Rheinmetall) bid on Iran escalation.
Emerging markets: India strong on domestic tape. Korea, Taiwan under semi-driven pressure. Turkey, MENA under geopolitical-tape pressure but oil-exporters bid.
11. WEEK AHEAD PREVIEW
Today: Verizon (pre-open); IBM (after close); SAP (Europe).
Next Wed 7/29: Meta Q2 — CRITICAL capex watchpoint.
Next Wed 7/30-31: FOMC (85% hold, dovish tone).
Next Fri 7/31: Core PCE.
Fri 8/1: July NFP.
Early August: Nvidia Q2 — decisive for AI-semi tape.
12. THE CLOSING THOUGHT
The week ending Friday July 17 delivered the AI-semi complex's worst weekly performance since the January DeepSeek selloff. Weekly damage: Nasdaq -2.9%, SMH -6.2%, Arm -9.4%, SK Hynix -8.5%, Micron -7.1%, Nvidia -5.8%. Healthcare provided the specific rotation destination: XLV +1.2% weekly, UNH +5.4%. The specific pattern that emerged was clean confirmation of the Second Derivative framework as the operating tape thesis. Weekend added a second-derivative catalyst: Moonshot Kimi K2 released at $0.15 per million input tokens — 17x cheaper than GPT-4o — the second Chinese-AI cost-shock event of 2026. This week's setup is defined by Wednesday's four tape-defining prints: Alphabet (hyperscaler capex + AI monetization), Tesla (robotaxi + Optimus), ASML (semi capex bellwether), IBM (enterprise-AI). U.S.-Iran mutual strikes over the weekend put Brent at $80 and Bitcoin at $63k. Monday's earnings themselves modest — IBM (AH), Verizon (pre-open) — but the week's setup positions each of the next four sessions as more consequential than most. Positioning framework carried forward: reduce customer-concentrated semis, add healthcare and staples, add housing-adjacent cyclicals, maintain bank complex and picks-and-shovels, cash 14%. Wednesday will define the next leg. Trade carefully.
THE BROOKSIDE BRIEF · COMPILED 9:30 AM ET · SOURCES: YAHOO / MOTLEY FOOL / THESTREET (JULY 17 CLOSE + WEEKLY), CNBC / SEEKING ALPHA (JULY 20 FUTURES + EARNINGS PIPELINE), MOONSHOT AI KIMI K2 RELEASE NOTE, COINDESK / OANDA / SAXO (IRAN WEEKEND STRIKES + OIL + BITCOIN), CME FEDWATCH, TREASURY H.15, CBOE (VIX 15.02 CASH / 17.55 FRONT FUTURE), GROUNDBREAKER 'THE SECOND DERIVATIVE' (JULY 2), CITRINI RESEARCH, ASCHENBRENNER
MORNING EDITION · TUESDAY, JULY 21, 2026 · GM BEATS · LMT NEW DEFENSE SYSTEMS · DHI + HOUSING FOLLOW-THROUGH · NASDAQ FUTS +1.4%
Daily Markets Briefing
The Brookside Brief
Markets · Macro · The Day Ahead
EDITOR'S NOTE — EARNINGS CALENDAR CORRECTIONS
Yesterday's brief carried three calendar errors that we want to acknowledge and correct today. First: IBM did NOT report Monday after close. IBM's Q2 preliminary results were actually released July 14 and the stock crashed ~25% on the print (revenue $17.2B up only 1% YoY; software +5%, consulting flat, infrastructure -7% on lower mainframe sales; GAAP EPS $2.27 -2% YoY). IBM's formal Q2 call is Wednesday July 22 at 5:00 PM ET — we should have flagged the preliminary miss in the July 15 brief and did not. Second: Verizon reports Friday July 24 (not Monday). Third: Coca-Cola reports Tuesday July 28 (not today); GE Vernova reports Wednesday July 22 (not today). Actual Tuesday earnings today are GM (already reported — a beat), Lockheed Martin, Northrop Grumman, 3M, D.R. Horton, Danaher, Halliburton, Capital One, and Chubb. Apologies for the errors; we are tightening the calendar-verification process for earnings dates specifically.
1. THE MORNING SETUP
Good morning. Monday delivered a mixed session where the AI-semi complex clawed back some of Friday's damage even as Iran-conflict headlines continued to weigh. Monday's close: S&P 500 -0.19% to 7,443.28; Nasdaq Composite -0.05% to 25,508.07; Dow -0.6%. The specific character of the session: chip names pared their recent losses, with SMH, NVDA and TSMC each recovering 1-2% off the Friday lows. Reports that both the U.S. and Iran remain open to negotiations toward a diplomatic solution helped limit the tape's downside despite the weekend mutual airstrikes. Healthcare pared its gains — UnitedHealth flat, XLV -0.2% — as the specific reason to own defensives moderated on the peace-talk headlines.
Pre-open Tuesday futures point to a broad-based bounce: S&P 500 futures +0.4%, Nasdaq 100 futures +1.4%, Dow futures +0.3% (+129 points). The specific driver is chip-stock strength: NVDA indicated +2% pre-market, TSMC +1.5%, Micron +2.5%, SK Hynix ADRs +1.8%. This is the first specific bounce attempt in the semi complex since Wednesday's TSMC print, and the specific question for today is whether the bounce holds through the cash session or fades into Wednesday's ASML print. The mean-reversion move in DeepSeek in January took roughly three weeks to unwind; today marks day six of the current TSMC-driven selloff.
Today's earnings lineup delivers a clean cyclical read. General Motors reported pre-market with a large beat: adjusted EPS of $3.57 versus $3.20 consensus (+11.6%), revenue $48.03B versus $47.01B expected (+2.2%). Truck and SUV mix strength offset EV-margin drag, and management maintained full-year guidance. Stock is up 2%+ pre-market. Lockheed Martin unveiled two new defense systems overnight aimed at strengthening counter-drone and missile-defense capabilities — the stock is up 1.5% pre-market on the Iran-tape tailwind. Northrop Grumman, 3M, Halliburton, Danaher, Capital One, and Chubb all report today; D.R. Horton reports today and provides the specific housing-sector follow-through to Friday's Housing Starts blowout.
The housing-ecosystem trade set up specifically well on Monday. Following Friday's Housing Starts print (1.427M SAAR vs 1.320M consensus, +19% m/m), the housing complex rallied hard into Monday: DHI +4.2%, LEN +3.8%, TOL +3.5%, KBH +4.0%, MTG +3.2%. Today's D.R. Horton print is the specific catalyst for either confirming or fading the follow-through. Consensus EPS $3.15 on revenue $8.9B, with net orders and gross margins the specific watchpoints given the mixed permits data. If DHI beats on orders, the housing-adjacent trade is set up for a specific multi-week run.
Tomorrow (Wednesday) is the tape-defining day of Q2 season: Alphabet, Tesla, ASML all report Wednesday, IBM's formal Q2 call is Wednesday at 5 PM ET, and Existing Home Sales prints 10 AM. The specific setup: ASML is the semi-capex-cycle bellwether that will confirm or disconfirm last Wednesday's TSMC signal; Alphabet is the hyperscaler-CFO-discipline read post-Moonshot Kimi; Tesla is the physical-AI read; IBM's formal call will address the July 14 preliminary miss and reset the enterprise-AI-monetization narrative. Today's Sector Spotlight walks through the housing-ecosystem follow-through, the Wednesday setup, and the positioning framework for a session where the tape sets up either constructively for a semi-complex rehabilitation bounce or for another leg down.
2. MARKETS AT A GLANCE
U.S. EQUITY FUTURES (PRE-OPEN — BROAD-BASED BOUNCE LED BY CHIPS)
Asset
Last
Change
% Chg
S&P 500 (ES)
7,473
+30
+0.40%
Nasdaq 100 (NQ)
25,995
+360
+1.40%
Dow (YM)
52,050
+129
+0.30%
Russell 2000 (RTY)
2,405
+15
+0.63%
MONDAY JULY 20 CLOSE — MIXED SESSION, CHIPS RECOVERED OFF FRIDAY LOWS
ASIA & EUROPE (INTRADAY) — SEMI COMPLEX FIRMER ON CHIP-REBOUND + GM BEAT
Asset
Last
Change
% Chg
Nikkei 225
39,470
+185
+0.47%
Hang Seng
22,290
+150
+0.68%
Shanghai Composite
3,235
+15
+0.46%
Stoxx Europe 600
572.20
+2.00
+0.35%
FTSE 100
8,895
+15
+0.17%
DAX
20,530
+60
+0.29%
3. TOP STORIES
General Motors Beats Q2 — Stock +2% Pre-Market
General Motors reported Q2 earnings pre-market with a clean beat on both top and bottom lines. Adjusted EPS came in at $3.57 versus $3.20 consensus (11.6% upside); revenue $48.03B versus $47.01B expected (2.2% upside). The specific drivers: continued strength in truck and SUV mix (Silverado, Tahoe, Yukon outperforming) offset EV-margin drag from the Lyriq and Blazer EV. Cruise robotaxi operations remained cash-negative but management framed the H2 path as accelerating. Full-year adjusted EPS guidance maintained in the $12-13 range; free-cash-flow guide raised modestly. Stock is up 2%+ pre-market. The specific read-through for the broader consumer-cyclical tape is constructive — GM beat despite tariff headwinds and macro uncertainty, suggesting the underlying auto-demand tape is holding up better than the softer retail-sales print implied.
Lockheed Martin Unveils Two New Defense Systems
Lockheed Martin unveiled two new defense systems overnight aimed at strengthening counter-drone and missile-defense capabilities. The specific products: an updated tier-2 missile-defense platform designed to complement existing THAAD architecture, and a new class of counter-drone laser system aimed at the low-cost swarm threats that have defined the Iran conflict's specific hardware exchanges. LMT stock is up 1.5% pre-market on the combination of the Iran-tape tailwind and the specific product-cycle news. Lockheed reports Q2 later today (2:00 PM ET). Consensus: EPS $7.35 on revenue $18.05B. The specific watchpoint on the print: backlog growth (already at $175B) and F-35 delivery cadence.
D.R. Horton Reports Today — Housing Follow-Through Test
D.R. Horton reports Q2 pre-open today. Consensus: EPS $3.15 on revenue $8.9B. The specific watchpoints given Friday's Housing Starts blowout: net orders growth (last quarter +2%; watch for acceleration on the June demand recovery), gross margins (running 22-23%; incentive activity is the specific test given affordability constraints), and the H2 delivery guide. DHI stock rallied 4.2% on Monday, continuing Friday's Housing Starts follow-through. A clean beat + raise would set up the housing-adjacent trade for a specific multi-week run as the Fed remains firmly on hold. A miss or cautious guide would fade the Friday Starts print quickly.
IBM Q2 Formal Call Tomorrow at 5 PM ET — Post July 14 Preliminary Miss
IBM's formal Q2 2026 earnings call is Wednesday July 22 at 5:00 PM ET. This follows the company's preliminary release of Q2 numbers on July 14 which triggered a 25% single-day decline in the stock. The preliminary release showed Q2 revenue of $17.2B (only +1% YoY), software segment +5%, consulting flat, and infrastructure -7% on lower mainframe (Z-series) sales and delayed customer spending. GAAP EPS came in at $2.27 (-2% YoY); operating (non-GAAP) EPS at $2.93 (+5% YoY). Bright spots: distributed infrastructure revenue growth of +37% YoY, and Red Hat revenue growth accelerating to +11% YoY. The specific watchpoint on Wednesday's formal call: management's H2 guide, and whether the mainframe weakness is cyclical (delayed enterprise spending returning in H2) or structural (AI-adjacent workloads bypassing mainframe architecture entirely).
Iran Peace-Talk Signals Limit Weekend Damage
Both the U.S. and Iran signaled continued willingness to pursue diplomatic resolution despite the weekend mutual airstrikes. The specific significance: Brent crude backed off Monday to $79.35 (down 0.94%) from the weekend $80+ level; Bitcoin recovered 0.84% to $63,550. The signal is not that the conflict is over — U.S. strikes on Iranian facilities continued through Monday — but that the tail risk of a Strait-of-Hormuz-closure event has moderated. War-risk insurance on Hormuz-transiting vessels held at 0.80% rather than pushing to the 0.85-0.90% range that the weekend strikes had risked. VIX cash bounced +5.5% to 15.85 from Friday's 15.02.
4. MACRO & FED WATCH
The macro tape moves quiet this week ahead of Wednesday's Existing Home Sales (consensus 4.05M SAAR, following June-cycle housing data) and Thursday's jobless claims. The heavier data hits next week: Q2 advance GDP Thursday July 31 (consensus +2.4% annualized), Core PCE Friday July 31, and July NFP Friday August 1. Fed hold at July 30-31 remains firmly base case (85%). September hike odds at 55%; December 50%. The specific Iran-oil risk moderated on Monday's peace-talk signals — Brent back below $80 supports the dovish framing, but the tail risk remains live and the market will watch for any return to escalation this week.
5. ECONOMIC CALENDAR — THIS WEEK AND NEXT
Day
Time (ET)
Release
Consensus / Watchpoint
Tue 7/21
Pre-open
GM Q2 (released)
BEAT: $3.57 EPS vs $3.20 est
Tue 7/21
AM
D.R. Horton Q2
EPS $3.15 / housing test
Tue 7/21
AM
3M, DHR, HAL, COF, CB
Q2 pipeline
Tue 7/21
2:00 PM
Lockheed Martin Q2
EPS $7.35 / backlog watch
Tue 7/21
AH
Northrop Grumman Q2
EPS $6.40
Wed 7/22
Pre-open
ASML Q2
KEY: semi capex bellwether
Wed 7/22
AM
Alphabet (GOOGL) Q2
KEY: hyperscaler capex
Wed 7/22
AM
Tesla (TSLA) Q2
Robotaxi + Optimus
Wed 7/22
10:00 AM
Existing Home Sales
4.05M SAAR
Wed 7/22
5:00 PM
IBM Q2 formal call
Post-July 14 prelim reset
Thu 7/23
8:30 AM
Weekly jobless claims
230K
Thu 7/23
AM
Intel (INTC) Q2
Foundry + fab-capex
Fri 7/24
Pre-open
Verizon (VZ) Q2
EPS $1.22 (moved from Mon)
Fri 7/24
8:30 AM
Durable Goods Orders
+0.6%
Mon 7/28
AM
Coca-Cola (KO) Q2
(moved from Tue 7/21)
Wed 7/29
AM
Meta Q2
CRITICAL: capex commentary
Wed 7/30-31
2:00 PM
FOMC decision
Hold + dovish tone (85%)
Fri 7/31
8:30 AM
Q2 advance GDP
+2.4% annualized
Fri 7/31
8:30 AM
June Core PCE
Fed's preferred inflation
Fri 8/1
8:30 AM
July NFP
Employment tape
6. EARNINGS WATCH
Today's cyclical/defensive cluster is broad but individually second-tier. GM already beat pre-open. LMT and NOC at midday provide the defense read-through. 3M, DHR, HAL provide industrial reads. DHI is the housing-cycle bellwether. COF and CB provide the consumer-credit-and-P&C read. Northrop reports after the close. Wednesday remains the tape-defining day: ASML pre-open (semi capex), GOOGL and TSLA during the session, IBM at 5 PM ET. Meta July 29 and Nvidia Q2 early August remain the two decisive AI-complex prints ahead.
Today's spotlight covers the housing-ecosystem follow-through that emerged specifically on Monday and gets its confirmation test today via D.R. Horton, and the specific setup for tomorrow's four-print tape-defining day. The housing-ecosystem trade is the specific idiosyncratic opportunity in the current tape, and Wednesday will define whether the Second Derivative regime for the AI-semi complex extends or gets a specific rehabilitation catalyst.
Part I — Housing Ecosystem Bid Continues into DHI Print
Friday's Housing Starts blowout (+19% m/m to 1.427M SAAR) produced a concentrated follow-through into Monday across the housing complex. The chart below quantifies the specific moves.
The specific pattern: homebuilders led with the cleanest cash-flow leverage to the Starts print. DHI +4.2%, LEN +3.8%, TOL +3.5%, KBH +4.0%. Home-improvement retail (HD +2.1%, LOW +2.3%) participated but at half the amplitude, consistent with their more diversified end-market exposure. Building-products (SHW +2.8%, MAS +2.5%) took the middle path. Mortgage insurance (MTG +3.2%) rallied as the housing-cycle beneficiary. The specific data point that anchors the framework: the moves compounded on Monday rather than fading, which is the specific signal that the market is repricing the housing-cycle framework rather than reacting to a one-print event.
Fig. 1 — GM Q2 beat: revenue $48.03B vs $47.01B est (+2.2%); adj. EPS $3.57 vs $3.20 est (+11.6%). Stock +2% pre-market.
Today's D.R. Horton print is the specific confirmation/refutation test for the housing-ecosystem framework. If DHI beats on orders (last quarter was +2% y/y; watch for +4-5% or better on the June demand recovery) and maintains gross margins in the 22-23% range without incremental incentive activity, the housing-adjacent trade is set up for a specific multi-week run. If DHI misses on orders, or if gross margins step down materially on incentives, the Friday Starts print gets faded quickly and the housing-ecosystem trade compresses.
WHY THE HOUSING-ECOSYSTEM TRADE COMPLEMENTS THE DEFENSIVE ROTATION
The specific attractiveness of housing-ecosystem exposure in the current tape framework is that it sits at the intersection of three specific tailwinds without direct AI-capex-cycle exposure. First: the Fed's expected hold-with-dovish-tone posture at July 30-31 supports the mortgage-rate framework (30-year fixed currently at 6.15%; a dovish September could push toward 5.80%). Second: the demographic tailwind (household formation running above household completions by roughly 800K/year) remains structurally supportive. Third: unlike healthcare (which faces regulatory-tail-risk from any political-cycle developments) or staples (which face margin compression from commodity input costs on the Iran-oil tape), housing has no specific catalyst risk on the current tape. It is the specific complement to healthcare/staples in a diversified defensive-rotation portfolio — cyclical exposure with structural tailwinds and no crossed-signal risk.
Part II — Wednesday Is The Day
Fig. 3 — Wednesday's four tape-defining prints: ASML, GOOGL, TSLA, IBM, plus Existing Home Sales at 10 AM.
Wednesday concentrates the most decisive session of Q2 season into a single 12-hour window. ASML pre-open (~2:00 AM ET) is the first read; the lithography orders guide will either confirm or disconfirm the TSMC-capex signal from last week. Then Alphabet mid-morning: specific capex disclosure and AI-monetization commentary will define the hyperscaler-CFO-discipline read post-Moonshot Kimi. Tesla mid-session: robotaxi progress and Optimus disclosures move the physical-AI complex. Existing Home Sales at 10 AM provides the housing-cycle read-through to Friday's Starts print. Then IBM at 5 PM ET: the formal Q2 call will address the July 14 preliminary miss and set the enterprise-AI-monetization narrative.
THE SPECIFIC POSITIONING FRAMEWORK FOR A SESSION WITH FOUR CROSS-CUTTING CATALYSTS
The specific challenge with a Wednesday cluster of this density is that the individual reads can pull in opposite directions. If ASML raises capex + Alphabet raises capex, the Second Derivative regime intensifies and the semi-complex reprice extends. If ASML moderates + Alphabet holds capex, the semi complex gets a specific rehabilitation catalyst. If Tesla disappoints on robotaxi + IBM's mainframe weakness turns out structural rather than cyclical, the enterprise-AI-monetization narrative takes another hit. If all four print constructively, the tape stages a specific multi-week bounce. The framework for the day: TRIM further ahead of ASML if it opens above recent highs pre-print; MAINTAIN positioning into GOOGL/TSLA since AI-monetization catalyst can rehabilitate the tape regardless of capex; USE any post-ASML weakness in AI-power (CEG, VST, TLN, GEV) as add opportunity since those names remain capex-independent. Cash allocation held at 14% into the print cluster; will reassess Thursday morning based on the four specific outcomes.
8. ANALYST CALLS DRIVING ACTION
Upgrades / target hikes: Morgan Stanley raised GM to $65 on the pre-open beat. JPMorgan reiterated LMT at $625 on the new defense-system announcements. Wells Fargo raised DHI to $210 into today's print. Goldman raised the housing-cycle sector view to Overweight.
Downgrades / target cuts: BofA held Alphabet at $220 into Wednesday's print. Morgan Stanley cut Arm further to $140 on continued Moonshot read-through. Wedbush maintained MU at $1,350. Barclays cut NFLX to $760 held. Bernstein cut IBM to $185 ahead of the formal call Wednesday.
9. STOCKS TO WATCH
General Motors (GM) — Beat +2% pre-market. MS PT $65.
Lockheed Martin (LMT) — New defense systems + Iran tape. +1.5% pre-open.
DAL / UAL / AAL — Airlines negative on jet-fuel cost.
Bitcoin — $63,550 (recovered).
VIX cash — 15.85 (up +5.5% Mon).
TLT — Beneficiary of dovish tape.
10. GLOBAL MACRO SNAPSHOT
Asia: Firmer on chip-complex rebound and GM-beat read-through. Nikkei +0.47%, Hang Seng +0.68%, Shanghai +0.46%. Samsung, SK Hynix (local), Tokyo Electron all recovered 1-2% off Friday lows.
Europe: Firmer on the general risk-on tape. Stoxx 600 +0.35%. ASML in Amsterdam quiet ahead of tomorrow's Q2 print. European auto names bid on GM beat read-through.
Emerging markets: Broadly firmer on softer dollar + risk-on tape. India strong. Korea, Taiwan bid on semi rebound. Turkey, MENA under continued geopolitical-tape pressure.
Wednesday — CRITICAL: ASML, GOOGL, TSLA, IBM formal call; Existing Home Sales.
Thursday: Intel, T-Mobile, AAL; jobless claims.
Friday: Verizon (moved from Mon); Durable Goods.
Mon 7/28: Coca-Cola (moved from today).
Wed 7/29: Meta Q2 — CRITICAL capex watchpoint.
Wed 7/30-31: FOMC.
Thu 7/31: Q2 advance GDP; Core PCE.
Fri 8/1: July NFP.
Early August: Nvidia Q2 — decisive.
12. THE CLOSING THOUGHT
Monday delivered a mixed session where the AI-semi complex clawed back some of Friday's damage even as Iran-conflict headlines continued to weigh. Chip names pared 1-2% off the Friday lows. Peace-talk signals moderated the Iran-oil tape: Brent back below $80, Bitcoin recovered to $63,550. Pre-open Tuesday futures point to broad-based bounce led by chips (Nasdaq +1.4%, S&P +0.4%). GM beat cleanly pre-market ($3.57 EPS vs $3.20 est), +2%. Lockheed unveiled two new defense systems, +1.5%. D.R. Horton reports today — housing-ecosystem follow-through test after Monday's DHI +4.2%. The specific tape question for today is whether the semi-complex bounce holds through the cash session or fades into Wednesday's ASML print. Wednesday concentrates ASML pre-open + GOOGL and TSLA during the session + Existing Home Sales at 10 AM + IBM's formal Q2 call at 5 PM ET — the most decisive session of Q2 season. Positioning framework held: reduce customer-concentrated semis, hold defensive rotation (health, staples), add housing-ecosystem on any DHI-print confirmation, maintain AI-power picks-and-shovels, cash 14% into Wednesday. Trade carefully.
THE BROOKSIDE BRIEF · COMPILED 9:30 AM ET · SOURCES: THESTREET / CNBC / YAHOO FINANCE (JULY 20 CLOSE), TRADINGKEY (GM Q2 BEAT), STOCKTWITS (LMT NEW DEFENSE SYSTEMS), IBM PRELIMINARY Q2 RELEASE (JULY 14), CME FEDWATCH, TREASURY H.15, CBOE (VIX 15.85), YAHOO / FORTUNE (BITCOIN $63,550), GROUNDBREAKER 'THE SECOND DERIVATIVE' (JULY 2), CITRINI RESEARCH, ASCHENBRENNER
MORNING EDITION · WEDNESDAY, JULY 22, 2026 · ASML BEAT + RAISED · GOOGL AM · TSLA AH · IBM 5 PM · EHS 10 AM
Daily Markets Briefing
The Brookside Brief
Markets · Macro · The Day Ahead
1. THE MORNING SETUP
Good morning. Wednesday is the day. Overnight and pre-open, ASML has already delivered the specific print that reframes the Second Derivative debate: the company BEAT Q2 consensus AND RAISED the full-year 2026 outlook. Q2 net sales €9.3B (versus roughly €8.8B consensus); net income €2.9B; gross margin 54.0%; operating margin 37.1%; basic EPS €7.59. And critically: ASML raised its 2026 net-sales guide to €43-45B from a prior range implying ~€40-42B, and provided Q3 net-sales guidance of €11-12B on a gross margin of 55-57%. Management specifically cited stronger-than-expected demand in installed base management (Q2 IBM sales $3.15B as customers accelerated spending on upgrades and service), continued AI-related demand, strong logic and DRAM investment, solid order visibility into 2027-2028, and progress in High-NA EUV as Intel begins production use.
The specific reframing for the Second Derivative thesis is important. ASML's raise is the specific counter-signal to last week's TSMC capex-raise-triggers-selloff pattern. Two possible readings of the market reaction. Reading A: the market interprets ASML's raise as CONFIRMATION that the AI-capex cycle is structurally durable — hyperscaler ROI concerns are premature, and the semi complex should re-rate higher. Reading B: the market interprets ASML's raise as ADDITIONAL EVIDENCE that the entire semi-supply-chain is levering itself further into a peak that will eventually invert — a Second Derivative extension rather than refutation. The specific test comes in the ASML ADR reaction at U.S. cash open: if ASML opens up 4%+ and holds through the morning, Reading A is in play and the semi complex stages a specific rehabilitation. If ASML opens up on the print but fades through the morning into red on the day, Reading B is the operating framework and the mid-week positioning setup gets more complex.
Tuesday's cash session finally broke the three-day losing streak. All three indexes rallied: S&P 500 +0.89% to 7,509.20; Nasdaq +1.29% to 25,837.21; Dow +0.74% (+385.38) to 52,224.64. The specific character: semi names led (SMH ETF +2.8%, NVDA +2.4%, TSMC +2.1%, Micron +3.2%). 3M jumped 7% on its Q2 beat — the largest single-day gain for MMM in 18 months. GM closed +5% on the pre-open beat we walked through yesterday. UnitedHealth added +1.2% continuing the defensive-rotation position. VIX cash back down to 14.55.
Today's schedule concentrates the most tape-defining hours of Q2 season. ASML already reported pre-open (BEAT + RAISED). Alphabet reports mid-morning: consensus Q2 EPS ~$2.90, revenue ~$118B, Google Cloud +63% YoY expected. The specific number to watch is the 2026 capex guide. Alphabet raised the full-year 2026 capex to $180-190B on the Q1 call; the specific question is whether Q2 brings a further raise, a hold, or (unlikely but critical) a cut. Existing Home Sales prints at 10:00 AM — consensus 4.05M SAAR — provides the housing follow-through to Friday's Starts blowout. Tesla reports after close (5:30 PM ET call) — Q2 deliveries already at 480K record, robotaxi/Optimus commentary is the specific catalyst. IBM's formal Q2 call is at 5:00 PM ET — will address the July 14 preliminary miss and reset the enterprise-AI-monetization narrative.
Pre-open Wednesday futures: S&P +0.3%, Nasdaq +0.5%, Dow +0.2%. The tape is opening constructively on the ASML print, but the specific character of today's tape will be defined by the market's read on GOOGL and by the housing print at 10 AM. Today's Sector Spotlight walks through the ASML reframing implications, the specific positioning framework for GOOGL and TSLA, and the housing-ecosystem follow-through after yesterday's DHI print. Three charts.
2. MARKETS AT A GLANCE
U.S. EQUITY FUTURES (PRE-OPEN — CONSTRUCTIVE ON ASML PRINT)
Asset
Last
Change
% Chg
S&P 500 (ES)
7,530
+21
+0.30%
Nasdaq 100 (NQ)
25,975
+130
+0.50%
Dow (YM)
52,325
+100
+0.20%
Russell 2000 (RTY)
2,410
+5
+0.21%
TUESDAY JULY 21 CLOSE — BROKEN 3-DAY LOSING STREAK
ASIA & EUROPE (INTRADAY) — FIRMER ON ASML RAISE + TUESDAY RALLY
Asset
Last
Change
% Chg
Nikkei 225
39,730
+260
+0.66%
Hang Seng
22,410
+120
+0.54%
Shanghai Composite
3,250
+15
+0.46%
Stoxx Europe 600
574.50
+2.30
+0.40%
FTSE 100
8,910
+15
+0.17%
DAX
20,595
+65
+0.32%
ASML (Amsterdam)
€1,825
+€50
+2.82%
3. TOP STORIES
ASML Beats + Raises 2026 Guide to €43-45B — Specific Second Derivative Counter-Signal
ASML reported Q2 2026 pre-open with a clean beat and a meaningful raise to the full-year outlook. Q2 net sales €9.3 billion (versus roughly €8.8B consensus, ~5.7% upside); net income €2.9B (approximately 15% upside to consensus); gross margin 54.0% (versus 52.5% guide); operating margin 37.1%; basic EPS €7.59. Beat drivers: installed base management sales climbed to $3.15B on customer acceleration of upgrade and service spending; continued strong AI-related demand across both logic and memory. Critically, ASML raised its 2026 net-sales guide to €43-45B from prior implying ~€40-42B, and provided Q3 net-sales guidance of €11-12B on gross margin 55-57%. Management specifically cited solid order visibility into 2027-2028 and progress in High-NA EUV as Intel begins production use of the tool. ASML in Amsterdam is up 2.82% to €1,825; the U.S. ADR is indicated +3.5% pre-market. The specific stock to watch through the cash session: whether ASML holds the pre-market gap or fades meaningfully.
Alphabet Q2 AM — Capex Watch Is The Defining Metric
Alphabet reports Q2 mid-morning today. Consensus: EPS ~$2.90 (range $2.86-$2.95); revenue ~$118B (range $116.8-$120.2B, +21% YoY); Google Cloud growth ~63% YoY. The specific number that matters for the tape: 2026 capex guide commentary. Alphabet's Q1 print raised the full-year 2026 capex to $180-190B — an unprecedented figure driven primarily by AI infrastructure. Q1 capex alone spiked 107% YoY to $35.7B. The specific test today: does Alphabet RAISE the 2026 capex further (which under Second Derivative reading extends the reflexive-flip regime), HOLD the guide (neutral for the framework), or CUT the guide (which would flip the framework to 'CFO discipline emerging' and rally the tape). Additional watchpoints: capex efficiency commentary (specifically post-Moonshot-Kimi), and any commentary on Cloud gross-margin trajectory as inference costs move.
Tesla After Close — Robotaxi + Optimus + FSD Monetization
Tesla reports Q2 after the close today (5:30 PM ET call). Q2 vehicle deliveries hit a record 480,126 units (+25% YoY), production 451,758 (with deliveries exceeding production by ~28K, reflecting inventory drawdown). Energy storage deployments rebounded to 13.5 GWh from 8.8 GWh in Q1. Consensus revenue $24.7-25.6B (some estimates as high as $27.4B); EPS $0.47-0.48 (with wide range of forecasts). The specific catalysts on the print: (1) robotaxi progress — Musk noted on the Q1 call that robotaxi revenue would not be material in 2026, but any updated commentary on Cybercab production timeline or FSD Version 13 rollout materially impacts the physical-AI complex; (2) Optimus production and deployment progress (target of ~10K units by end-2026); (3) automotive gross margins ex-credits (consensus 15-16% versus 14.4% in Q1). Options market pricing a ~7.6% post-earnings swing.
IBM Formal Q2 Call 5 PM ET — Reset After -25% Preliminary Miss
IBM's formal Q2 earnings call is at 5:00 PM ET tonight. The specific setup is unusual: preliminary Q2 results were released July 14 and triggered a 25% single-day decline. Reported metrics: Q2 revenue $17.2B (+1% YoY, well below consensus); software +5%; consulting flat; infrastructure -7% on lower Z-series mainframe sales and delayed customer spending; GAAP EPS $2.27 (-2% YoY); operating (non-GAAP) EPS $2.93 (+5% YoY). Bright spots: distributed infrastructure revenue +37% YoY; Red Hat revenue growth accelerating to +11% YoY. YTD FCF $4.8B. The specific watchpoint tonight: management H2 guide, and whether mainframe weakness is characterized as cyclical (delayed enterprise spending returning in H2) or structural (AI-adjacent workloads bypassing mainframe architecture entirely). The stock closed Tuesday at approximately $175 (well below the July 14 pre-print $228 level). Bernstein's $185 target is the current low on the sell side.
Existing Home Sales 10 AM — Housing Follow-Through Test
Existing Home Sales prints at 10:00 AM ET. Consensus: 4.05M SAAR (versus May's 4.03M, essentially unchanged). Given Friday's Housing Starts blowout (+19% m/m to 1.427M) and yesterday's D.R. Horton print (beat consensus, orders +5% YoY), a stronger-than-expected EHS number would extend the housing-ecosystem rally that has now compounded across three sessions (Friday, Monday, Tuesday). A weaker print would introduce specific concern that new-home construction cannot offset existing-home affordability constraints, and could fade the housing-adjacent trade quickly.
4. MACRO & FED WATCH
The macro tape delivers only Existing Home Sales today and jobless claims tomorrow. Bigger data next week: Q2 advance GDP (Thu 7/31, +2.4% consensus), Core PCE (Fri 7/31), July NFP (Fri 8/1). Fed hold at July 30-31 remains firmly base case (85%). September has become the more consequential decision; the specific swing factor is the August 12 July CPI print. The Iran-oil complex has moderated meaningfully — Brent back to $78.80, peace-talk-signal tape continuing to hold. If the moderation continues through July, the September hold-at-hawkish-tone framing gains support; if the Iran conflict re-escalates, the calculus flips.
5. ECONOMIC CALENDAR
Day
Time (ET)
Release
Consensus / Watchpoint
Tue 7/21
Pre-open
GM Q2 (released)
BEAT: +5% Tue close
Tue 7/21
AM
D.R. Horton (released)
BEAT: orders +5% YoY
Tue 7/21
AM
3M Q2 (released)
BEAT: stock +7% Tue
Wed 7/22
Pre-open
ASML Q2 (RELEASED)
BEAT + RAISED 2026 guide
Wed 7/22
AM
Alphabet (GOOGL) Q2
EPS ~$2.90 / capex WATCH
Wed 7/22
10:00 AM
Existing Home Sales
4.05M SAAR
Wed 7/22
AH
Tesla (TSLA) Q2
Robotaxi + Optimus
Wed 7/22
5:00 PM
IBM formal Q2 call
Post July 14 -25% reset
Thu 7/23
8:30 AM
Weekly jobless claims
230K
Thu 7/23
AM
Intel (INTC) Q2
Foundry + fab-capex
Fri 7/24
Pre-open
Verizon (VZ) Q2
EPS $1.22
Fri 7/24
8:30 AM
Durable Goods Orders
+0.6%
Mon 7/28
AM
Coca-Cola (KO) Q2
Consumer staples read
Wed 7/29
AM
Meta Q2
CRITICAL: capex commentary
Wed 7/30-31
2:00 PM
FOMC decision
Hold + dovish tone (85%)
Thu 7/31
8:30 AM
Q2 advance GDP
+2.4% annualized
Thu 7/31
8:30 AM
June Core PCE
Fed's preferred inflation
Fri 8/1
8:30 AM
July NFP
Employment tape
6. EARNINGS WATCH
Today's four-print cluster is the tape-defining setup of Q2 season. ASML already delivered BEAT + RAISED pre-open. GOOGL mid-morning is the specific hyperscaler-capex test. TSLA after close is the physical-AI read. IBM at 5 PM is the enterprise-AI reset. Thursday brings Intel (fab-capex read) and jobless claims. Friday brings Verizon and Durable Goods. Meta July 29 and Nvidia Q2 in early August remain the two decisive AI-complex prints.
7. SECTOR SPOTLIGHT: ASML REFRAMES THE DEBATE, GOOGL IS THE SPECIFIC TEST
Today's spotlight covers the specific reframing that ASML's BEAT + RAISED does to the Second Derivative debate, presents the hyperscaler-capex table that GOOGL's print will either confirm or challenge, and walks through the Tesla setup with the physical-AI positioning framework.
Part I — ASML Reframes the Debate
Fig. 1 — ASML BEAT Q2 (€9.3B sales, €7.59 EPS) and RAISED 2026 guide to €43-45B. The specific counter-signal to last week's TSMC selloff pattern.
The specific implication of ASML's raise is important to understand precisely. ASML is the specific bottleneck in the AI-semi supply chain — every leading-edge fab that TSMC, Samsung, Intel, or SK Hynix builds requires ASML EUV lithography tools. If ASML is raising 2026 lithography orders guide by €3-4B on the year, that means the fab-buildout cycle is running ABOVE what the market was pricing at the time of last week's TSMC print. In a Second-Derivative framework, the specific concern is that the market will REPRICE this signal — not as demand-side confirmation but as further evidence of leverage that eventually inverts. But the empirical question is whether the market actually reprices it that way today. If ASML holds a +3-4% gap through the cash session, the reflexive-flip narrative has been temporarily arrested. If ASML fades from open to close into red on the day, the Second Derivative regime is more entrenched than we assessed.
WHY THE ASML MARKET REACTION IS THE SPECIFIC TELL
Groundbreaker's Second Derivative framework does not require that AI capex STOPS or that hyperscaler earnings ACTUALLY decline. It requires that the MARKET'S FRAMEWORK for evaluating capex disclosures shifts from 'capex = confidence' to 'capex = leverage.' ASML delivering the specific news that should support the classic framework is the specific test of which framework is now dominant. If today's tape treats ASML's raise the way a bullish tape would treat it (semi complex rallies, SMH extends to fresh highs, memory names re-rate), the operating framework has reverted toward the classic. If today's tape treats ASML's raise the way we've seen TSMC treated (initial pop, then fade, then broad-based semi selling), the Second Derivative framework is fully in force and yesterday's Tuesday rally was a technical bounce rather than a regime shift. The specific hours to watch: 9:30 AM to 11:30 AM ET, before GOOGL's print dominates the tape. Watch ASML, SMH, and NVDA specifically for the pattern.
Part II — GOOGL Is the Specific Test
Fig. 2 — Hyperscaler 2026 capex on record: GOOGL $180-190B guide is more than double 2025. Today's Q2 print will either raise or hold.
Alphabet's mid-morning print is the specific test of hyperscaler-CFO-discipline in real time. The specific number that matters is the 2026 capex guide. Three possible outcomes: Raise — capex moves to $195-210B; under Second Derivative reading, extends the reflexive-flip regime and would send GOOGL down 3-5% intraday even on a revenue and EPS beat. Hold — guide maintained at $180-190B; neutral for framework, GOOGL trades on specific-story items (Cloud growth, Search-market-share metrics, ads revenue). Cut — guide lowered to $170-180B or similar; would flip the framework to 'CFO discipline emerging' and rally the hyperscaler complex meaningfully. The base-case expectation is Hold, but the specific tail risks in both directions are meaningful and the options market is pricing an implied 5% post-earnings move.
Part III — TSLA After Close: Physical AI + Robotaxi + Optimus
Fig. 3 — Tesla Q2 record 480K deliveries (+25% YoY). Robotaxi + Optimus + FSD commentary after close is the specific catalyst.
Tesla's after-close print is not a capex read (Tesla capex remains modest at roughly $10B/year) but a physical-AI read. Q2 deliveries at 480K represent the specific evidence that the demand curve has recovered from the Q1 dip (380K). Energy storage 13.5 GWh from 8.8 GWh is the specific evidence that the non-auto business is compounding rapidly. The specific catalysts on tonight's call: (1) robotaxi commentary — Musk said in Q1 that robotaxi revenue would not be material in 2026, but any updated commentary on Cybercab timeline or FSD Version 13 rollout materially impacts the physical-AI complex (SYM, CGNX, TER meaningfully sensitive); (2) Optimus production and deployment progress (target ~10K units by year-end 2026); (3) auto gross margins ex-credits (consensus 15-16% versus 14.4% Q1). Options market implying ~7.6% post-earnings swing.
THE UPDATED POSITIONING FRAMEWORK FOR THE FOUR-PRINT CLUSTER DAY
The framework we walked through yesterday holds with the following specific adjustments given ASML's BEAT + RAISED: (1) HOLD off on further semi-complex reduction until the ASML market reaction plays out in the U.S. cash session. If ASML holds the pre-open gap through the day, the Second Derivative framework may be temporarily arrested and further reductions premature; if ASML fades, execute planned reductions in Arm, Micron, Marvell. (2) HOLD Alphabet into the print — the AI-monetization story provides upside optionality that specific-name-cuts cannot capture. (3) TSLA is a tactical trade only given the ~7.6% implied swing; add sparingly if pre-print in $250-270 range with a specific plan to trim on any post-print rally. (4) HOLD housing-ecosystem exposure (DHI, LEN, HD, LOW, SHW) and lean in modestly on any post-EHS strength. (5) HOLD healthcare (UNH, MRK, LLY, ABBV, XLV) and staples (PG, KO, COST) as base defensive-rotation. (6) HOLD AI-power picks-and-shovels (CEG, VST, TLN, GEV, ETN, PWR) — capex-independent. (7) TRIM defense exposure (LMT, RTX, NOC, GD) modestly on the Iran peace-talk-signal tape moderation. Cash allocation reduced to 12% (from 14%) given constructive ASML pre-open, but ready to raise back to 15% if GOOGL delivers a capex raise.
8. ANALYST CALLS DRIVING ACTION
Upgrades / target hikes: BofA raised ASML to $1,050 post-print. JPMorgan raised GM to $70 after +5% Tuesday. Wells Fargo raised 3M to $175 post-print. Goldman raised DHI to $220 post-print. Bernstein raised NVDA to $225 on the ASML read-through. Morgan Stanley raised UNH to $700.
Downgrades / target cuts: Barclays cut NFLX to $760 held. Bernstein cut IBM to $185 held ahead of tonight's call. Wedbush cut TSLA into print at $340.
LEN / TOL / KBH — Homebuilders housing-ecosystem trade.
HD / LOW — Home improvement.
SHW / VMC / MLM / MAS / LII — Building products.
MTG / ESNT — Mortgage insurance.
Netflix (NFLX) — Barclays $760 held.
LMT / RTX / NOC / GD — Defense; trim on Iran peace-talk moderation.
XOM / CVX / FANG / EOG — Oil; Brent $78.80.
DAL / UAL / AAL — Airlines less negative on jet-fuel moderation.
Bitcoin — $64,180 (recovered further).
VIX cash — 14.55 (-8.2% Tue).
TLT — Beneficiary of dovish tape.
10. GLOBAL MACRO SNAPSHOT
Asia: Firmer on ASML read + Tuesday U.S. rally. Nikkei +0.66%, Hang Seng +0.54%, Shanghai +0.46%. Samsung +2.1%, SK Hynix (local) +2.5%, Tokyo Electron +3.2% on the ASML raise read-through.
Europe: Firmer on ASML print. Stoxx 600 +0.40%. ASML in Amsterdam +2.82% to €1,825 leads the semi complex.
Emerging markets: Broadly firmer. India, Korea, Taiwan all bid on the AI-semi recovery signal. MENA under continued geopolitical pressure but oil-exporters bid.
11. WEEK AHEAD PREVIEW
Today: ASML released (BEAT + RAISED); GOOGL AM; EHS 10 AM; TSLA AH; IBM 5 PM.
Wednesday is the day. Overnight and pre-open, ASML has already delivered a clean BEAT and RAISED the 2026 net-sales guide to €43-45B — the specific counter-signal to last week's TSMC capex-raise-triggers-selloff pattern. Whether this counter-signal actually arrests the Second Derivative framework or is treated by the tape as further evidence of leverage is the specific test that plays out in the U.S. cash session between 9:30 AM and 11:30 AM. Alphabet reports mid-morning — the specific hyperscaler-CFO-discipline test — with the 2026 capex guide as the number that matters. Existing Home Sales at 10 AM provides the housing follow-through to Friday's Starts print. Tesla after close (5:30 PM) on the physical-AI catalyst. IBM at 5 PM ET for the enterprise-AI reset. Tuesday's cash-session rally (+1.29% Nasdaq, +0.89% S&P) broke the three-day losing streak on 3M's +7% beat and GM's +5% follow-through. The specific framework for today: hold semi-complex reductions pending the ASML market reaction, hold Alphabet into the print, add TSLA sparingly ahead of the print, hold housing-ecosystem and defensives, cash 12% (down from 14% yesterday). Trade carefully. This is the specific session that defines the next four weeks of the tape.
THE BROOKSIDE BRIEF · COMPILED 9:30 AM ET · SOURCES: THESTREET / YAHOO FINANCE / GLOBE AND MAIL (JULY 21 CLOSE), ASML Q2 2026 EARNINGS RELEASE (BEAT + RAISED), ALPHABET Q1 2026 CAPEX GUIDE ($180-190B), TESLA Q2 VEHICLE DELIVERY RELEASE (480K RECORD), IBM PRELIMINARY Q2 RELEASE (JULY 14), CME FEDWATCH, TREASURY H.15, CBOE (VIX 14.55), YAHOO / FORTUNE (BITCOIN $64,180), GROUNDBREAKER 'THE SECOND DERIVATIVE' (JULY 2), CITRINI RESEARCH, ASCHENBRENNER
MORNING EDITION · THURSDAY, JULY 23, 2026 · GOOGL SANK ON $205B CAPEX RAISE · TSLA -4% AH ON EPS MISS · BRENT +3.4% TO $94 · 10Y 4.63%
Daily Markets Briefing
The Brookside Brief
Markets · Macro · The Day Ahead
EDITOR'S NOTE — EXISTING HOME SALES SCHEDULING CORRECTION
Yesterday's brief listed Existing Home Sales as a Wednesday 10 AM print. That was wrong: the June EHS number was actually released July 9 (down 2.4% m/m to 4.09M SAAR; average price $440,600, +1.8% YoY). The next Existing Home Sales release is July 2026 data on Tuesday August 11 at 10 AM ET. Apologies for the error. Continuing to tighten calendar verification.
1. THE MORNING SETUP
Good morning. The Second Derivative framework has been specifically validated. Alphabet reported Q2 after the close: revenue $119.8B (+24% YoY, beating consensus $118B); Google Cloud revenue $24.8B (+82% YoY, the largest single growth quarter in Cloud's history); Cloud operating margin more than tripled to 35.6%; Cloud backlog swelled +$50B sequentially to $514B; Search revenue $63.3B (+17%). Operating income $40.8B (+30%). By any classic framework, this is the print of the year. And yet — Alphabet's stock sank in after-hours trade on the specific news that management raised the 2026 capex guide to $205B from the prior $180-190B. Q2 capex alone hit a record $44.9B, which pushed free cash flow to NEGATIVE $5.9 billion. Management specifically warned that 2027 will see 'significant further increase' in capex. This is the specific reflexive-flip pattern that Groundbreaker's Second Derivative framework anticipated: a company with an extraordinary print gets punished on the capex acceleration signal. Reading B from yesterday's spotlight was the correct read.
Tesla's after-close print was similarly structural. Revenue $28.24B (+26% YoY, beating $25.71B consensus by ~10%). But adjusted EPS came in at $0.33 versus $0.51 consensus (a 35% miss). Net income fell 5% to $1.11B. Automotive gross margin 16.9% (16.3% ex-credits) — modestly better than consensus 15-16%. But the specific damage was in operating income: GAAP operating income dropped 57% YoY to $398M, with operating margin collapsing to 1.4% from Q1's 3.2% and Q2 2025's 6.4%. TSLA closed the after-hours session down approximately 4%. The delivery beat (480K record, +25% YoY) was overwhelmed by the margin compression that AI-infrastructure spending and robotaxi ramp are producing.
The Wednesday cash session itself opened constructively on ASML's BEAT + RAISED but faded through the day into a soft close: S&P 500 -0.14% to 7,498.96; Nasdaq Composite -0.57% to 25,690.90; Dow -0.01% (-6.06 pts) to 52,218.58. The specific characteristic: ASML in the U.S. gapped up 3% at the open but faded to close +0.8% on the day. This is the specific pattern the Second Derivative framework identifies as regime-defining — even the specific bullish counter-signal fades intraday. Reading B from yesterday's spotlight was correct not only for GOOGL but for the whole tape.
The geopolitical layer moved dramatically. Brent crude surged +3.4% to $94.07 per barrel on Wednesday, briefly topping $95 — the highest level in over a month and the largest single-day move of the cycle. The trigger: a fresh round of Iran-related escalation combined with a 2.6-million-barrel build in U.S. crude inventories and specifically limited emergency reserves. Coupled with the AI-capex tape damage, the 10-year Treasury yield approached 4.63% — a two-month peak. This is the specific combination that flips the September FOMC calculus from firmly-dovish to genuinely-uncertain: an oil-driven inflation impulse (Brent +18% in a week) combined with a hyperscaler-capex fiscal-drag concern.
IBM's formal Q2 call after close addressed the July 14 preliminary miss. Management characterized the mainframe weakness as cyclical rather than structural — delayed customer spending returning in H2 — and provided guidance consistent with the preliminary numbers. The stock added modestly in after-hours as bulls interpreted the cyclical framing constructively. That said, the specific bear case (AI-adjacent workloads bypassing mainframe architecture) remains unresolved; the H2 execution is the specific test.
Pre-open Thursday futures reflect the after-close damage plus the oil/yields combination: S&P 500 futures -0.5%, Nasdaq 100 futures -0.7%, Dow futures -0.5%. Alphabet indicated -4% pre-market. Tesla indicated -4% pre-market. Semi complex under pressure again: NVDA -2%, AVGO -1.5%, ASML -2% giving back Wednesday's cash gain. Intel reports after the close today (consensus EPS $0.22 on revenue $14.45B); the options market is pricing an implied 15% post-earnings swing given Intel's specific position at the intersection of the foundry-capex debate, High-NA EUV progress, and Apple/Microsoft partnership speculation. Today's Sector Spotlight walks through the specific validation of the Second Derivative framework and updates the positioning framework meaningfully.
2. MARKETS AT A GLANCE
U.S. EQUITY FUTURES (PRE-OPEN — SEMI COMPLEX REVERSING WED GAIN)
Asset
Last
Change
% Chg
S&P 500 (ES)
7,462
-38
-0.50%
Nasdaq 100 (NQ)
25,510
-180
-0.70%
Dow (YM)
51,960
-260
-0.50%
Russell 2000 (RTY)
2,388
-15
-0.62%
WEDNESDAY JULY 22 CLOSE — ASML POP FADED, NASDAQ GAVE BACK TUESDAY GAIN
Asset
Last
Change
% Chg
S&P 500
7,498.96
-10.24
-0.14%
Nasdaq Composite
25,690.90
-146.31
-0.57%
Dow Jones Industrial Avg.
52,218.58
-6.06
-0.01%
Russell 2000
2,403
-2
-0.08%
VIX (cash)
15.05
+0.50
+3.4%
RATES & FX — 10Y APPROACHING 4.63%, TWO-MONTH PEAK
ASIA & EUROPE (INTRADAY) — WEAK ON U.S. AH DAMAGE + OIL SURGE
Asset
Last
Change
% Chg
Nikkei 225
39,390
-340
-0.86%
Hang Seng
22,180
-230
-1.03%
Shanghai Composite
3,235
-15
-0.46%
Stoxx Europe 600
569.80
-4.70
-0.82%
FTSE 100
8,865
-45
-0.51%
DAX
20,415
-180
-0.87%
ASML (Amsterdam)
€1,795
-€30
-1.64%
3. TOP STORIES
Alphabet Sinks on $205B Capex Raise — Second Derivative Validated
Alphabet reported Q2 after the close with a specifically extraordinary print: revenue $119.8B (+24% YoY, beating $118B consensus); Google Cloud revenue $24.8B (+82% YoY — the largest single growth quarter in Cloud's history); Cloud operating margin more than tripled to 35.6%; Cloud backlog swelled +$50B sequentially to $514B; Search revenue $63.3B (+17%, reflecting strong AI-driven query expansion); operating income $40.8B (+30% YoY). By classic tape framework, this is a bullish print. And yet, GOOGL stock sank in after-hours trade. The specific trigger: management raised the 2026 capex guide to $205B from the prior $180-190B — an additional ~$15-20B raise on an already unprecedented number. Q2 capex alone hit a record $44.9B, which pushed free cash flow to negative $5.9B for the quarter. Management specifically warned that 2027 will see 'significant further increase' in capex. This is the specific reflexive-flip pattern anticipated. The Second Derivative framework has now been validated across three distinct hyperscaler-adjacent tests in nine days: TSMC (-5% on capex raise), ASML (bullish print faded intraday), and now GOOGL (extraordinary print sank on capex raise). The framework is fully operational.
Tesla Beats Revenue, Misses EPS — Operating Margin Collapses to 1.4%
Tesla reported Q2 after the close with a mixed print. Revenue $28.24B (+26% YoY, beating $25.71B consensus by ~10%). But adjusted EPS came in at $0.33 versus $0.51 consensus (a 35% miss). Net income fell 5% to $1.11B. Automotive revenue $20.52B (+23% YoY); automotive gross margin 16.9%, or 16.3% without regulatory credits (modestly better than consensus 15-16%). But the specific damage was in operating income: GAAP operating income dropped 57% YoY to $398M, with operating margin collapsing to 1.4% from Q1's 3.2% and Q2 2025's 6.4%. Delivery beat (480K record, +25% YoY) was overwhelmed by margin compression. Musk's commentary on the call emphasized robotaxi milestones (fleet expanded to 45 vehicles in Austin), Optimus progress, and continued FSD Version 13 training work — but provided no specific timeline for material revenue contribution. TSLA closed after-hours down approximately 4%.
Brent Surges +3.4% to $94.07 — Iran Escalation Combined With U.S. Inventory Build
Brent crude futures rose approximately 3.4% Wednesday to settle at $94.07 per barrel — the highest level in over a month, briefly topping $95 intraday. The specific catalysts: (1) fresh round of Iran-related escalation with reports of U.S. facilities in Syria taking a second attack in the specific 96-hour window; (2) 2.6-million-barrel BUILD in U.S. crude inventories that came alongside management commentary on 'limited emergency reserves,' introducing a specific structural-tightness concern in the U.S. market; (3) Strait of Hormuz safe-passage insurance pricing pushed to 0.90% (from 0.80% Tuesday). WTI up commensurately to $91.20 (+18.6% two-day). The specific spillover: 10-year Treasury yield jumped 18 basis points to 4.63% (two-month peak), Bitcoin fell 2.12% to $62,820. Defense and oil names bid; airlines, transports, and consumer-discretionary names hit.
IBM Formal Call — Mainframe Weakness Characterized as Cyclical
IBM's formal Q2 call after the close addressed the July 14 preliminary miss. Management characterized the Z-series mainframe weakness as cyclical rather than structural — delayed enterprise IT spending expected to return in H2 as customers complete AI-infrastructure planning cycles. H2 guidance was consistent with the preliminary numbers; distributed infrastructure +37% YoY was highlighted as evidence that IBM's AI-adjacent product portfolio is growing; Red Hat +11% YoY confirmed. Stock added modestly in after-hours as bulls interpreted the cyclical framing constructively. The specific bear case (AI-adjacent workloads bypassing mainframe architecture) was not addressed directly and remains unresolved.
Intel Reports After Close — Foundry + Fab-Capex + Partnership Speculation
Intel reports Q2 after the close today. Consensus: EPS $0.22 on revenue $14.45B. Options market pricing implied 15% post-earnings swing. The specific setups: (1) foundry-business commentary — Intel is at the specific intersection of the fab-capex debate that TSMC/ASML have now framed; (2) High-NA EUV progress (Intel is the first commercial customer beginning production use of the tool per ASML's Wed disclosure); (3) any commentary on the Apple or Microsoft partnership speculation that has driven the stock +163% YTD; (4) whether management provides a specific Intel Foundry-Services (IFS) revenue disclosure for the first time.
4. MACRO & FED WATCH
The macro tape shifted meaningfully Wednesday. The oil surge + yields spike combination specifically challenges the previously firmly-dovish September FOMC framing. Fed-funds futures repriced Wednesday: July hike odds still essentially zero at 5% (July 30-31 hold remains base case at ~78% versus 85% Tuesday); September hike odds jumped to 68% from 55% Tuesday; December to 62% from 50%. The specific mechanism: if Brent sustains above $90 through August, the July CPI print (August 12) will show a specific energy contribution that neutralizes the recent core-inflation moderation. Combined with the fiscal-drag concern from hyperscaler capex spending, the framework flips to structurally more hawkish.
Today: weekly jobless claims at 8:30 AM (consensus 230K). If claims tick up meaningfully (>240K), the labor-market softening narrative regains some traction and moderates the yield spike. If claims come in in-line or below, the yield spike compounds and the hawkish repricing extends. Tomorrow: Durable Goods Orders (consensus +0.6%). Next Thursday and Friday deliver the specific data cluster that defines the September decision: Q2 advance GDP, Core PCE, July NFP.
5. ECONOMIC CALENDAR
Day
Time (ET)
Release
Consensus / Actual
Wed 7/22
Pre-open
ASML Q2 (released)
BEAT + RAISED / faded intraday
Wed 7/22
AH
Alphabet Q2 (released)
BEAT / -4% AH on $205B capex
Wed 7/22
AH
Tesla Q2 (released)
REV beat / EPS miss / -4% AH
Wed 7/22
5 PM
IBM formal call (released)
Cyclical framing / modest up
Thu 7/23
8:30 AM
Weekly jobless claims
230K
Thu 7/23
AH
Intel (INTC) Q2
EPS $0.22 / 15% implied swing
Thu 7/23
AH
T-Mobile / AAL
Consumer + airline reads
Fri 7/24
Pre-open
Verizon (VZ) Q2
EPS $1.22
Fri 7/24
8:30 AM
Durable Goods Orders
+0.6%
Mon 7/28
AM
Coca-Cola (KO) Q2
Consumer staples read
Tue 7/29
AM
P&G (PG) Q2
Staples read
Wed 7/29
AM
Meta Q2
CRITICAL: capex commentary
Wed 7/30-31
2:00 PM
FOMC decision
Hold (dovish tone at risk)
Thu 7/31
8:30 AM
Q2 advance GDP
+2.4% annualized
Thu 7/31
8:30 AM
June Core PCE
Fed preferred inflation
Fri 8/1
8:30 AM
July NFP
Employment tape
Tue 8/11
10 AM
July Existing Home Sales
Housing follow-up (moved)
Wed 8/12
8:30 AM
July CPI
CRITICAL — Sept FOMC swing
6. EARNINGS WATCH
Yesterday's four-print cluster played out with structural implications: ASML BEAT + RAISED but faded intraday; GOOGL delivered an extraordinary print but sank -4% AH on the capex raise; TSLA revenue beat but margin collapsed and stock -4% AH; IBM cyclical framing modestly constructive. Today: Intel after close, T-Mobile, American Airlines, jobless claims. Tomorrow: Verizon + Durable Goods. Meta Wednesday July 29 is now genuinely CRITICAL — after Alphabet's $205B capex raise, Meta's positioning as the potential hyperscaler-CFO-discipline first-mover has become the specific tape-defining question of the next two weeks.
7. SECTOR SPOTLIGHT: SECOND DERIVATIVE VALIDATED + IRAN-OIL REPRICING
Today's spotlight covers the specific validation of the Second Derivative framework via GOOGL's after-close reaction, the parallel structural damage in Tesla's operating margin, and the specific macro repricing that Brent's $15/bbl surge introduces. Three charts.
Part I — The Framework Is Validated
Fig. 1 — GOOGL 2026 capex raised to $205B from $180-190B. Q2 capex $44.9B pushed FCF to -$5.9B. Reflexive-flip triggered stock decline despite extraordinary print.
The specific pattern that GOOGL's after-hours reaction produced is now the third distinct validation of the Second Derivative framework in nine days. TSMC on July 15 delivered a beat + capex raise and stock fell 5%. ASML on July 22 delivered a beat + raise and initial pop faded through the session. And now GOOGL on July 22 delivered what is arguably the most constructive hyperscaler print of the AI cycle — 82% Cloud growth, $514B backlog, 35.6% Cloud operating margin — and yet sank -4% in after-hours on the specific capex-raise signal. The framework has moved from theoretical to empirically operational.
WHY GOOGL SPECIFICALLY WAS THE DECISIVE TEST
TSMC and ASML are semi-supply-chain names — their capex signals are one step removed from the ultimate hyperscaler decision. GOOGL is the hyperscaler itself, and Alphabet has historically been the specifically-most-disciplined-hyperscaler on capital allocation (versus Meta's Metaverse spending, Amazon's fulfillment build, Microsoft's OpenAI commitment). If Alphabet — the specifically-most-conservative hyperscaler — raises 2026 capex by $15-20B on top of the already-unprecedented $180-190B guide and warns of 'significant further increase' in 2027, the market has to price the specific possibility that no hyperscaler will provide the CFO-discipline signal that Groundbreaker identifies as the reflexive-flip catalyst. Meta on July 29 becomes the specific last-line-of-defense against the framework becoming fully self-reinforcing. If Meta ALSO raises 2026 capex meaningfully (from the current $70B guide), the framework is complete and the AI-semi complex faces a specific structural repricing of 15-25% into the H2 tape.
Part II — Tesla's Operating Margin Collapse
Fig. 2 — Tesla GAAP operating margin collapsed to 1.4% in Q2 from 6.4% a year ago. Even a record delivery quarter couldn't offset AI + robotaxi spending.
Tesla's after-close print is a specific structural data point in the physical-AI framework. The revenue beat ($28.24B versus $25.71B) reflects the record 480K deliveries. But the specific damage is in the operating-margin collapse to 1.4% from 6.4% a year ago and 3.2% in Q1. The mechanism: AI-infrastructure spending (Tesla's Dojo training cluster), robotaxi ramp costs, Optimus development costs, and FSD Version 13 training expenses have all accelerated meaningfully. Under a classic framework, these are investments that generate future returns and the market should look through them. Under the Second Derivative framework, they are the specific evidence that even Tesla — the most vertically-integrated physical-AI operator — cannot generate GAAP profitability on the current AI-spending trajectory. The specific stocks to watch: physical-AI names (SYM, CGNX, TER) which are less capital-intensive and therefore specifically-more-attractive as physical-AI exposure without the margin-collapse concern.
Part III — Brent to $94 Repricing the Macro
Fig. 3 — Brent crude trajectory July 13-22. +3.4% Wednesday to $94.07, briefly topped $95, highest in over a month.
Brent crude's +3.4% surge to $94.07 on Wednesday is the specific macro development that changes the September FOMC calculus. The specific mechanism is direct: Fed's June inflation framework already had the economy at or near the 2% target on core-PCE. The 25% surge in Brent over 10 days (from mid-July $75 to Wednesday $94) will drive a meaningful energy-inflation contribution into the July CPI print (August 12). Under normal circumstances this would be looked through as a supply-shock, but the specific coincidence with hyperscaler-capex acceleration (which is a fiscal-adjacent positive impulse) makes it harder to look through. Fed-funds futures repriced Wednesday: September hike odds jumped to 68% from 55% Tuesday; December 62% from 50%. 10-year yield spiked 18bps to 4.63% — the specific evidence the market is repricing.
THE UPDATED POSITIONING FRAMEWORK — AFTER THE FRAMEWORK VALIDATION
Yesterday morning we said the framework for the day was 'hold semi-complex reductions pending ASML market reaction; hold GOOGL into the print.' Both of those held constructively into the ASML/GOOGL prints (ASML gapped up 3% early, GOOGL closed +0.5% pre-print). Both then reversed hard on the specific reflexive-flip triggers. Now the positioning framework updates to specific action. REDUCE further in customer-concentrated semis (Arm, MU, MRVL). REDUCE in Alphabet specifically — the specific trigger has fired. REDUCE Tesla into any pre-open bounce. ADD modestly to energy (XOM, CVX, FANG, EOG) on the Brent breakout — the specific setup is now structural not tactical. MAINTAIN healthcare (UNH, MRK, LLY, XLV) and staples (PG, KO, PEP, COST) — defensive rotation is now specifically justified by both the AI-capex regime and the geopolitical premium. MAINTAIN housing-ecosystem (DHI, LEN, HD, LOW, SHW) with a lower-conviction stance given the yields spike. MAINTAIN AI-power (CEG, VST, TLN, GEV, ETN, PWR) — capex-independent structure insulates these from the reflexive-flip. MAINTAIN defense (LMT, RTX, NOC, GD) given Iran re-escalation. MAINTAIN bank complex (JPM, MS) on steepened curve. Cash allocation raised to 16% from 12% Wednesday. Meta July 29 is the specific catalyst that could either extend or arrest the current selling wave.
8. ANALYST CALLS DRIVING ACTION
Upgrades / target hikes: JPMorgan raised XOM to $150 on Brent spike. Goldman raised CVX to $185. Morgan Stanley raised LMT to $650 on Iran escalation. Bernstein raised CEG to $340 on capex-independent framework attractiveness.
Downgrades / target cuts: BofA cut Alphabet to $210 post-print on the $205B capex raise. Morgan Stanley cut Tesla to $290 on operating margin collapse. Wedbush cut Micron further to $1,300. Barclays cut Amazon to $195 pre-print on read-through. JPMorgan cut Meta to $565 pre-print on next-week capex risk.
SYM / CGNX / TER — Physical-AI without margin-collapse concern. Specifically attractive.
JPM / MS / BLK — Bank complex core long.
DHI / LEN / TOL / KBH — Homebuilders under yields pressure now.
HD / LOW — Home improvement.
SHW / VMC / MLM / MAS — Building products.
MTG / ESNT — Mortgage insurance.
LMT / RTX / NOC / GD — Defense bid on Iran; MS raised LMT $650.
XOM / CVX / FANG / EOG — Oil bid on Brent $94. JPM raised XOM $150, GS raised CVX $185.
DAL / UAL / AAL — Airlines hit on jet-fuel spike.
XLE — Energy sector ETF specific beneficiary.
USO — Oil ETF; direct exposure.
Bitcoin — $62,820 (down on risk-off).
VIX cash — 15.05 (+3.4% Wed).
TLT — Under pressure on yields spike.
10. GLOBAL MACRO SNAPSHOT
Asia: Weak on U.S. AH damage + oil surge. Nikkei -0.86%, Hang Seng -1.03%, Shanghai -0.46%. Chip complex under pressure again. Airlines and oil-consuming industrials hit; oil-producing MENA names bid.
Europe: Under pressure on the same combination. Stoxx 600 -0.82%. ASML in Amsterdam -1.64% giving back Wed gains. European defense names bid on Iran escalation.
Emerging markets: Broadly mixed. India firm. Korea, Taiwan under semi pressure. MENA oil-exporters bid; oil-importers under pressure.
Wed 7/29 (AM): Meta Q2 — CRITICAL capex watchpoint.
Wed 7/30-31: FOMC (hold base case but dovish tone at risk).
Thu 7/31: Q2 advance GDP; Core PCE.
Fri 8/1: July NFP.
Tue 8/11: Existing Home Sales.
Wed 8/12: July CPI — CRITICAL for Sept FOMC.
Early August: Nvidia Q2.
12. THE CLOSING THOUGHT
The Second Derivative framework has been specifically validated. Alphabet delivered arguably the most extraordinary hyperscaler print of the AI cycle — revenue $119.8B (+24%), Google Cloud +82%, Cloud operating margin 35.6%, backlog +$50B to $514B — and sank -4% AH on the specific news that management raised the 2026 capex guide to $205B from $180-190B. Reading B was correct. Combined with TSMC's July 15 selloff on capex raise and ASML's July 22 intraday fade despite BEAT + RAISED, the framework has moved from theoretical to empirically operational across three distinct hyperscaler-adjacent tests in nine days. Tesla's revenue beat but 35% EPS miss + operating-margin collapse to 1.4% is the specific parallel damage in the physical-AI complex. Brent surged +3.4% to $94.07 on Iran + U.S. inventory build; 10-year yield spiked 18 bps to 4.63% (two-month peak); September FOMC hike odds jumped to 68% from 55%. Positioning: reduce GOOGL and Tesla, add energy (XOM, CVX, FANG, EOG) on Brent breakout, maintain healthcare/staples/AI-power/defense/banks, cash raised to 16%. Meta Wednesday July 29 is now the specific last-line-of-defense against the Second Derivative framework becoming fully self-reinforcing. If Meta ALSO raises 2026 capex meaningfully, the AI-semi complex faces a specific structural repricing of 15-25% into H2. Trade carefully.
THE BROOKSIDE BRIEF · COMPILED 9:30 AM ET · SOURCES: CNBC / SEEKING ALPHA / MOTLEY FOOL (JULY 22 CLOSE), ALPHABET Q2 2026 EARNINGS RELEASE (BEAT / $205B CAPEX), TESLA Q2 2026 EARNINGS RELEASE (BEAT REV / MISS EPS), ICE BRENT AUG FUTURES ($94.07), TREASURY H.15 (10Y 4.63%), CME FEDWATCH, CBOE (VIX 15.05), FORTUNE / YAHOO (BITCOIN $62,820), GROUNDBREAKER 'THE SECOND DERIVATIVE' (JULY 2), CITRINI RESEARCH, ASCHENBRENNER
Yesterday's brief characterized TSLA's after-hours reaction as '-4%.' The cash-session damage came in materially worse: TSLA closed Thursday down approximately 14%, its worst single-session decline in six months. The specific trigger was Musk's earnings call commentary — he offered no specific 'material revenue' timeline for robotaxi, walked back Optimus 10K-by-year-end target to 'we'll see,' and reframed FSD Version 13 as 'incremental training work' rather than release-imminent. That degradation of physical-AI narrative combined with the operating-margin collapse to 1.4% overwhelmed the revenue beat. Sizing this correctly: TSLA lost roughly $200B in market cap on the day. We under-scoped the risk in the AH characterization.
1. THE MORNING SETUP
Good morning. Thursday's cash session confirmed the Second Derivative framework in the most severe way possible: the AI-hyperscaler complex sold off aggressively on Wednesday's after-close prints, with Tesla down 14% and Alphabet down 7% in the cash session. Combined, the two names lost roughly $350B in market capitalization on the day. The broader indices followed: S&P 500 -1.21% to 7,408.30; Nasdaq Composite -2.15% to 25,137.69 (its worst session in over a month); Dow -506.93 points (-0.97%) to 51,711.65. The specific character of the session: the selloff concentrated in AI-adjacent names but broadened into the broader semi complex as the day wore on — SMH -3.8%, Nvidia -3.5%, Broadcom -2.8%, AMD -2.5%, Microsoft -2.1%, Amazon -3.2%, Meta -2.6% (positioning ahead of next Wednesday's print). The pattern is the full compounding pattern that the Second Derivative framework anticipated: the reflexive-flip on capex signals cascades into the broader complex rather than mean-reverting.
Intel provided the specific counter-story after the close. INTC reported Q2 with a blowout beat: adjusted EPS $0.42 versus $0.21 expected (100% beat), revenue $16.1B versus $14.42B expected (12% beat), and 25% revenue growth (the fastest for any period in almost 15 years). Q3 guide: EPS $0.38 on revenue $15.8-16.8B (both above consensus). The specific drivers per management: acceleration in the foundry business (specifically 18A node orders from named customers including Apple and Microsoft for specific reference customers), continued strong Xeon server-CPU demand, and meaningful progress in Intel Foundry Services (IFS) revenue disclosure for the first time. INTC closed after-hours up approximately 6%; U.S. pre-market indicates the stock +8%. The specific implication: Intel is not a hyperscaler-capex play; it is a specific-story name that has meaningfully diverged from the Second Derivative narrative. The stock was already up 163% YTD before Thursday's print.
Verizon reports Q2 at 7:00 AM ET with a webcast at 8:30 AM. Consensus: EPS $1.27, revenue $35.11B. Post-paid phone net additions is the specific watchpoint — Q1 produced only 55K net adds versus a low bar of 218K a year ago. If Q2 accelerates to 150K+ and churn holds near 0.97%, the specific defensive-rotation attractiveness of VZ (with its 6.5% dividend yield) is confirmed. If Q2 disappoints, the specific defensive story cracks and the entire defensive-rotation-into-telcos narrative comes into question. Durable Goods Orders also print at 8:30 AM (consensus +0.6%).
The macro-cross-currents remain live. Yesterday's Brent surge to $94.07 moderated modestly overnight to $92.50 as Iran-related headlines quieted, but WTI remains at $89.80 and the specific structural-tightness concern from the U.S. inventory build (2.6M barrels) plus 'limited emergency reserves' commentary persists. 10-year yield held at 4.63% (two-month peak) but did not extend further. Fed-funds futures held Wednesday's repricing: September hike odds at 68% (up from 55% Tuesday); December 62% (up from 50%). Bitcoin recovered modestly to $63,205 overnight.
Pre-open Friday futures indicate a modest bounce attempt: S&P 500 futures +0.3%, Nasdaq 100 futures +0.5%, Dow futures +0.2%. Intel +8% pre-market provides a specific single-name counter-story for the semi complex. Alphabet indicated +0.5% pre-market on modest bargain-hunting; Tesla indicated flat. The specific character of Friday's setup: the bounce attempt is genuinely tactical, not a regime change. The Second Derivative framework remains fully in force through Meta's July 29 print, and today's session is best characterized as consolidation of Thursday's damage. Today's Sector Spotlight walks through the specific Thursday damage, the Intel counter-story, and the Meta pre-print positioning framework.
2. MARKETS AT A GLANCE
U.S. EQUITY FUTURES (PRE-OPEN — MODEST BOUNCE ON INTEL + OVERSOLD CONDITIONS)
Asset
Last
Change
% Chg
S&P 500 (ES)
7,430
+22
+0.30%
Nasdaq 100 (NQ)
25,265
+126
+0.50%
Dow (YM)
51,815
+103
+0.20%
Russell 2000 (RTY)
2,376
+12
+0.51%
THURSDAY JULY 23 CLOSE — AI COMPLEX CARNAGE
Asset
Last
Change
% Chg
S&P 500
7,408.30
-90.66
-1.21%
Nasdaq Composite
25,137.69
-553.21
-2.15%
Dow Jones Industrial Avg.
51,711.65
-506.93
-0.97%
Russell 2000
2,364
-39
-1.62%
VIX (cash)
17.85
+2.80
+18.6%
RATES & FX — 10Y HELD AT 4.63% PEAK
Asset
Last
Change
% Chg
UST 2-Year
4.08%
+1 bp Thu
—
UST 10-Year
4.63%
flat Thu
—
UST 30-Year
5.11%
+1 bp
—
DXY (Dollar Index)
100.05
-0.05
-0.05%
EUR/USD
1.0712
+0.0004
+0.04%
USD/JPY
158.55
-0.10
-0.06%
COMMODITIES & CRYPTO — BRENT MODERATED OVERNIGHT TO $92.50
Asset
Last
Change
% Chg
WTI Crude (Aug)
$89.80
-$1.40 O/N
-1.53%
Brent Crude (Aug)
$92.50
-$1.57 O/N
-1.67%
Gold (spot)
$2,175
-$7 Thu
-0.32%
Silver (spot)
$22.30
-$0.10
-0.45%
Bitcoin
$63,205
+$385 O/N
+0.61%
ASIA & EUROPE (INTRADAY) — MIXED ON U.S. SELLOFF + INTEL COUNTER-STORY
Asset
Last
Change
% Chg
Nikkei 225
39,100
-290
-0.74%
Hang Seng
22,020
-160
-0.72%
Shanghai Composite
3,225
-10
-0.31%
Stoxx Europe 600
568.20
-1.60
-0.28%
FTSE 100
8,875
+10
+0.11%
DAX
20,390
-25
-0.12%
3. TOP STORIES
Tesla -14% + Alphabet -7% = ~$350B in Market Cap Lost
Thursday's cash session delivered the specific compounding damage that Wednesday's AH prints previewed. Tesla closed down approximately 14% — the worst single-session decline in six months. Alphabet closed down 7% as the market fully absorbed the $205B capex raise implications. Combined, the two names lost roughly $350 billion in market capitalization on the day. The specific pattern that developed: initial pre-open weakness concentrated in the two specific print names, then broadened across the AI-cluster as the day progressed. By mid-afternoon, Nvidia was -3.5%, Broadcom -2.8%, AMD -2.5%, Microsoft -2.1%, Amazon -3.2%, Meta -2.6%. SMH ETF -3.8%. The specific character: this was not a rotation, it was concentrated AI-cluster selling with no rotation destination emerging. Defensive names participated: XLV -0.4%, staples flat, UNH +0.3%. Energy names bid on the Brent tape: XOM +2.1%, CVX +1.8%, FANG +2.5%.
Intel reported Q2 after the close with a blowout beat that stands as the specific counter-story to the day's AI-cluster damage. Adjusted EPS $0.42 versus $0.21 expected — a 100% beat, double consensus. Revenue $16.1B versus $14.42B expected — 12% upside. The specific data point: 25% revenue growth was the fastest for any period in almost 15 years. Q3 guide: EPS $0.38 on revenue $15.8-16.8B (both above consensus). Management specifically confirmed 18A node orders from Apple and Microsoft as named customers (the first time Intel has publicly disclosed these specific partnerships); continued strong Xeon server-CPU demand; and provided the first specific Intel Foundry Services (IFS) revenue disclosure. INTC closed AH +6%, pre-market indicates +8%. The specific implication: Intel has meaningfully diverged from the Second Derivative narrative and is now a specific-story name rather than a semi-complex beta play. Bull case: the foundry story + Apple/Microsoft partnerships provide multi-year growth catalysts independent of hyperscaler capex.
Verizon Reports 7 AM — Defensive Rotation Broadening Test
Verizon reports Q2 at 7:00 AM ET this morning with a webcast at 8:30 AM. Consensus: EPS $1.27 (up from $1.22 year-ago), revenue $35.11B. The specific watchpoint: post-paid phone net additions. Q1 produced only 55K net adds versus low-bar expectations. If Q2 accelerates to 150K+ and total phone churn holds near 0.97%, the defensive-rotation attractiveness of VZ (with its 6.5% dividend yield) is confirmed. If Q2 disappoints, the specific defensive story cracks. Second watchpoint: fixed-wireless-access growth (Q1 was 339K; watch for continued 350K+ range). Third: capex guide (Q1 pace implied $17-18B annual; a raise would be negative, a hold neutral, a cut would be a specific bullish signal). Options market pricing a modest ~3% post-earnings swing.
Durable Goods Orders 8:30 AM — Consensus +0.6%
June Durable Goods Orders prints at 8:30 AM ET. Consensus: +0.6% m/m on the headline; +0.3% on ex-transportation; +0.4% on core capital goods orders (ex-defense, ex-aircraft — the specific business-investment proxy). The specific watchpoint given the Alphabet capex disclosure: any acceleration in core capital goods orders would confirm the AI-capex spending is showing up in the specific macro data, which under Second Derivative reading is bearish for the broader tape. A miss would ease the fiscal-adjacent inflation concern.
Overnight, Iran-related headlines quieted materially. Reports of back-channel diplomatic contacts through Qatar produced modest oil-tape moderation: Brent backed off to $92.50 from Thursday's $94.07 close (-1.67% overnight); WTI to $89.80 from $91.20 (-1.53%). The tail risk of Strait-of-Hormuz-closure has moderated modestly but the war-risk insurance rate held at 0.90%. If the diplomatic contacts produce a specific de-escalation announcement over the weekend, oil could give back another 3-5% on Monday; if the contacts stall or the situation re-escalates, Brent likely tests $95-100.
4. MACRO & FED WATCH
Yesterday's weekly jobless claims came in at 228K (consensus 230K, essentially in-line). No specific labor-market surprise; the yield spike held rather than extending. Fed-funds futures held Wednesday's repricing: July hike odds 5% (July 30-31 hold at 78%); September hike odds 68% (from 55% Tuesday); December 62% (from 50%). Today: Durable Goods at 8:30 AM. Next week's data cluster defines September: FOMC Wed 7/30-31, Q2 GDP + Core PCE Thu 7/31, July NFP Fri 8/1. The specific swing factor for September is the July CPI print (August 12) — if Brent stays above $85 through the July CPI data window, the energy contribution meaningfully raises the September hike odds. Meta's Wednesday print is the specific tape-defining catalyst; the FOMC decision that afternoon is secondary given the hold is already 78% priced.
5. ECONOMIC CALENDAR
Day
Time (ET)
Release
Consensus / Actual
Wed 7/22
AH
Alphabet Q2 (released)
BEAT / -7% Thu cash on capex
Wed 7/22
AH
Tesla Q2 (released)
REV beat/EPS miss / -14% Thu
Thu 7/23
8:30 AM
Jobless claims (released)
228K vs 230K est
Thu 7/23
AH
Intel Q2 (released)
BLOWOUT: EPS 2x consensus
Fri 7/24
7:00 AM
Verizon (VZ) Q2
EPS $1.27 / postpaid net adds
Fri 7/24
8:30 AM
Durable Goods
+0.6% headline
Mon 7/28
AM
Coca-Cola (KO) Q2
Consumer staples read
Tue 7/29
AM
P&G (PG) Q2
Staples read
Wed 7/29
AM
Meta Q2
CRITICAL: capex commentary
Wed 7/30-31
2:00 PM
FOMC decision
78% hold; dovish tone at risk
Thu 7/31
8:30 AM
Q2 advance GDP
+2.4% annualized
Thu 7/31
8:30 AM
June Core PCE
Fed preferred inflation
Fri 8/1
8:30 AM
July NFP
Employment tape
Tue 8/11
10 AM
July Existing Home Sales
Housing follow-up
Wed 8/12
8:30 AM
July CPI
CRITICAL — Sept FOMC swing
6. EARNINGS WATCH
Today: Verizon Q2 pre-open at 7 AM. Next week: Coca-Cola Monday, P&G Tuesday, Meta Wednesday (CRITICAL), FOMC Wednesday-Thursday, GDP + PCE Thursday, NFP Friday. Nvidia Q2 in early August remains the specifically-most-decisive semi-complex print — after Wednesday's GOOGL/TSLA/Intel triple, the market has visibility into the hyperscaler spending trajectory and Intel's specific-story divergence. Nvidia will either confirm or refute the reflexive-flip framework in its most structural test.
7. SECTOR SPOTLIGHT: THURSDAY CARNAGE, INTEL COUNTER-STORY, META PRE-PRINT
Today's spotlight covers the specific magnitude of Thursday's damage, the Intel counter-story that provides the specific tactical exception to the Second Derivative framework, and the pre-print positioning framework for Meta's Wednesday July 29 report — now the specific regime-defining event of the next two weeks.
The specific pattern that defines Thursday's session is that the selloff concentrated in AI-adjacent names without producing a rotation destination. In a normal risk-off session, one would expect defensive names to catch meaningful bids as capital rotates from AI to safety. Yesterday, healthcare was essentially flat (XLV -0.4%), staples flat, banks -0.5%. Only energy caught a specific bid (XOM +2.1%, CVX +1.8%, FANG +2.5%) — driven by the Brent tape rather than rotation flow. The specific implication: this is not a rotation regime; this is a deleveraging regime specifically concentrated in AI-cluster names. The compounding pattern the Second Derivative framework anticipated is now fully in force: capex signals trigger the initial print reaction, the reaction cascades into the broader complex, and the broader complex sells into a vacuum without meaningful defensive-rotation offset.
Part II — Intel Is the Specific Tactical Exception
Fig. 2 — Intel Q2 blowout: EPS $0.42 vs $0.21 (2x consensus), revenue $16.1B vs $14.42B (+12%), 25% revenue growth fastest in 15 years.
Intel is the specific-name exception to the Second Derivative framework because Intel is not a hyperscaler-capex-derivative — Intel is a hyperscaler-capex-recipient. When Alphabet raises 2026 capex to $205B, some meaningful portion of that spending flows through to Intel's server-CPU business, its Foundry Services business (specifically the 18A node for Apple and Microsoft), and its High-NA EUV production ramp with ASML. The specific structural framework: Intel benefits from the same capex acceleration that the Second Derivative framework identifies as the leverage risk for hyperscalers. This creates a specific idiosyncratic opportunity — Intel offers exposure to the AI-capex cycle without the hyperscaler-CFO-discipline risk.
WHY INTEL BENEFITS FROM THE SPECIFIC DYNAMIC THAT HURTS ALPHABET
Groundbreaker's Second Derivative framework identifies the specific risk in hyperscaler capex spending: hyperscalers are borrowing (or issuing free-cash-flow-negative equity dilution equivalents) to fund the specific capital commitments to AI infrastructure. The market's framework shift from 'capex = confidence' to 'capex = leverage' is the reflexive-flip catalyst. But for suppliers who are on the receiving end of that spending, the same framework produces the OPPOSITE dynamic. Intel is a specific case study. Intel is not deploying capital into speculative AI infrastructure — Intel is selling chips (Xeon), fab capacity (18A), and manufacturing services (IFS) to companies that are deploying capital. Intel's revenue growth is the direct empirical measurement of the hyperscaler capex spending. The 25% revenue growth (fastest in 15 years) is the specific data point that hyperscaler spending is not just budgeted but actually being executed. This creates a specific paradox for portfolio construction: the reflexive-flip framework says short GOOGL, but the same framework says long INTC on the same specific data.
Part III — Meta Pre-Print Positioning Framework
Fig. 3 — Meta's 2026 capex guide currently $70B. Wednesday July 29 print will confirm or challenge the Second Derivative regime.
Meta's Q2 print on Wednesday July 29 is now the specific tape-defining event of the next two weeks. The specific setup: Meta's Q1 capex guide was $70B for full-year 2026 (versus 2025's $46B — already a substantial raise on the year). The four possible outcomes: Cut (unlikely, ~10% probability) — Meta announces 2026 capex reduced to $60-65B on post-Moonshot-Kimi efficiency; this flips the framework and rallies the AI complex meaningfully. Hold (~30% probability) — Meta maintains $70B guide; neutral for framework; tape trades on other specifics. Modest raise (~45% probability) — Meta raises to $75-80B; the reflexive-flip continues but at moderate magnitude. Substantial raise (~15% probability) — Meta raises to $85B+; the reflexive-flip becomes structurally severe and the AI complex faces the specific 15-25% additional repricing we identified yesterday. The options market is pricing a ~7% post-earnings move — meaningful but not extreme.
THE UPDATED POSITIONING FRAMEWORK — POST-THURSDAY-CARNAGE
Yesterday morning's framework held with specific execution: cash raised to 16%, GOOGL and Tesla reduced, energy added on the Brent breakout. The Thursday cash-session damage produced meaningful additional opportunity in specific names. Today's framework updates: ADD Intel on any pre-open weakness below the +8% pre-market gap — Intel is a specific-story name that has meaningfully diverged from the reflexive-flip framework. ADD modestly to healthcare (UNH, MRK, LLY) on the specific defensive-rotation setup — after Thursday, the tape has confirmed there is no rotation destination YET, but the setup for defensive rotation into next week's macro data is specifically attractive. HOLD off on additional GOOGL reductions — the -7% cash session has meaningfully priced the capex-raise signal. HOLD TSLA reductions in place — the physical-AI narrative degradation is specifically structural rather than cyclical. MAINTAIN housing-ecosystem, staples, AI-power, defense, banks. REDUCE exposure to customer-concentrated semi names (Arm, MU) ahead of Meta. Cash reduced modestly to 14% from 16% — the Intel opportunity and modest healthcare add justify a small deployment. Meta July 29 is the specific catalyst that either extends the regime or arrests it.
8. ANALYST CALLS DRIVING ACTION
Upgrades / target hikes: Wells Fargo raised Intel to $85 post-print. JPMorgan raised INTC to $80. Goldman raised INTC to $82. Bernstein raised CEG to $345. Morgan Stanley raised UNH to $710.
Downgrades / target cuts: Morgan Stanley cut TSLA further to $260 post-print. Wells Fargo cut TSLA to $245. Barclays cut GOOGL to $205. BofA cut GOOGL to $200. JPMorgan cut Meta to $555 pre-print. Wedbush maintained MU at $1,300.
SYM / CGNX / TER — Physical-AI without margin-collapse.
JPM / MS / BLK — Bank complex core long.
DHI / LEN / TOL / KBH — Homebuilders under yields pressure.
HD / LOW / SHW / MAS — Home improvement + building products.
LMT / RTX / NOC / GD — Defense.
XOM / CVX / FANG / EOG — Oil bid; +1-2.5% Thu.
DAL / UAL / AAL — Airlines hit on jet-fuel.
XLE / USO — Energy sector.
Bitcoin — $63,205 (recovered).
VIX cash — 17.85 (+18.6% Thu). Vol regime shift.
TLT — Under pressure on 10Y at 4.63%.
10. GLOBAL MACRO SNAPSHOT
Asia: Weak on U.S. selloff. Nikkei -0.74%, Hang Seng -0.72%, Shanghai -0.31%. Chip complex broadly under pressure but Samsung +0.5% and Tokyo Electron +1.2% on Intel-read-through positive.
Europe: Mixed. Stoxx 600 -0.28%. ASML in Amsterdam quieter. European defense continues to trade firm on Iran tape.
Emerging markets: Mixed. India firm. Korea, Taiwan under semi pressure but Intel counter-story providing modest support. MENA oil-exporters bid despite Brent moderation.
11. WEEK AHEAD PREVIEW
Today: Verizon Q2 pre-open; Durable Goods.
Mon 7/28: Coca-Cola.
Tue 7/29: P&G.
Wed 7/29 (AM): Meta Q2 — CRITICAL capex watchpoint.
Wed 7/30-31: FOMC (78% hold priced, dovish tone at risk).
Thu 7/31: Q2 advance GDP; Core PCE.
Fri 8/1: July NFP.
Wed 8/12: July CPI — CRITICAL for Sept FOMC.
Early August: Nvidia Q2.
12. THE CLOSING THOUGHT
Thursday delivered the specific compounding damage that Wednesday's AH prints previewed. Tesla -14% (~$200B in market cap), Alphabet -7%, combined ~$350B lost on the day. Nasdaq -2.15% in its worst session in over a month; SMH -3.8%; broader AI-cluster all down 2-3%. The pattern confirms: this is a deleveraging regime specifically concentrated in AI-cluster names with no rotation destination emerging yet. Intel's after-close blowout (EPS 2x consensus, +25% revenue growth fastest in 15 years) provided the specific tactical exception — Intel is a hyperscaler-capex-recipient rather than a hyperscaler-capex-derivative and benefits from the same dynamic that hurts GOOGL. Verizon reports at 7 AM (postpaid net adds is the defensive-rotation-broadening test). Iran-related headlines moderated overnight; Brent to $92.50 from $94.07; 10Y held at 4.63%. Fed-funds futures held Wed repricing (September 68%). Positioning: add Intel on any pre-open weakness; modest healthcare add; hold GOOGL/TSLA reductions; maintain housing/staples/AI-power/defense/banks; reduce Arm/MU pre-Meta; cash 14% (from 16%). Meta Wednesday July 29 remains the specific regime-defining event — a Meta capex cut flips the framework and rallies the AI complex; a Meta capex raise completes the reflexive-flip and drives the specific 15-25% additional AI-cluster repricing. Have a good weekend. Trade carefully.
THE BROOKSIDE BRIEF · COMPILED 9:30 AM ET · SOURCES: CNBC / STL.NEWS / YAHOO FINANCE (JULY 23 CLOSE), INTEL Q2 2026 EARNINGS RELEASE (BLOWOUT BEAT), VERIZON Q2 PREVIEW (7 AM RELEASE), ALPHABET Q2 (RELEASED WED AH), TESLA Q2 (RELEASED WED AH), ICE BRENT AUG FUTURES ($92.50), TREASURY H.15 (10Y 4.63%), CME FEDWATCH, CBOE (VIX 17.85), FORTUNE / YAHOO (BITCOIN $63,205), GROUNDBREAKER 'THE SECOND DERIVATIVE' (JULY 2), CITRINI RESEARCH, ASCHENBRENNER
MORNING EDITION · MONDAY, JULY 27, 2026 · U.S.-IRAN CEASEFIRE · BRENT -4.4% TO $87.64 · DOW FUTS +556 · FOMC + META WEDNESDAY
Daily Markets Briefing
The Brookside Brief
Markets · Macro · The Day Ahead
EDITOR'S NOTE — THREE MATERIAL CORRECTIONS
Today's brief carries three corrections, one of them substantial. FIRST AND MOST IMPORTANT: we have been reporting Meta's 2026 capex guide as $70 billion. The actual guide is $125-145 billion — nearly double what we reported, with Q2-Q4 implied average capex of $38.39B per quarter (94% above Q1). This matters because we built a substantial part of last week's Second Derivative analysis on the premise that Meta might be the disciplined-CFO holdout; at $125-145B, Meta has ALREADY made the aggressive capex commitment, and the specific question Wednesday is whether they raise further or hold. Fig. 1 presents the corrected series. SECOND: we repeatedly listed the FOMC decision as 'July 30-31.' The actual meeting is July 28-29, with the decision at 2:00 PM ET Wednesday July 29 and Powell's press conference at 2:30 PM. No Summary of Economic Projections at this meeting (no dot plot). THIRD: we listed Meta as reporting Wednesday morning; Meta actually reports after the close, with the call at 4:30 PM ET. The practical consequence of corrections two and three: the FOMC decision and Meta's capex guide land within two and a half hours of each other on Wednesday. We regret the errors and are rebuilding the calendar-verification step against primary sources.
1. THE MORNING SETUP
Good morning. The dominant weekend development is geopolitical and it is constructive: the United States has suspended its 13-night airstrike campaign against Iran to create space for diplomatic negotiations, and a senior Iranian official has confirmed Tehran will halt retaliatory strikes under an 'attack for attack' framework for as long as the U.S. pause holds. This is the first genuine de-escalation since the conflict re-ignited in mid-July. The market response has been immediate and large. Oil is collapsing: Brent -4.41% to $87.64; WTI -4.93% to $84.91. Equity futures are strongly bid: Dow futures +556 points (+1.1%), S&P 500 futures +0.9%, Nasdaq 100 futures +1.4%.
The sector rotation on the ceasefire is clean and specific. Airlines are the single largest beneficiaries given jet-fuel cost relief: Delta +2.6%, American +3.0% pre-market. Cruise operators follow: Royal Caribbean +3.2%, Carnival +3.2%. Consumer-discretionary broadly bid. On the other side, energy names give back the geopolitical premium: Chevron -2.5%, ExxonMobil -2.5%, ConocoPhillips -3.2% pre-market. This is the specific unwind of the trade we added on Thursday — we added energy on the Brent breakout at $94 and that position is now giving back roughly 2.5% on the ceasefire. The specific lesson: geopolitical-premium trades are tactical, not structural, and require specific exit discipline.
Friday's cash session closed a volatile week with a mixed tape: S&P 500 +0.05% to 7,411.98; Nasdaq Composite -0.64% to 24,975.82; Dow +235.60 (+0.46%) to 51,947.25. All three indexes finished the week lower — the S&P roughly -1.3% on the week, the Nasdaq roughly -2.2%. The specific characteristic of Friday: the Dow's recovery came on the defensive-and-industrial complex (UNH, MRK, CAT, HON all bid) while the Nasdaq stayed under pressure from continued semi-complex selling. Intel closed Friday up approximately 6.5% on the blowout print, providing the specific counter-story we flagged.
Verizon delivered a clean beat Friday morning: EPS $1.30 versus $1.27 consensus (+2.36%). Revenue came in near the $35.1B consensus. Post-paid phone net additions accelerated meaningfully from Q1's 55K — the specific defensive-rotation-broadening test we flagged came back positive. The stock added roughly 2% on the session, confirming that the defensive rotation extends beyond healthcare into telco.
This week is the most consequential of the quarter, and the schedule has one specific feature we need to flag clearly: Wednesday July 29 concentrates the FOMC decision (2:00 PM ET) and Meta's Q2 earnings call (4:30 PM ET) within two and a half hours of each other. Both are regime-defining. The FOMC decision is roughly 85% priced as a hold, so the market reaction will hinge on statement language regarding energy-driven inflation and September guidance from Powell's 2:30 PM press conference. Meta's capex guide — already at an enormous $125-145B — will either be raised (extending the reflexive-flip regime) or held/moderated (arresting it). Today's Sector Spotlight walks through the corrected Meta framework, the oil unwind, and the Wednesday double-header positioning setup.
2. MARKETS AT A GLANCE
U.S. EQUITY FUTURES (PRE-OPEN — STRONG BID ON CEASEFIRE)
Asset
Last
Change
% Chg
Dow (YM)
52,505
+556
+1.10%
S&P 500 (ES)
7,478
+66
+0.90%
Nasdaq 100 (NQ)
25,325
+350
+1.40%
Russell 2000 (RTY)
2,406
+31
+1.31%
FRIDAY JULY 24 CLOSE — VOLATILE WEEK ENDED MIXED; ALL THREE LOWER ON WEEK
Asset
Last
Change
% Chg
S&P 500
7,411.98
+3.68
+0.05%
Nasdaq Composite
24,975.82
-161.87
-0.64%
Dow Jones Industrial Avg.
51,947.25
+235.60
+0.46%
Russell 2000
2,375
+11
+0.47%
VIX (cash)
16.90
-0.95
-5.3%
RATES & FX — YIELDS EASING ON OIL COLLAPSE
Asset
Last
Change
% Chg
UST 2-Year
4.02%
-6 bps
—
UST 10-Year
4.54%
-9 bps
—
UST 30-Year
5.02%
-9 bps
—
DXY (Dollar Index)
99.85
-0.20
-0.20%
EUR/USD
1.0735
+0.0023
+0.21%
USD/JPY
158.10
-0.45
-0.28%
COMMODITIES & CRYPTO — OIL COLLAPSING ON CEASEFIRE
Asset
Last
Change
% Chg
WTI Crude (Sep)
$84.91
-$4.40
-4.93%
Brent Crude (Sep)
$87.64
-$4.06
-4.41%
Gold (spot)
$2,152
-$23
-1.06%
Silver (spot)
$22.05
-$0.25
-1.12%
Bitcoin
$64,850
+$1,645
+2.60%
ASIA & EUROPE (INTRADAY) — BROADLY BID ON CEASEFIRE
Asset
Last
Change
% Chg
Nikkei 225
39,720
+620
+1.59%
Hang Seng
22,405
+385
+1.75%
Shanghai Composite
3,258
+33
+1.02%
Stoxx Europe 600
574.60
+6.40
+1.13%
FTSE 100
8,935
+60
+0.68%
DAX
20,635
+245
+1.20%
3. TOP STORIES
U.S. and Iran Pause Hostilities — Oil Collapses, Risk Assets Rally
The United States has suspended its 13-night airstrike campaign against Iran to create diplomatic space, and a senior Iranian official has confirmed that Tehran will halt retaliatory strikes under an 'attack for attack' framework for as long as the U.S. pause holds. This is the first genuine de-escalation since the conflict re-ignited in mid-July. The specific market consequences: Brent -4.41% to $87.64; WTI -4.93% to $84.91 (both down roughly 7% from Wednesday's peak). Equity futures strongly bid: Dow +556 points, S&P +0.9%, Nasdaq +1.4%. Treasury yields easing meaningfully — 10-year down 9 basis points to 4.54% from Friday's 4.63%, reversing a meaningful portion of last week's energy-inflation-driven spike. Bitcoin +2.60% to $64,850 on the risk-on tape. The specific caution: this is a PAUSE, not a settlement. The 'attack for attack' framework is explicitly conditional and either side can resume within hours. War-risk insurance on Hormuz-transiting vessels has eased to roughly 0.72% from 0.90% but remains well above the 0.35% pre-conflict baseline.
Meta Capex Guide Is $125-145B — Correcting Our Reporting
We have been reporting Meta's 2026 capex guide as $70 billion across several briefs. The actual guide is $125-145 billion, with Q2-Q4 implied average capex of $38.39B per quarter — 94% above the Q1 run-rate. This is a material correction because it changes the specific framing of Wednesday's print. Our prior framing was that Meta might be the disciplined-CFO holdout that arrests the reflexive-flip regime. At $125-145B, Meta has ALREADY made the aggressive commitment — the company is spending at a scale comparable to Alphabet's $205B on a substantially smaller revenue base. The specific question Wednesday is therefore not 'will Meta be disciplined' but 'will Meta raise further from an already-extreme base, or hold.' Consensus expects roughly $60B in Q2 revenue and EPS around $7.23. Analysts are watching decelerating ad-revenue growth, the capex guide, and commentary on the cloud push and the Muse Spark 1.1 AI model.
Verizon Beats — Defensive Rotation Broadens Into Telco
Verizon reported Q2 Friday morning with a clean beat: EPS $1.30 versus $1.27 consensus (+2.36%); revenue near the $35.1B consensus. The specific watchpoint we flagged — post-paid phone net additions — accelerated meaningfully from Q1's 55K, confirming that better retention is translating into faster subscriber growth. Total phone churn held near the 0.97% target. Fixed-wireless-access growth remained in the 340K+ range. Capex guidance held at the $17-18B annual pace (neither a raise nor a cut). The stock added roughly 2% on the session. The specific implication: the defensive-rotation trade extends beyond healthcare into telco, and VZ's 6.4% dividend yield is now backed by a specifically-improving subscriber trajectory.
Intel Closed +6.5% Friday on Blowout Print
Intel closed Friday up approximately 6.5% following Thursday's after-close blowout — adjusted EPS $0.42 versus $0.21 expected (2x consensus), revenue $16.1B versus $14.42B expected, and 25% revenue growth (fastest in nearly 15 years). The specific narrative that carried through Friday's session: Intel is a hyperscaler-capex-RECIPIENT rather than a hyperscaler-capex-derivative, and therefore benefits from the same spending acceleration that is punishing Alphabet and the broader hyperscaler complex. Sell-side targets moved: Wells Fargo $85, Goldman $82, JPMorgan $80. The stock is now up roughly 175% YTD.
Week Ahead: The Most Consequential Five Sessions of the Quarter
This week concentrates the quarter's decisive events. Today: Coca-Cola reports pre-open. Tuesday: P&G, plus the FOMC meeting begins. Wednesday: FOMC decision 2:00 PM ET, Powell press conference 2:30 PM, Meta Q2 call 4:30 PM. Thursday: Q2 advance GDP and June Core PCE, both 8:30 AM. Friday: July nonfarm payrolls 8:30 AM. Each of these can independently move the tape 2%+; the concentration into Wednesday specifically is the highest single-day event risk of the quarter.
4. MACRO & FED WATCH
The oil collapse has meaningfully eased the hawkish repricing that dominated late last week. With Brent back to $87.64 from Wednesday's $94.07 peak, the specific energy-inflation contribution to the July CPI print (August 12) is materially lower than Thursday's tape implied. Fed-funds futures have repriced back: July 29 hold now roughly 85% (up from 78% Thursday); September hike odds back to 58% (down from 68% Thursday); December 55% (down from 62%). The 10-year yield has retraced 9 basis points to 4.54%.
Wednesday's FOMC decision is roughly 85% priced as a hold, so the market reaction will hinge entirely on two things: the statement's characterization of energy-driven inflation risk, and Powell's September guidance in the 2:30 PM press conference. Note that this meeting does NOT include a Summary of Economic Projections — there is no dot plot, which removes one specific channel through which the Committee could signal September intentions and places correspondingly more weight on Powell's language. Thursday's Q2 advance GDP (consensus +2.4% annualized) and June Core PCE, then Friday's July NFP, complete the data picture the Committee will carry into September.
5. ECONOMIC CALENDAR — CORRECTED
Day
Time (ET)
Release
Consensus / Watchpoint
Fri 7/24
Pre-open
Verizon Q2 (released)
BEAT: EPS $1.30 vs $1.27 ✓
Mon 7/27
Pre-open
Coca-Cola (KO) Q2
Consumer staples read
Tue 7/28
AM
P&G (PG) Q2
Staples read
Tue 7/28
—
FOMC meeting begins
Two-day meeting
Wed 7/29
2:00 PM
FOMC DECISION
Hold ~85% priced; NO dot plot
Wed 7/29
2:30 PM
Powell press conference
September guidance language
Wed 7/29
4:30 PM
META Q2 CALL
$125-145B capex guide — CRITICAL
Thu 7/30
8:30 AM
Q2 advance GDP
+2.4% annualized
Thu 7/30
8:30 AM
June Core PCE
Fed's preferred inflation gauge
Thu 7/30
8:30 AM
Weekly jobless claims
230K
Fri 7/31
8:30 AM
July NFP
Employment tape
Tue 8/11
10:00 AM
July Existing Home Sales
Housing follow-up
Wed 8/12
8:30 AM
July CPI
CRITICAL — Sept FOMC swing
Late Aug
AH
Nvidia Q2
Most decisive AI-complex print
6. EARNINGS WATCH
Today: Coca-Cola pre-open. Tuesday: P&G. Wednesday: Meta after close at 4:30 PM ET — the single most consequential print of the quarter for the AI complex, landing two and a half hours after the FOMC decision. Thursday and Friday are macro-dominated (GDP, PCE, NFP). Nvidia's Q2 in late August remains the most decisive AI-complex print of the cycle — after Alphabet's $205B and Meta's $125-145B, the market will have full visibility into hyperscaler spending and Nvidia's guide becomes the specific test of whether that spending converts to sustained revenue.
7. SECTOR SPOTLIGHT: CORRECTED META FRAMEWORK, OIL UNWIND, WEDNESDAY DOUBLE-HEADER
Today's spotlight has three parts: the corrected Meta capex framework and what it changes about our Second Derivative analysis, the specific unwind mechanics of the geopolitical-premium trade, and the positioning framework for Wednesday's FOMC-plus-Meta double-header. Three charts.
Part I — The Corrected Meta Framework
Fig. 1 — CORRECTED: Meta's 2026 capex guide is $125-145B, not the $70B we reported. Nearly 3x the 2025 actual of $46B.
The correction materially changes the framing. Our prior analysis positioned Meta as the potential disciplined-CFO holdout — the hyperscaler that might cut or hold capex and thereby arrest the reflexive-flip regime. At $125-145B, that framing was wrong. Meta has already made the aggressive commitment. To put the number in context: Meta's 2026 capex guide is roughly 2.7x the 2025 actual of $46B, and represents approximately 75-85% of Meta's expected 2026 revenue. Alphabet's $205B, by comparison, is roughly 40% of expected revenue. On a revenue-intensity basis, Meta is spending substantially more aggressively than Alphabet.
This reframes Wednesday's specific question. It is no longer 'will Meta provide the CFO-discipline signal.' It is: from an already-extreme base, does Meta raise further, hold, or moderate? The four outcomes and our rough probability weights: Raise above $145B (~25%) — extends the reflexive-flip; expect META -5 to -8% and AI-complex contagion. Hold at $125-145B (~45%) — neutral-to-modestly-positive; the market has priced considerable capex anxiety and simply not raising may be received as discipline. Narrow the range upward within the guide (~20%) — mildly negative. Moderate below $125B (~10%) — would be the specific framework-arresting event; expect META +6-10% and a broad AI-complex relief rally.
WHAT WE GOT WRONG AND WHY IT MATTERS
We built several days of analysis on a $70B Meta capex figure that was roughly half the actual $125-145B guide. The specific error compounded: it led us to characterize Meta as a potential 'last line of defense' for hyperscaler capital discipline, when in fact Meta was already among the most aggressive spenders in the complex on a revenue-intensity basis. Readers who positioned on that framing were positioned on a materially wrong premise. The underlying Second Derivative thesis — that the market's evaluative framework has shifted from 'capex equals confidence' to 'capex equals leverage' — remains well-supported by the TSMC, ASML, and Alphabet tape reactions. But the specific Meta application was built on bad data. The methodological lesson we are implementing: capex figures that anchor a multi-day thesis get verified against the company's own most recent guidance disclosure before publication, not carried forward from prior briefs. We would rather flag an error prominently than let a wrong number propagate quietly.
Part II — The Oil Unwind and the Cost of Tactical Trades
Fig. 2 — Brent collapsed 4.4% to $87.64 pre-open on the ceasefire, roughly 7% off Wednesday's $94.07 peak.
On Thursday we added energy exposure (XOM, CVX, FANG, EOG) on the Brent breakout above $90, characterizing the setup as 'structural not tactical.' That characterization was too strong. The ceasefire has produced an immediate 2.5-3.2% pre-market give-back in exactly those names. The specific lesson is worth stating plainly: geopolitical-premium trades are tactical by construction, because the premium exists only while the conflict is unresolved, and conflicts resolve on political timelines that are not forecastable from market data. The correct framing for Thursday's add would have been a tactical position with a defined exit on any de-escalation headline, not a structural allocation.
The offsetting side of the unwind is clean and worth capturing. Airlines are the largest specific beneficiaries of the jet-fuel relief: Delta +2.6%, American +3.0% pre-market, with United and Southwest similarly bid. Cruise operators follow: Royal Caribbean +3.2%, Carnival +3.2%. Broader consumer-discretionary and transport names bid. For portfolios that carried the energy add through the weekend, the specific action is to trim energy back toward pre-Thursday weight and rotate a portion into the transport-and-travel complex, recognizing that this rotation is itself tactical and reverses if the ceasefire breaks.
Part III — Wednesday's Double-Header
Fig. 3 — Wednesday July 29: FOMC decision 2:00 PM, Powell 2:30 PM, Meta capex guide 4:30 PM. The highest single-day event risk of the quarter.
The concentration of the FOMC decision and Meta's capex guide into a single afternoon creates a specific structural risk: the two events can compound in the same direction. The specific adverse scenario is a hawkish-leaning Powell press conference (energy-inflation caution, non-committal September language) at 2:30 PM followed by a Meta capex raise at 4:30 PM — that combination would produce a sharply negative Thursday open with both the rates channel and the AI-capex channel firing simultaneously. The specific favorable scenario is a dovish-leaning Powell (looking through energy as transitory given the ceasefire) followed by a Meta hold — that combination would produce a broad relief rally.
THE POSITIONING FRAMEWORK INTO WEDNESDAY
The specific approach for a session with two compounding regime-defining events is to reduce gross exposure rather than to attempt directional positioning, because the payoff distribution is genuinely two-sided and the correlation between the two events is unknown. Specific actions for this week: TRIM energy (XOM, CVX, FANG, EOG) back toward pre-Thursday weight — the ceasefire has invalidated the thesis and holding into a possible settlement announcement compounds the loss. ADD modestly to transport and travel (DAL, UAL, LUV, RCL, CCL) as the specific ceasefire beneficiary, sized as a tactical position with a defined exit if hostilities resume. MAINTAIN Intel — the print was genuinely strong and the hyperscaler-capex-recipient framing is structurally sound regardless of Wednesday. MAINTAIN healthcare (UNH, MRK, LLY), staples (PG, KO, COST), and now telco (VZ) — the defensive complex is working and has broadened. MAINTAIN AI-power (CEG, VST, TLN, GEV, ETN, PWR) — capex-independent contracted cash flows insulate these from Wednesday's outcome in either direction. HOLD reduced positions in GOOGL and TSLA. REDUCE customer-concentrated semis (Arm, MU, MRVL) into Wednesday. RAISE cash to 18% from 14% — the specific justification is event-risk concentration, not a directional view. We would rather re-deploy Thursday morning with information than carry maximum exposure into a two-sided event.
8. ANALYST CALLS DRIVING ACTION
Upgrades / target hikes: Wells Fargo raised Intel to $85; Goldman $82; JPMorgan $80. Morgan Stanley raised Verizon to $54 post-beat. Deutsche raised Delta to $78 on the fuel-cost relief. Bernstein raised CEG to $345.
Downgrades / target cuts: Goldman cut Chevron to $170 on the ceasefire unwind. JPMorgan cut ExxonMobil to $138. Morgan Stanley held TSLA at $260. BofA held GOOGL at $200. JPMorgan cut Meta to $555 pre-print.
Asia: Broadly and strongly bid on the ceasefire. Nikkei +1.59%, Hang Seng +1.75%, Shanghai +1.02%. Japanese and Korean airlines and shippers particularly strong on the fuel-cost relief. Oil-importing economies (Japan, Korea, India) the clean beneficiaries.
Europe: Firmly bid. Stoxx 600 +1.13%, DAX +1.20%, FTSE +0.68%. European airlines (Lufthansa, IAG, Ryanair) leading. European defense names (BAE, Rheinmetall, Thales) giving back a portion of the conflict premium.
Emerging markets: Strong across oil importers. India notably firm on the crude relief given its import dependence. MENA oil-exporters under pressure as the premium unwinds. Turkey bid.
The weekend delivered the first genuine de-escalation of the Iran conflict: the U.S. has suspended its 13-night airstrike campaign and Tehran has confirmed it will halt retaliatory strikes under an 'attack for attack' framework. Oil is collapsing — Brent -4.4% to $87.64, WTI -4.9% to $84.91, both roughly 7% off Wednesday's peak. Equity futures strongly bid: Dow +556, S&P +0.9%, Nasdaq +1.4%. Airlines and cruise lines lead; energy gives back the premium. Yields easing, 10-year to 4.54% from 4.63%. Bitcoin +2.6% to $64,850. This is a pause, not a settlement — the framework is explicitly conditional. Today's brief carries three corrections, the most important being that Meta's 2026 capex guide is $125-145B, not the $70B we had been reporting; Meta has already made the aggressive commitment rather than standing as the disciplined holdout we characterized. The FOMC decision is Wednesday July 29 at 2:00 PM (not July 30-31), and Meta reports the same afternoon at 4:30 PM. That two-and-a-half-hour window is the highest single-day event risk of the quarter, with the specific danger that a hawkish Powell and a Meta capex raise compound in the same direction. Positioning: trim energy back toward pre-Thursday weight, add tactically to transport and travel, maintain Intel and the broadened defensive complex, maintain capex-independent AI-power, reduce customer-concentrated semis into Wednesday, and raise cash to 18%. The justification for the cash is event-risk concentration rather than a directional view — we would rather re-deploy Thursday with information than carry maximum exposure into a genuinely two-sided event. Trade carefully.
THE BROOKSIDE BRIEF · COMPILED 9:30 AM ET · SOURCES: CNBC / YAHOO FINANCE / THESTREET / WASHINGTON POST (JULY 24 CLOSE), CNBC / BLOOMBERG / 93.3 THE DRIVE (JULY 27 CEASEFIRE + FUTURES), META Q1 2026 CAPEX GUIDANCE ($125-145B, CORRECTED), FEDERAL RESERVE JULY 2026 CALENDAR (FOMC JULY 28-29), META IR (CALL 4:30 PM ET JULY 29), VERIZON Q2 2026 EARNINGS RELEASE, INTEL Q2 2026 EARNINGS RELEASE, ICE BRENT/WTI FRONT-MONTH, TREASURY H.15 (10Y 4.54%), CME FEDWATCH, CBOE (VIX 16.90), FORTUNE / YAHOO (BITCOIN $64,850), GROUNDBREAKER 'THE SECOND DERIVATIVE' (JULY 2), CITRINI RESEARCH, ASCHENBRENNER
MORNING EDITION · TUESDAY, JULY 28, 2026 · NVDA -5% ON VENDOR FINANCING · KO BEATS AND RAISES · FOMC BEGINS · META TOMORROW
Daily Markets Briefing
The Brookside Brief
Markets · Macro · The Day Ahead
1. THE MORNING SETUP
Good morning. Monday's session split cleanly along the fault line that now defines this tape. The Dow rose 262.83 points (+0.51%) to 52,210.08 and the S&P 500 added 0.02% to 7,413.18, while the Nasdaq Composite fell 0.18% to 24,932.08 — dragged down almost single-handedly by a 5% decline in Nvidia, its largest single-day drop since February. Oil continued to slide on the ceasefire, and the broad market took that as good news. The AI complex did not.
The specific reason for Nvidia's decline is worth stating precisely, because it is a different mechanism from what has driven the selling over the past two weeks. Over the weekend Nvidia announced an AI cooperation agreement with South Korea's SK Group valued at over $500 billion, and reports emerged that the company is in talks to provide roughly a $250 billion financial guarantee for a 10-gigawatt data centre project in Ohio, apparently to help OpenAI lease the facility. Total announced weekend commitments ran past $750 billion. The market's reaction was not to the demand signal but to the balance-sheet structure: Nvidia is increasingly guaranteeing its customers' ability to buy its own product. That is vendor financing, and vendor financing at this scale changes the credit profile of the entire chain. If AI demand comes in below expectation, losses no longer sit only with the buyer.
Coca-Cola provided the counterweight this morning with a clean beat and a raise. Comparable EPS of 97 cents and net sales up 7% to $13.38 billion, both above consensus. The company lifted full-year comparable EPS growth guidance to 9-10% from 8-9%, and now expects organic revenue growth of about 5%, the high end of its prior 4-5% range. Shares rose more than 3% in pre-market. For a defensive-rotation tape this is exactly the confirmation the trade needed — the staples complex is not merely a hiding place, it is delivering.
The Federal Open Market Committee begins its two-day meeting today, with the policy decision at 2:00 PM ET tomorrow and Chair Powell's press conference at 2:30 PM. This meeting is genuinely live in a way the market may be underappreciating: multiple voting members have expressed concern about inflation re-accelerating, and while a hold remains the strong base case, the statement language will carry more weight than usual given there is no Summary of Economic Projections at this meeting. Meta reports tomorrow after the close, with the call at 4:30 PM ET — two and a half hours after Powell steps away from the podium.
Futures are modestly higher this morning, with falling oil supportive but conviction limited by AI-capex concerns and Fed uncertainty. Today's Sector Spotlight steps back from the daily tape to work through two essays from Peter Farac's Macro Is Dead that a reader flagged — one on the oil forecast that went wrong, one on the current correlation regime. Between them they make an argument that is uncomfortable for the thesis this brief has been building all month, and we think it is worth taking seriously rather than filing away.
2. MARKETS AT A GLANCE
U.S. EQUITY FUTURES (PRE-OPEN — MODESTLY HIGHER, CONVICTION LIMITED)
Asset
Last
Change
% Chg
S&P 500 (ES)
7,432
+19
+0.26%
Nasdaq 100 (NQ)
24,985
+53
+0.21%
Dow (YM)
52,320
+110
+0.21%
Russell 2000 (RTY)
2,392
+8
+0.34%
MONDAY JULY 27 CLOSE — DOW UP, NASDAQ DOWN ON NVIDIA
Asset
Last
Change
% Chg
Dow Jones Industrial Avg.
52,210.08
+262.83
+0.51%
S&P 500
7,413.18
+1.20
+0.02%
Nasdaq Composite
24,932.08
-43.74
-0.18%
Nvidia (NVDA)
—
—
-5.0%
VIX (cash)
16.20
-0.70
-4.1%
RATES & FX
Asset
Last
Change
% Chg
UST 2-Year
4.01%
-1 bp
—
UST 10-Year
4.52%
-2 bps
—
UST 30-Year
5.00%
-2 bps
—
DXY (Dollar Index)
99.75
-0.10
-0.10%
EUR/USD
1.0748
+0.0013
+0.12%
USD/JPY
157.90
-0.20
-0.13%
COMMODITIES & CRYPTO — OIL CONTINUING TO UNWIND THE WAR PREMIUM
Asset
Last
Change
% Chg
WTI Crude (Sep)
$83.10
-$1.81
-2.13%
Brent Crude (Sep)
$85.90
-$1.74
-1.99%
Gold (spot)
$2,146
-$6
-0.28%
Silver (spot)
$21.95
-$0.10
-0.45%
Bitcoin
$65,120
+$270
+0.42%
ASIA & EUROPE (INTRADAY)
Asset
Last
Change
% Chg
Nikkei 225
39,820
+100
+0.25%
Hang Seng
22,480
+75
+0.33%
Shanghai Composite
3,262
+4
+0.12%
Stoxx Europe 600
576.10
+1.50
+0.26%
FTSE 100
8,952
+17
+0.19%
DAX
20,690
+55
+0.27%
3. TOP STORIES
Nvidia Falls 5% as Vendor Financing Replaces Demand as the Story
Nvidia fell more than 5% Monday, its largest single-session decline since February, on a weekend of deal announcements totalling more than $750 billion in commitments. The two specific items: an AI cooperation agreement with South Korea's SK Group valued above $500 billion, and reports that Nvidia is in talks to provide approximately a $250 billion financial guarantee supporting a 10-gigawatt data centre project in Ohio, structured to help OpenAI lease the facility. The market's concern is not demand. It is that Nvidia is progressively underwriting its customers' capacity to purchase Nvidia product, which distorts the incentive structure and concentrates chain-wide credit risk on Nvidia's own balance sheet. Should AI demand disappoint, losses propagate rather than stay contained at the buyer. This is a genuinely different concern from the capex-intensity worry that has driven the past fortnight's selling.
Coca-Cola Beats and Raises — Staples Confirm the Rotation
Coca-Cola reported Q2 this morning above consensus on both lines. Comparable EPS of 97 cents; net sales up 7% to $13.38 billion, driven by higher demand across the portfolio. Management raised full-year comparable EPS growth guidance to 9-10% from a prior 8-9%, and now expects organic revenue growth of approximately 5% — the top of the previous 4-5% range. Shares rose more than 3% pre-market. The read-through matters beyond the single name: the defensive rotation we have tracked since mid-month has been characterised by some as a pure hiding-place trade. Coke raising guidance argues the staples complex is compounding on fundamentals, not merely absorbing flows.
FOMC Begins — A Live Meeting With No Dot Plot
The Committee begins its two-day meeting today. The decision lands at 2:00 PM ET tomorrow, with Powell's press conference at 2:30 PM. A hold remains the strong base case, but this is a live meeting: multiple voting members have publicly expressed concern about inflation re-accelerating, and the oil round-trip of the past fortnight has given both camps ammunition. Because this meeting carries no Summary of Economic Projections, there is no dot plot through which the Committee can signal September intentions — which places correspondingly more weight on the statement's characterisation of energy-driven inflation risk and on Powell's language in the Q&A.
China's Q2 GDP Missed the Target — First Time Since Covid
China's Q2 GDP grew 4.3% year-on-year, the weakest pace in more than three years and below the official 4.5-5.0% target band — the first miss since the pandemic. First-half growth was 4.7%. The composition is worse than the headline: fixed-asset investment fell 5.7% in the first half, dragged by an 18% collapse in property investment. Industrial production drew support from technology and export sectors. The National Bureau of Statistics cited external instability and domestic supply-demand imbalances. This matters for the oil tape specifically, and Section 7 works through why.
Oil Continues to Unwind — Brent Below $86
The ceasefire tape held overnight. Brent is down a further 1.99% to $85.90 and WTI down 2.13% to $83.10, extending Monday's slide. Both are now roughly 9% below Wednesday's $94.07 peak. War-risk insurance on Hormuz transits has eased further toward 0.65%. Energy names continue to give back the premium; airlines, cruise operators and transport continue to capture it. The pause remains explicitly conditional and reversible.
4. MACRO & FED WATCH
The oil round-trip has substantially reset the near-term inflation picture. With Brent at $85.90 versus $94.07 last Wednesday, the energy contribution to the July CPI print on August 12 is materially smaller than the mid-week tape implied. Fed-funds futures now price roughly an 85% probability of a hold tomorrow, with September hike odds around 55% and December near 52%.
One nuance worth flagging, and it comes directly from Farac's Week 29 notes: the bond market has been notably less impressed by soft inflation prints than equities have. Even after a negative headline CPI and a soft PPI, the long end did not follow the front end down, and the 2s10s curve steepened. His explanation is that while core goods and housing dragged the CPI lower, refined product markets stayed tight — gasoline and diesel futures kept firming even as crude fell, with US exports elevated, Russian export capacity impaired by strikes on refinery infrastructure, and Chinese output a question mark. If that is right, the long end is tracking a product-market tightness that headline crude prices are not capturing. Worth watching how the 30-year behaves around tomorrow's statement.
5. ECONOMIC CALENDAR
Day
Time (ET)
Release
Consensus / Watchpoint
Mon 7/27
—
Ceasefire tape (held)
Brent -4.4%; NVDA -5%
Tue 7/28
Pre-open
Coca-Cola Q2 (released)
BEAT + RAISED guidance ✓
Tue 7/28
AM
P&G Q2
Staples read
Tue 7/28
—
FOMC meeting begins
Two-day meeting
Wed 7/29
2:00 PM
FOMC DECISION
Hold ~85%; NO dot plot
Wed 7/29
2:30 PM
Powell press conference
September guidance language
Wed 7/29
4:30 PM
META Q2 CALL
$125-145B capex guide — CRITICAL
Thu 7/30
8:30 AM
Q2 advance GDP
+2.4% annualised
Thu 7/30
8:30 AM
June Core PCE
Fed's preferred gauge
Thu 7/30
8:30 AM
Weekly jobless claims
230K
Fri 7/31
8:30 AM
July NFP
Employment tape
Tue 8/11
10:00 AM
July Existing Home Sales
Housing follow-up
Wed 8/12
8:30 AM
July CPI
CRITICAL — Sept FOMC swing
Late Aug
AH
Nvidia Q2
Most decisive AI print
6. EARNINGS WATCH
Today: Coca-Cola released (beat and raised); P&G. Tomorrow is the concentration point — FOMC at 2:00 PM, Powell at 2:30 PM, Meta at 4:30 PM. Thursday and Friday are macro-dominated with GDP, Core PCE and payrolls. Nvidia's Q2 in late August is now carrying more weight than it was a week ago: after Monday's vendor-financing disclosures, the print will be read as much for receivables, guarantee exposure and customer-concentration detail as for revenue.
7. SECTOR SPOTLIGHT: THE DOOM THAT DIDN'T ARRIVE
A reader passed along two essays from Peter Farac's Macro Is Dead — "When forecasting doom goes wrong" (June 26) and the Week 29 notes, "Fearful and rudderless" (July 17). Read together they make an argument that cuts against the thesis this brief has been building all month, which is precisely why we want to work through it properly rather than cherry-pick the parts that flatter us. The subject is the Strait of Hormuz, the mechanism is China, and the lesson is about the limits of forecasting.
Part I — Thirteen Million Barrels and the Crisis That Wasn't
When the Strait closed, the base numbers were genuinely dire. Roughly 13.5 million barrels per day of production lost. Disruption to urea, fertiliser and petrochemical feedstocks. As Farac puts it, there has never been demand destruction large enough in history to offset a disruption of that size. Headlines carried $200-per-barrel forecasts, warnings of super-inflation, and in several cases outright depression calls.
Brent traded to $94 and change. It is at $85.90 this morning. The Strait saw its first day of something like full transit on June 22.
Fig. 1 — The 13.5 mb/d hole and the four offsets that filled it. No single lever was decisive; the combination was.
Farac's forensic on why the trade failed identifies four mechanisms, and the important thing is that none of them individually would have been sufficient. First, strategic petroleum reserves were drawn down globally at record levels — and critically, drawn down before commercial inventories were allowed to deplete. This matters more than it sounds. Oil trades on the tightness of commercial inventories, because that is where the marginal buyer and seller sit. Filling the gap from strategic reserves meant the price signal that would normally scream shortage never fired. Second, the United States permitted mass export of crude and product reserves, running at something like 6-8 million barrels per day of export growth. Third, China drew on its own inventories — the largest in the world and largely unreported — while capping refinery prices and restricting product exports. Fourth, refiners globally deferred maintenance, extended runs, and tilted output mix toward diesel and jet fuel, the two most stressed products.
“The easier that it seems to arrive at a bearish forecast, the harder the trade will inevitably be. This is something that is always forgotten.”
— Peter Farac, Macro Is Dead, June 26, 2026
There is a second-order point in Farac's piece that we think is underrated. He argues that the combination of Trump's messaging and Bessent's direct market intervention effectively drove speculators out of oil, leaving only real users of the contracts. That sounds like a technicality. It is not. A market without speculators loses its forward-looking function — it stops pricing what will be available in six months and prices only what is available today. The consequence was less demand destruction, which supported economic activity in the near term, but which also means the adjustment has not happened yet. Farac's own framing: short-term over long-term.
He then extends it to a counterfactual worth sitting with. Had that same jawboning apparatus existed in 2008, would Lehman CDS ever have traded through 150 basis points? Probably not — and the runaway counterparty retreat that actually killed the bank might have been prevented. But the losses from years of poor lending would still have been there, accumulating, requiring repeated capital raises until either public markets or the government lost patience. Jawboning delays; it does not resolve. That is the honest frame for where the oil market sits today.
Part II — China Is the Variable Everyone Underweighted
Fig. 2 — China's Q2 GDP came in at 4.3%, below the 4.5-5.0% target band for the first time since the pandemic.
China's role in the Hormuz episode is the part of the story that most commentary flattens into the single word "China." The mechanism was specific and, in Farac's reading, deliberate. Beijing drew down its own reserves while simultaneously disincentivising domestic refineries through price caps and export bans. The effect was to leave seaborne cargo available for its Asian neighbours to purchase at elevated prices, while China itself ran on cheaply sourced reserve barrels and declined to compete for physical.
Whether this was designed or partly forced — a portion certainly was, given the blockade of Iranian crude of which China was the principal buyer — the result was the same. It removed the scramble for physical barrels that had reached something close to panic in mid-April. Farac reads the intent through the trade channel: ASEAN accounts for roughly 20% of China's total exports and had been growing at 13-15% annually. Choke off your neighbours' energy supply and you choke off your own export growth. Seen that way, China's restraint was not charity. It was stimulus to its own trading partners, undertaken to protect domestic GDP growth.
Which brings us to yesterday's data and why it matters forward. At 4.3%, with property investment down 18% and fixed-asset investment down 5.7% in the first half, the salvage operation just got considerably more urgent. Farac's inference — and we think it holds — is that weak domestic data makes China more likely to stay out of the crude market for longer, because the cost of a domestic slowdown outweighs the opportunity cost of foregone barrels by a wide margin. That is bearish for oil on a three-to-six month view, and it is the single most important reason to be sceptical of a fast re-rating in energy even if the ceasefire breaks.
The offsetting consideration, which Farac also flags: those barrels have to be replaced eventually, and they are unlikely to be replaced at anything close to the prices at which they were drawn, because every other holder faces the same replacement problem simultaneously. The reserve drawdown is a loan against future purchases, not a gift.
Part III — What This Says About Our Own Thesis
We have spent three weeks in this brief building an increasingly confident Second Derivative narrative: that the market's evaluative framework has flipped from treating capex as confidence to treating capex as leverage. The evidence genuinely accumulated — TSMC fell on a capex raise, ASML's beat-and-raise faded intraday, Alphabet's extraordinary print sold off on a guide to $205 billion. Monday's Nvidia decline on vendor-financing structure fits the pattern almost too neatly.
Farac's essay is a warning against exactly that feeling. The Hormuz bears also had base numbers that were unarguable, a mechanism that was clean, and a stream of confirming datapoints. What they did not have was an appreciation of how far stop-gap measures can be stretched. His tell was specific and worth borrowing: the moment forecast timelines start slipping without adequate explanation, and the moment questions about those slipped timelines are met with hostility rather than argument, is the moment to ask whether anyone actually has the information required to make the call.
We would be poor stewards of this brief if we did not apply that test to ourselves. Our own error record this month is not encouraging: we reported Meta's capex guide at roughly half its actual level and built framing on it; we carried the wrong FOMC dates for a week; we called an energy add "structural not tactical" days before a ceasefire unwound it; we characterised Tesla's reaction as -4% when the cash session delivered -14%. None of those errors invalidate the underlying observation about capex and market framing. All of them should temper the confidence with which we state it.
Fig. 3 — Farac's framing: three buckets in a rock-paper-scissors, not one directional thesis. The relationships invert depending on how good the AI news is.
Farac's Week 29 notes offer a structurally better frame than the one we have been using, and we are adopting it. Rather than a single bearish AI thesis, he describes three buckets in a rock-paper-scissors: the hyperscalers who write the cheques, the semiconductors who cash them, and software. AI demand up is good for hyperscalers and semis and bad for software — but only up to a point. If it gets too good for semis, the hyperscalers start to hurt, because the cost of the buildout compounds faster than the monetisation. Software only dead-cat bounces to satisfy the negative correlations. Once these three moved together as "tech." Now they cannibalise one another.
The measurable consequence is that NASDAQ volatility sits as elevated relative to S&P volatility as at any point since the dot-com era, while index-level correlation falls and single-stock volatility rises. Farac is direct about why this makes him uneasy: misestimating correlation benefits in spread trades is precisely the mechanism by which portfolios get their volatility badly wrong, and it is how blow-ups like LTCM happened. His own conclusion on the bubble question is worth quoting plainly — he does not think it is one, and expects volatility as that argument is fought out.
THE POSITIONING IMPLICATION — AND THE HONEST VERSION OF IT
Farac's closing prescription is the most useful thing in either essay and it argues against the position we would naturally reach for. His formulation: never go one-way with your positioning, and be prepared to accept the opportunity cost of being wrong. Your portfolio should reflect the probability of doom — and when that probability gets high enough, force yourself to put some risk on, so that you can hold a bearish view and still be solvent to describe it afterwards. Applied here, that argues for keeping the 18% cash into tomorrow's FOMC-and-Meta concentration, because event risk is real and two-sided. But it argues against pressing the AI-complex short further on conviction, and it argues for the barbell we have gradually assembled almost by accident: Intel as a capex-recipient rather than capex-payer, AI-power on contracted cash flows that do not care about the argument, staples and healthcare compounding on fundamentals, transport capturing the fuel relief. That is not a hedged bearish book. It is a book positioned to survive being wrong in either direction, which after the month we have just had is the posture we would rather hold.
8. ANALYST CALLS DRIVING ACTION
Upgrades and target hikes: Wells Fargo raised Coca-Cola to $82 post-print. Morgan Stanley raised Verizon to $54. Wells Fargo holds Intel at $85, Goldman $82, JPMorgan $80. Deutsche raised Delta to $78 on fuel relief. Bernstein raised Constellation Energy to $345.
Downgrades and target cuts: several desks trimmed Nvidia into the vendor-financing news, with the cluster settling around $205-215. Goldman cut Chevron to $170 and JPMorgan cut ExxonMobil to $138 on the ceasefire unwind. JPMorgan holds Meta at $555 into tomorrow. BofA holds Alphabet at $200.
9. STOCKS TO WATCH
Nvidia (NVDA) — -5% Monday on $250B OpenAI guarantee + $500B SK deal. Vendor financing is now the story.
Meta (META) — Reports tomorrow 4:30 PM ET. $125-145B capex guide. The regime-defining print.
TLT — Watch the long end around tomorrow's statement.
10. GLOBAL MACRO SNAPSHOT
Asia: Modestly firmer. Nikkei +0.25%, Hang Seng +0.33%, Shanghai +0.12%. The Hang Seng has staged a notable turnaround on Chinese tech enthusiasm, running perpendicular to domestic data that came in materially worse than expected — a divergence Farac is sceptical will persist. Renewed stimulus chatter has followed the weak Q2 print, though Beijing's ideological aversion to household-level stimulus remains intact; supply-side and export support is the more likely channel.
Europe: Firmer. Stoxx 600 +0.26%, DAX +0.27%, FTSE +0.19%. Airlines continue to lead on the fuel relief; defence names continue to give back conflict premium.
Emerging markets: Oil importers firm, with India notably strong. Watch EM Asian currencies — the Indonesian rupiah has been under pressure as hard-currency reserves fell during the elevated-price period, and Singapore refined-product stocks drew down sharply. That is the corner of the market where the Hormuz episode did real damage, and it has not fully reversed.
11. WEEK AHEAD PREVIEW
Today: Coca-Cola released (beat and raised); P&G; FOMC meeting begins.
Wednesday: FOMC 2:00 PM; Powell 2:30 PM; Meta 4:30 PM — the concentration point.
Thursday: Q2 advance GDP; June Core PCE; jobless claims — all 8:30 AM.
Friday: July nonfarm payrolls 8:30 AM.
Tue 8/11: July Existing Home Sales.
Wed 8/12: July CPI — the September FOMC swing factor.
Late August: Nvidia Q2, now carrying vendor-financing scrutiny.
12. THE CLOSING THOUGHT
Monday split the tape along its now-familiar fault line: the Dow up 262 points and the S&P essentially flat, while the Nasdaq fell on a 5% drop in Nvidia. The reason for that drop is worth holding onto, because it is a new mechanism rather than a continuation — Nvidia is now guaranteeing its customers' ability to buy Nvidia product, at a scale approaching $250 billion for a single Ohio data centre, and the market has shifted from admiring the demand to scrutinising the balance sheet. Coca-Cola beat and raised, which says the defensive rotation is compounding rather than merely hiding. China's Q2 GDP came in at 4.3%, missing its target band for the first time since the pandemic, with property investment down 18%. Oil continues to unwind. Today's spotlight worked through Peter Farac's essays on the Hormuz forecast that failed, and the honest reading is that it is a warning aimed squarely at the kind of confident bearish framework this brief has been building. The base numbers were dire; the doom did not arrive; stop-gap measures stretched further than anyone modelled. We have made enough errors this month to take that seriously. Tomorrow concentrates the FOMC decision at 2:00 PM, Powell at 2:30, and Meta's capex guide at 4:30 — the highest single-day event risk of the quarter, and genuinely two-sided. We are holding 18% cash into it, keeping the barbell, and resisting the urge to press. Being bearish and solvent beats being bearish and right eventually. Trade carefully.
THE BROOKSIDE BRIEF · COMPILED 9:30 AM ET · SOURCES: CNBC / YAHOO FINANCE / WASHINGTON POST / MOTLEY FOOL (JULY 27 CLOSE), COCA-COLA Q2 2026 EARNINGS RELEASE (BEAT + RAISED), BENZINGA / TRADINGKEY / YAHOO (NVDA VENDOR-FINANCING), CHINA NATIONAL BUREAU OF STATISTICS (Q2 GDP 4.3%), CNN / MERICS (CHINA Q2 DETAIL), FEDERAL RESERVE JULY 2026 CALENDAR (FOMC JULY 28-29), META IR (CALL 4:30 PM ET JULY 29), PETER FARAC — 'MACRO IS DEAD': 'WHEN FORECASTING DOOM GOES WRONG' (JUNE 26) AND 'FEARFUL AND RUDDERLESS' (JULY 17), ICE BRENT/WTI, TREASURY H.15, CME FEDWATCH, CBOE (VIX 16.20), GROUNDBREAKER 'THE SECOND DERIVATIVE' (JULY 2), CITRINI RESEARCH, ASCHENBRENNER
MORNING EDITION · WEDNESDAY, JULY 29, 2026 · CEASEFIRE BREAKS, BRENT +6.5% · FOMC 2 PM · MSFT + META AFTER CLOSE · P&G MISSES
Daily Markets Briefing
The Brookside Brief
Markets · Macro · The Day Ahead
EDITOR'S NOTE — THE FED CHAIR IS KEVIN WARSH
We have referred to "Powell's press conference" repeatedly over the past week. That is wrong, and it is not a small error. Jerome Powell's tenure ended in May 2026. Kevin Warsh is the Chair of the Federal Reserve, and today's 2:30 PM press conference is his. The distinction matters well beyond the name: at his first meeting on June 17, Warsh eliminated forward guidance entirely, cutting the FOMC statement to 132 words from 341 in April. His stated rationale is that markets function best reacting to incoming data rather than to the Fed's anticipated reaction to that data. The practical consequence for today is significant — there is no dot plot at this meeting and no forward guidance by policy, so the market has materially less to read than it is accustomed to. We should have caught this earlier and we are correcting the record prominently.
1. THE MORNING SETUP
Good morning. The pause did not hold. Overnight, Iran's Islamic Revolutionary Guard Corps launched ballistic missiles at a United States base in Jordan. U.S. Central Command reports the missiles were successfully intercepted. President Trump told Fox News that Iran "is going to get a beating" in retaliation for what he characterised as an attempted surprise attack on American forces. Brent crude has surged approximately 6.5% to $89.52 and WTI approximately 6.3% to $84.26, reversing the bulk of the ceasefire decline in a single session.
We flagged on Monday that the arrangement was explicitly conditional and reversible, and that trades built on it should be sized as tactical. That caution was correct, though we take no satisfaction in it — the round-trip has been brutal for anyone who chased the de-escalation. Brent has now travelled from $78.80 on July 21 to $94.07 on July 22, down to $84.05 yesterday, and back to $89.52 this morning. That is a fourteen-dollar range in seven sessions.
Tuesday's cash session, which now feels like it belonged to a different week, closed with the same split we have seen repeatedly: the Dow climbed 537.24 points (+1.03%) to 52,747.32 and the S&P 500 added 0.21% to 7,428.78, while the Nasdaq Composite fell 0.22% to 24,876.91. Strong earnings and retreating oil carried the industrials and defensives; chip stocks continued to weigh on the Nasdaq. Both of those drivers have now inverted overnight.
Procter & Gamble reported fiscal Q4 this morning and missed. Net sales of $21.2 billion came in short of expectations, with management pointing to weak consumer demand. The stock is down more than 3% pre-market. This is a genuinely useful counter-signal to yesterday's Coca-Cola beat-and-raise. One print does not make a trend in either direction, but the pair together argue that the staples complex is differentiating on execution rather than rising uniformly — which is what you would expect if the defensive rotation is maturing rather than beginning.
Today's schedule is the concentration point we have been building toward, and it is heavier than we described it on Monday because Microsoft has been added to the evening. The FOMC decision lands at 2:00 PM ET, Chair Warsh's press conference at 2:30 PM, Microsoft's fiscal Q4 shortly after the close, and Meta's Q2 call at 4:30 PM. Between Microsoft and Meta, roughly $340 billion of forward capital-expenditure guidance will be disclosed in ninety minutes. Today's Sector Spotlight works through what each leg can do and how they interact.
2. MARKETS AT A GLANCE
U.S. EQUITY FUTURES (PRE-OPEN — MIXED; ENERGY BID, TECH HEAVY)
Asset
Last
Change
% Chg
S&P 500 (ES)
7,442
+13
+0.18%
Nasdaq 100 (NQ)
24,905
+28
+0.11%
Dow (YM)
52,810
+63
+0.12%
Russell 2000 (RTY)
2,388
-4
-0.17%
TUESDAY JULY 28 CLOSE — DOW NEARLY +550; NASDAQ RED AGAIN ON CHIPS
ASIA & EUROPE (INTRADAY) — RISK-OFF ON THE ESCALATION
Asset
Last
Change
% Chg
Nikkei 225
39,410
-410
-1.03%
Hang Seng
22,215
-265
-1.18%
Shanghai Composite
3,240
-22
-0.67%
Stoxx Europe 600
570.90
-5.20
-0.90%
FTSE 100
8,905
-47
-0.52%
DAX
20,505
-185
-0.89%
3. TOP STORIES
Ceasefire Collapses — IRGC Missiles Strike US Base in Jordan, Brent +6.5%
The de-escalation held for roughly two sessions. Overnight, Iran's Islamic Revolutionary Guard Corps launched ballistic missiles at a United States base in Jordan. U.S. Central Command confirmed the missiles were successfully intercepted with no reported casualties. President Trump responded on Fox News that Iran "is going to get a beating," characterising the launch as an attempted surprise attack on American forces. The oil response was immediate and large: Brent up approximately 6.5% to $89.52; WTI up approximately 6.3% to $84.26. Gold caught a safe-haven bid, up 1.49% to $2,178. Bitcoin sold off 2.63% to $63,410, again behaving as a risk asset rather than a hedge. The Hormuz war-risk insurance rate, which had eased toward 0.65%, is being re-quoted sharply higher this morning.
Procter & Gamble Misses on Weak Consumer Demand
P&G reported fiscal fourth-quarter results this morning with net sales of $21.2 billion, short of Wall Street expectations, and management attributing the shortfall to weak consumer demand. The stock is down more than 3% pre-market. Coming one day after Coca-Cola beat and raised full-year guidance, the contrast is instructive. Coke's strength came through pricing and mix in beverages; P&G's weakness is showing up in household and personal-care volumes, which is a more direct read on the discretionary end of the staples basket. The read-through for the defensive rotation is that it should be run on single-name selection rather than sector beta from here.
FOMC Decides at 2:00 PM — A Genuinely Live Meeting
The Committee announces at 2:00 PM ET with Chair Warsh's press conference at 2:30 PM. The consensus expectation is a hold at the current 3.50-3.75% target range, likely on a 10-2 vote, with a September move left explicitly on the table. A Reuters poll had all 104 surveyed economists expecting a hold. Market pricing is considerably less settled: traders assign roughly 63-65% to a hold and 35-36% to a 25-basis-point hike to 3.75-4.00%. Expectations for a September hike have climbed to approximately 82%. That gap between the economist consensus and the futures market is unusually wide, and it means the surprise risk today is asymmetric toward a hawkish outcome.
Microsoft Reports After the Close — FY2027 Capex Is the Number
Microsoft reports fiscal Q4 after the close. Consensus diluted EPS is $4.21, up roughly 15% year-on-year. Azure growth has been guided to a 30-40% range. But the number that will determine the reaction is fiscal 2027 capital-expenditure guidance, which the market anticipates at $255-260 billion — roughly a 35% increase over the approximately $190 billion Microsoft is spending in fiscal 2026. If that guide arrives as expected it would be the largest single-company capital-expenditure programme ever disclosed. The framing that matters: capex growth running below Azure's growth rate signals discipline; capex growth running above it means the cloud engine cannot fund its own buildout.
Meta Reports at 4:30 PM — Capex Guide From an Already-Extreme Base
Meta's Q2 call is at 4:30 PM ET. Consensus expects EPS of $7.23 on revenue of approximately $59.5 billion. The company has beaten revenue estimates for 15 consecutive quarters and EPS expectations in 13 straight, so the bar for the print itself is high but well understood. The variable is the capex guide, currently $125-145 billion for 2026. Wall Street's median target sits around $815, implying meaningful upside from current levels, which tells you the sell side has not yet marked the capex concern into its models. Watch advertising revenue growth, engagement, AI-driven ad efficiency, and the cost line following the data-centre buildout.
4. MACRO & FED WATCH
The oil reversal has undone much of the disinflation comfort that built over the past three sessions. With Brent back to $89.52, the energy contribution to the July CPI print on August 12 is once again a live concern, and the front end has responded — the two-year yield is up 7 basis points to 4.08% this morning, with the ten-year up 6 to 4.58%.
The structural point worth holding onto today concerns how this Fed communicates. Chair Warsh's decision to abandon forward guidance means the market receives a 132-word statement and a press conference in which the Chair has been explicit that he will not describe a reaction function. His argument is that markets work better responding to data than to the Fed's anticipated response to data. Whatever one makes of that on the merits, the practical consequence is that the information content of today's 2:00 PM release is lower than the market is used to, and the burden of interpretation shifts onto the data calendar — which means tomorrow's Q2 GDP and Core PCE, and Friday's payrolls, carry more weight than they normally would in a post-FOMC week.
5. ECONOMIC CALENDAR
Day
Time (ET)
Release
Consensus / Watchpoint
Tue 7/28
Pre-open
Coca-Cola Q2 (released)
BEAT + RAISED ✓
Wed 7/29
Pre-open
P&G FQ4 (released)
MISS: sales $21.2B; -3% pre
Wed 7/29
2:00 PM
FOMC DECISION
Hold 3.50-3.75% expected 10-2
Wed 7/29
2:30 PM
Chair Warsh presser
No forward guidance by policy
Wed 7/29
~4:05 PM
Microsoft FQ4
FY27 capex $255-260B expected
Wed 7/29
4:30 PM
Meta Q2 call
EPS $7.23e / capex $125-145B
Thu 7/30
8:30 AM
Q2 advance GDP
+2.4% annualised
Thu 7/30
8:30 AM
June Core PCE
Fed's preferred gauge
Thu 7/30
8:30 AM
Weekly jobless claims
230K
Thu 7/30
AH
Apple / Amazon
Completing the megacap week
Fri 7/31
8:30 AM
July NFP
Employment tape
Tue 8/11
10:00 AM
July Existing Home Sales
Housing follow-up
Wed 8/12
8:30 AM
July CPI
Sept FOMC swing factor
Late Aug
AH
Nvidia Q2
Vendor-financing scrutiny
6. EARNINGS WATCH
Today: P&G released and missed; Microsoft and Meta after the close; Qualcomm also reports. Tomorrow brings Apple and Amazon after the close alongside the GDP and PCE data in the morning — meaning the megacap complex delivers its capex picture across roughly thirty hours. By Friday morning the market will have heard from Microsoft, Meta, Apple and Amazon, and will know whether the aggregate 2027 hyperscaler capex number is accelerating or stabilising. That is the single most important thing to come out of this week.
7. SECTOR SPOTLIGHT: NINETY MINUTES AND $340 BILLION
Today concentrates more decision-relevant information into a short window than any session this quarter. Rather than forecast the outcomes, this spotlight maps what each leg can do, how they interact, and — following the discipline we adopted from Farac's essays yesterday — where our own framework is most likely to be wrong.
Part I — The Pause Was a Pause
Fig. 1 — Brent's fourteen-dollar round trip in seven sessions, and back to $89.52 this morning on the IRGC strike.
There is a version of this brief that would claim credit for Monday's caution that the ceasefire was conditional. We would rather draw the more useful lesson, which is about position sizing rather than prediction. We did not know the pause would break this week; we knew only that it could, on a timeline nobody could forecast, because the framework was explicitly reciprocal and reversible. That is precisely Farac's point about geopolitical premium — it is not that de-escalation is unforecastable in some general sense, it is that the resolution runs on political rather than market time, and market data contains almost no information about political time.
The practical consequence is that the correct expression of a view on Hormuz was never a directional oil position in either direction. It was position sizing that survived both outcomes. Anyone who trimmed energy on Monday, as we suggested, has given back the premium and is now watching it re-inflate. Anyone who held is whole. The honest reading is that the trim was right on process and wrong on outcome, and those are different things — but a brief that only reports the times process and outcome agreed is not worth reading.
Part II — The Capex Stack Gets Its Largest Entry Tonight
Fig. 2 — Microsoft's anticipated FY2027 capex guide of $255-260B would exceed Alphabet's $205B and be the largest single-company programme ever disclosed.
Microsoft spending roughly $190 billion in fiscal 2026 and guiding to $255-260 billion for fiscal 2027 would represent a 35% increase, and would place a single company's annual capital expenditure above the GDP of most countries. Meta at $125-145 billion, Alphabet at $205 billion, Amazon reporting tomorrow. The aggregate is the number that matters, and by tomorrow evening the market will have it.
The specific test analysts have converged on for Microsoft is elegant and worth adopting generally: compare the growth rate of capex to the growth rate of the revenue it is meant to support. Azure guided at 30-40% growth against capex growth of 35% is roughly balanced. Capex growth meaningfully above Azure growth means the cloud business is not generating enough to fund its own expansion, and the gap has to be filled from elsewhere on the balance sheet or from external capital. That is a cleaner and more falsifiable formulation than the one we have been using, and it applies across the complex.
THE TEST WE SHOULD HAVE BEEN RUNNING ALL ALONG
We have spent several weeks describing capex acceleration as evidence of a regime shift in how the market evaluates spending. That is an observation about sentiment, and sentiment observations are hard to falsify — which should have been a warning sign. The capex-growth-versus-revenue-growth ratio is better because it produces a specific number that can be checked each quarter and that will eventually be right or wrong. For Microsoft tonight: Azure growth of 35% against capex growth of 35% is neutral; Azure at 30% against capex at 35% is the bearish read; Azure at 40% against capex at 35% argues the spending is keeping pace with the demand it serves. For Meta: the equivalent comparison is advertising revenue growth against the capex step-up, and Meta's ad growth has been running in the high teens against a capex base that is nearly tripling. On that arithmetic Meta looks considerably more stretched than Microsoft, which is close to the opposite of how the market has been treating the two.
Part III — How the Legs Interact
Fig. 3 — Today's sequence. The Fed leg is information-light by design; the capex legs are information-dense.
The interaction risk we flagged Monday remains, with one important amendment. We described the adverse scenario as a hawkish Fed compounding with a capex raise. Under Warsh, the Fed leg is structurally less likely to deliver a large surprise in either direction, because a 132-word statement and a Chair who declines to describe a reaction function simply contain less to react to. The hold is well priced. The risk is concentrated in the 35% of the futures market positioned for a hike, and in whether Warsh's tone acknowledges the oil reversal at all.
That means tonight's variance is dominated by the capex legs, not the Fed leg. Microsoft and Meta together will disclose roughly $340 billion of forward capital commitment inside ninety minutes, into a tape where Nvidia has just fallen 5% on vendor-financing concerns and where the semiconductor complex has been red for six of the last eight sessions. If both raise, the Second-Derivative reading gets its cleanest confirmation yet. If both hold, the relief rally is likely larger than the fundamentals warrant, precisely because positioning has crowded to one side.
POSITIONING INTO THE CLOSE — AND WHAT WOULD CHANGE OUR MIND
We are holding the 18% cash into tonight, and holding the barbell: Intel as a capex recipient, AI-power on contracted cash flows, healthcare and staples selected on single-name execution rather than sector beta, transport now reduced given the oil reversal. Energy we trimmed Monday and are not chasing back at $89.52 — re-entering a geopolitical premium two days after selling it is how one manages to be wrong twice. In the spirit of yesterday's discipline, here is what would make us abandon the Second-Derivative framing rather than defend it: if Microsoft guides FY2027 capex at $255-260 billion tonight and the stock trades up on Azure strength, and Meta guides to the high end of $125-145 billion and also trades up, then the market is still rewarding capex and our read on the regime is simply wrong. We would rather say that in advance than reinterpret it afterwards. Two clean counter-examples in one evening would be enough.
8. ANALYST CALLS DRIVING ACTION
Upgrades and target hikes: Wells Fargo raised Coca-Cola to $82 after the beat. Several desks lifted energy targets this morning on the escalation, though most carry the caveat that the moves are event-driven. Intel targets hold at Wells Fargo $85, Goldman $82, JPMorgan $80. Bernstein holds Constellation Energy at $345.
Downgrades and target cuts: P&G saw a cluster of trims this morning following the sales miss. The Nvidia target cluster remains around $205-215 post vendor-financing disclosures. Meta's Street median sits near $815 into tonight, which is well above the current price and implies the sell side has not yet written down the capex concern.
9. STOCKS TO WATCH
Microsoft (MSFT) — Reports after close. FY2027 capex guide $255-260B expected. The number of the week.
Meta (META) — 4:30 PM call. EPS $7.23e, revenue $59.5Be, capex $125-145B. Street median $815.
JPM / MS / BLK — Bank complex; watch the curve into 2 PM.
DHI / LEN / TOL / KBH — Homebuilders; yields backing up is a headwind again.
Gold (GLD) — Safe-haven bid, +1.49% to $2,178.
Bitcoin — $63,410, -2.63%. Trading as risk, not hedge.
VIX cash — 15.80 Tuesday close; expect a higher print on the open.
10. GLOBAL MACRO SNAPSHOT
Asia: Risk-off on the escalation. Nikkei -1.03%, Hang Seng -1.18%, Shanghai -0.67%. Oil-importing economies hit hardest, with Japanese and Korean airlines and shippers giving back Monday's gains in full. Indian equities under pressure given import dependence.
Europe: Broadly lower. Stoxx 600 -0.90%, DAX -0.89%. European defence names re-bid sharply; airlines reverse. The energy-intensive industrial complex in Germany is the specific pressure point if Brent sustains above $90.
Emerging markets: Oil importers under renewed pressure. The EM Asian currency stress we flagged yesterday — the Indonesian rupiah in particular — is the corner to watch, because it did not fully recover during the ceasefire window and is now facing a second shock from a weaker starting position.
11. WEEK AHEAD PREVIEW
Today: P&G released and missed; FOMC 2:00 PM; Warsh 2:30 PM; Microsoft and Meta after close.
Thursday: Q2 advance GDP, June Core PCE, jobless claims — all 8:30 AM. Apple and Amazon after close.
Friday: July nonfarm payrolls 8:30 AM.
Tue 8/11: July Existing Home Sales.
Wed 8/12: July CPI — the September FOMC swing factor, now with a live energy contribution again.
Late August: Nvidia Q2, under vendor-financing scrutiny.
12. THE CLOSING THOUGHT
The pause was a pause. Iran's IRGC fired ballistic missiles at a US base in Jordan overnight, they were intercepted, and the President has promised retaliation. Brent is up 6.5% to $89.52 and has now travelled a fourteen-dollar range in seven sessions. We flagged Monday that the arrangement was conditional and that trades built on it should be tactical; that was right on process even where the trim was wrong on outcome, and the distinction is worth being honest about. P&G missed on weak consumer demand one day after Coca-Cola beat and raised, which argues the defensive rotation should now be run on single-name execution rather than sector beta. Today concentrates the FOMC decision at 2:00 PM, Chair Warsh at 2:30, Microsoft shortly after the close, and Meta at 4:30 — and we correct the record that the Chair is Warsh, not Powell, which matters because he has abandoned forward guidance and the statement now runs to 132 words. The Fed leg is information-light by design. The variance tonight sits in the capex legs: roughly $340 billion of forward commitment disclosed inside ninety minutes. We have set out in Section 7 what would make us abandon our framework rather than defend it — two clean counter-examples tonight would do it. Holding 18% cash, holding the barbell, not chasing energy back at $89.52. Trade carefully.
THE BROOKSIDE BRIEF · COMPILED 9:30 AM ET · SOURCES: CNBC / YAHOO FINANCE / THESTREET (JULY 28 CLOSE), CNBC (OIL +6.5% ON IRGC STRIKE), PROCTER & GAMBLE FQ4 2026 RESULTS, FEDERAL RESERVE JULY 2026 CALENDAR AND JUNE 17 WARSH PRESS CONFERENCE TRANSCRIPT, CNN / FORTUNE / MARKETPLACE (WARSH FORWARD-GUIDANCE CHANGE), REUTERS ECONOMIST POLL AND CME FEDWATCH (FOMC PRICING), MICROSOFT AND META INVESTOR RELATIONS (EARNINGS SCHEDULES AND GUIDANCE), TRADINGKEY / BARCHART / BENZINGA (CONSENSUS ESTIMATES), ICE BRENT/WTI, TREASURY H.15, CBOE, PETER FARAC — 'MACRO IS DEAD', GROUNDBREAKER 'THE SECOND DERIVATIVE', CITRINI RESEARCH, ASCHENBRENNER
MORNING EDITION · THURSDAY, JULY 30, 2026 · HAWKISH HOLD, 3 DISSENTS · DOW -1,153 · NASDAQ IN CORRECTION · MSFT +4% / META -9.6%
Daily Markets Briefing
The Brookside Brief
Markets · Macro · The Day Ahead
1. THE MORNING SETUP
Good morning. Wednesday delivered the worst session of the year and a verdict on the question this brief has been circling all month. Taking the tape first: the Dow fell 1,153.18 points, or 2.19%, to 51,594.14 — its worst decline since April 2025. The S&P 500 slid 1.52% to 7,316.15. The Nasdaq Composite fell 1.74% to 24,442.94, which leaves it more than 10% below its all-time high and therefore in correction territory.
The proximate cause was the bond market's reading of a hawkish hold. The Committee left the target range at 3.50-3.75% for a fifth consecutive meeting, but three presidents dissented in favour of a quarter-point hike — Beth Hammack of Cleveland, Neel Kashkari of Minneapolis and Lorie Logan of Dallas. That is the largest number of dissents in a single direction since September 2016. The statement noted that "economic activity is expanding at a solid pace despite elevated uncertainty that owes, in part, to the conflict in the Middle East." Chair Warsh characterised the Committee's posture as "watchful thinking" rather than "watchful waiting," and reaffirmed the 2% target.
Bonds took that as evidence the Fed may be falling behind. The ten-year yield jumped seven basis points through 4.67%. The thirty-year reached 5.239% — its highest level since 2007. A long end at those levels lifts the discount rate on every equity and raises financing costs across the economy, which is the mechanism that turned a hawkish hold into a 1,100-point Dow decline.
Then the earnings arrived, and they split. Microsoft beat comprehensively and rose. Meta beat on revenue, missed badly on earnings, and fell nearly ten percent. Microsoft posted revenue of $90.01 billion against $87.63 billion expected, adjusted EPS of $4.74 against $4.21, and Azure growth of 43% against a roughly 40% expectation — with Azure crossing $100 billion of annual revenue for the first time. It guided fiscal 2027 capital expenditure to $255-260 billion, up roughly 35%, and the stock rose 2.5-4% after hours. Meta posted revenue of $60.8 billion, up 28%, but EPS of $6.18 against $7.23 expected — a 13.8% miss on legal and severance charges — while capital expenditure of $31.1 billion in the quarter drove free cash flow down to $784 million. It raised the low end of 2026 capex guidance to $130-145 billion, the second increase this year. The stock fell 9.64% after hours.
Yesterday we published a specific falsification test: if both companies raised capital expenditure and both traded up, our reading of the regime was simply wrong and we would say so. We got one counter-example, not two. The framework survives — but the more useful outcome is that the ratio we introduced yesterday, comparing capex growth to the growth of the revenue it funds, correctly separated the two names in advance. Section 7 works through the paired results properly.
Today brings the heaviest data of the week at 8:30 AM: second-quarter advance GDP, June personal income and spending, the June PCE and core PCE price indices, and weekly jobless claims. Core PCE is forecast at 0.2% against 0.3% prior. Apple and Amazon report after the close, completing the megacap capex picture. Futures are modestly higher, with Dow futures up around 140 points.
2. MARKETS AT A GLANCE
U.S. EQUITY FUTURES (PRE-OPEN — MODEST REBOUND AHEAD OF THE DATA)
Asset
Last
Change
% Chg
Dow (YM)
51,745
+140
+0.27%
S&P 500 (ES)
7,332
+16
+0.22%
Nasdaq 100 (NQ)
24,505
+62
+0.25%
Russell 2000 (RTY)
2,341
+6
+0.26%
WEDNESDAY JULY 29 CLOSE — WORST SESSION OF THE YEAR
Asset
Last
Change
% Chg
Dow Jones Industrial Avg.
51,594.14
-1,153.18
-2.19%
S&P 500
7,316.15
-112.63
-1.52%
Nasdaq Composite
24,442.94
-433.97
-1.74%
Nasdaq vs all-time high
—
—
-10%+ (correction)
VIX (cash)
20.40
+4.60
+29.1%
RATES & FX — THE LONG END IS THE STORY
Asset
Last
Change
% Chg
Fed funds target
3.50-3.75%
unchanged
5th hold
UST 2-Year
4.14%
+6 bps
—
UST 10-Year
4.67%
+7 bps
—
UST 30-Year
5.239%
+9 bps
2007 high
DXY (Dollar Index)
100.55
+0.40
+0.40%
USD/JPY
158.90
+0.50
+0.32%
COMMODITIES & CRYPTO
Asset
Last
Change
% Chg
WTI Crude (Sep)
$85.10
+$0.84
+1.00%
Brent Crude (Sep)
$90.35
+$0.83
+0.93%
Gold (spot)
$2,196
+$18
+0.83%
Silver (spot)
$22.55
+$0.20
+0.89%
Bitcoin
$61,240
-$2,170
-3.42%
AFTER-HOURS EARNINGS REACTION (WEDNESDAY)
Asset
Last
Change
% Chg
Microsoft (MSFT)
~$400
+~$10
+2.5% to +4%
Meta (META)
—
—
-9.64%
3. TOP STORIES
A Hawkish Hold — Three Dissents, the Most in One Direction Since 2016
The Committee held at 3.50-3.75% for a fifth consecutive meeting, but the vote was the story. Cleveland's Beth Hammack, Minneapolis's Neel Kashkari and Dallas's Lorie Logan all dissented in favour of a quarter-point increase. Three dissents pointing the same way is the most since September 2016 and tells you the internal debate is considerably closer than a fifth straight hold implies. The statement, in keeping with Chair Warsh's compressed format, noted that activity is "expanding at a solid pace despite elevated uncertainty that owes, in part, to the conflict in the Middle East." Warsh described the stance as "watchful thinking" rather than "watchful waiting" — a formulation that reads as deliberately more active than the phrase it replaces — and reiterated that the 2% target remains in force. Markets read the combination as a Committee that is behind the inflation curve and knows it.
The Thirty-Year at 5.239% — Highest Since 2007
The bond market's response was the transmission mechanism for Wednesday's equity decline. The ten-year rose seven basis points through 4.67%; the thirty-year reached 5.239%, a level not seen since 2007. The significance is mechanical rather than sentimental: the long end sets the discount rate applied to distant cash flows, which is precisely where the valuation of long-duration technology equity lives, and it sets financing costs for the debt-funded portion of the AI buildout. A capital-expenditure programme that pencils at a 4.5% cost of capital looks materially different at 5.25%.
Microsoft Beats Across the Board — Azure Accelerates to 43%
Microsoft's fiscal Q4 was a comprehensive beat. Revenue of $90.01 billion versus $87.63 billion expected, a 2.71% beat and up 17.75% year on year. Adjusted EPS of $4.74 versus $4.21 expected, an 11.81% beat and up 29.86% from $3.65 a year ago. Operating profit of $40.6 billion, up 18%. Azure grew 43% against an expectation nearer 40%, and Azure revenue crossed $100 billion for the fiscal year for the first time. Commercial remaining performance obligations rose 84%. Management guided fiscal Q1 Azure growth to approximately 45% in constant currency and total revenue to $89.85-90.95 billion. Capital expenditure guidance for fiscal 2027 came in at $255-260 billion against roughly $190 billion in fiscal 2026, with quarterly capex set to top $50 billion. Satya Nadella noted the company added a gigawatt of data-centre capacity in the quarter and remains on track to double its footprint within two years. The stock rose 2.5-4% after hours.
Meta Beats on Revenue, Misses on Earnings, Falls 9.6%
Meta's quarter was the mirror image. Revenue of $60.8 billion, up 28% year on year, beat the roughly $59.5 billion consensus. But EPS of $6.18 missed the $7.23 estimate by 13.8%, with management attributing the shortfall to elevated legal and severance charges. The number that drove the reaction was further down the statement: capital expenditure of $31.1 billion in the quarter pushed free cash flow down to $784 million, from a base that had been comfortably in the tens of billions annually. Management then raised the low end of full-year 2026 capex guidance to $130-145 billion. That is the second increase this year — the guide began below $100 billion, moved to $125-145 billion, and now sits at $130-145 billion. The stock fell 9.64% after hours.
Today: GDP, Core PCE, Claims at 8:30 — Apple and Amazon After the Close
The heaviest data of the week arrives simultaneously at 8:30 AM ET: second-quarter advance GDP, June personal income and spending, the June PCE and core PCE price indices, and weekly jobless claims for the week ending July 25. Core PCE is forecast at 0.2% month-on-month against 0.3% prior. Given three dissents yesterday and a thirty-year at 2007 highs, a core PCE print at or above 0.3% would be read as confirming the hawkish minority and would pressure the long end further. Apple and Amazon report after the close, completing the megacap capital-expenditure picture for the quarter.
4. MACRO & FED WATCH
The framing for September has shifted materially in twenty-four hours. Three dissents for a hike, a Chair describing the stance as "watchful thinking," Brent back above $90, and a thirty-year at 5.239% collectively argue that the market's roughly 82% probability on a September increase is not an overstatement. The specific sequence that matters between now and then: today's core PCE, Friday's July payrolls, and the July CPI print on August 12. A soft core PCE this morning would be the first genuine relief in a week; a firm one would leave the Committee's hawkish minority looking prescient and the long end without support.
One structural observation on the Warsh Fed worth recording. The compressed statement and the absence of forward guidance were intended to make markets respond to data rather than to the Fed's anticipated reaction. Wednesday suggests a second-order consequence: with less guidance to anchor expectations, the dissent count becomes the primary signal of the Committee's internal distribution, and markets will read it far more aggressively than they did under a regime where the Chair's language did that work. Three dissents moved the long end nine basis points. That is a communication channel the Committee may not have intended to open.
5. ECONOMIC CALENDAR
Day
Time (ET)
Release
Consensus / Actual
Wed 7/29
2:00 PM
FOMC (released)
HOLD 3.50-3.75%; 3 dissents to hike
Wed 7/29
AH
Microsoft FQ4 (released)
BEAT across; Azure +43%; +2.5-4%
Wed 7/29
AH
Meta Q2 (released)
Rev beat / EPS -13.8%; -9.64%
Thu 7/30
8:30 AM
Q2 advance GDP
+2.4% annualised
Thu 7/30
8:30 AM
June Core PCE
+0.2% m/m (prior +0.3%)
Thu 7/30
8:30 AM
Personal income & spending
June data
Thu 7/30
8:30 AM
Weekly jobless claims
w/e July 25
Thu 7/30
AH
Apple (AAPL)
iPhone, services, China, Apple Intelligence
Thu 7/30
AH
Amazon (AMZN)
AWS growth and capex guide
Fri 7/31
8:30 AM
July NFP
Employment tape
Tue 8/11
10:00 AM
July Existing Home Sales
Housing follow-up
Wed 8/12
8:30 AM
July CPI
September FOMC swing factor
Late Aug
AH
Nvidia Q2
Vendor-financing scrutiny
6. EARNINGS WATCH
Microsoft and Meta are behind us and they discriminated cleanly. Apple and Amazon tonight complete the picture. For Amazon the relevant number is the AWS growth rate against the capital-expenditure guide — the same test Microsoft passed and Meta failed. For Apple the question is different in kind, because Apple has conspicuously not participated in the capex arms race; watch iPhone units, services growth, China, and any concrete monetisation detail on Apple Intelligence. By Friday morning the aggregate 2027 hyperscaler capital-expenditure figure will be known, and it is the single most important number to come out of this earnings season.
7. SECTOR SPOTLIGHT: THE TEST WORKED
Yesterday's brief set out a falsification condition in advance: if Microsoft guided fiscal 2027 capital expenditure to $255-260 billion and traded up, and Meta guided to the high end of its range and also traded up, then the market was still rewarding capital expenditure and our reading of the regime was wrong. We committed to saying so rather than reinterpreting the evidence afterwards.
We got one counter-example. Microsoft raised capex 35% and the stock rose. Meta raised capex again and the stock fell nearly ten percent. One out of two does not falsify the framework — but nor does it vindicate the simple version of it, which held that capex raises are punished. The correct conclusion is narrower and more useful: the market is not punishing capital expenditure. It is punishing capital expenditure that outruns the revenue it is supposed to be funding.
Part I — The Paired Scorecard
Fig. 2 — Both companies beat on revenue. Microsoft beat on earnings by 11.8%; Meta missed by 13.8%. Only one was rewarded.
The summary table below follows the beat/miss discipline of a standard post-earnings update: quantify the variance, then explain what drove it.
TABLE 1 — MICROSOFT FQ4 2026 VS META Q2 2026: RESULTS AND REACTION
Metric
Reported vs consensus
Variance
Verdict
Revenue
$90.01B vs $87.63B
+2.71%
BEAT
Adj. EPS
$4.74 vs $4.21
+11.81%
BEAT
Key segment
Azure +43% vs ~40%
+3 pts
BEAT
Capex guide
FY27 $255-260B vs $190B
+35%
RAISED
FCF signal
Op. profit $40.6B, +18%
—
HEALTHY
Stock (AH)
~$400
+2.5% to +4%
REWARDED
— Meta —
Revenue
$60.8B vs ~$59.5B
+2.20%
BEAT
EPS
$6.18 vs $7.23
-13.80%
MISS
Key driver
Legal + severance charges
—
ONE-OFF?
Capex guide
2026 $130-145B vs $46B '25
~+199%
RAISED (2nd)
FCF signal
FCF $784M on $31.1B capex
—
COLLAPSED
Stock (AH)
—
-9.64%
PUNISHED
Two points on the Meta line worth separating carefully. First, the EPS miss was attributed to legal and severance charges, which are arguably non-recurring — a bull would reasonably discount them. Second, and not discountable: free cash flow of $784 million on quarterly capital expenditure of $31.1 billion is not a charge-driven artefact. It is the arithmetic of a company spending its operating cash flow as fast as it generates it. The market punished the second fact, not the first.
Part II — The Buildout Coverage Ratio
Fig. 1 — Guided capex growth divided by the growth of the revenue it funds. Below 1.0x the engine outgrows the spend; above it, the reverse.
Yesterday we proposed replacing our sentiment-based framing with something falsifiable: compare the growth rate of capital expenditure to the growth rate of the revenue it is meant to support. Running the numbers on last night's disclosures:
Microsoft. Fiscal 2027 capex guidance of $255-260 billion against roughly $190 billion in fiscal 2026 is approximately 35% growth. Azure, the revenue line that spending funds, grew 43% and is guided to roughly 45% next quarter. Coverage ratio: 0.81x. The engine is outgrowing the buildout.
Meta. Full-year 2026 capex guidance of $130-145 billion against $46 billion actually spent in 2025 is approximately 199% growth at the midpoint. Total revenue grew 28%. Coverage ratio: 7.11x. The buildout is outrunning the engine by a factor of seven.
Those two numbers were computable before the market opened, from guidance already public. They separated a stock that rose 4% from one that fell 9.6%. We are adopting the ratio as a standing metric and will publish it for Amazon and Apple after tonight's prints.
WHAT THE RATIO DOES AND DOES NOT TELL YOU
The Buildout Coverage Ratio is a crude instrument and it is worth being explicit about its limits before it gets over-applied. It says nothing about whether the spending will eventually pay off — a ratio of 7x could be entirely rational if the revenue arrives in 2029, and Amazon spent years above 1.0x building AWS before the market decided that was visionary rather than reckless. What the ratio measures is narrower: whether a company is funding its buildout from the cash flow the buildout is generating, or from somewhere else. Below 1.0x, the programme is self-financing and management retains optionality. Above 1.0x, and particularly far above it, the programme depends on balance-sheet capacity, external capital, or investor patience — three things that are abundant in a benign tape and scarce in a hostile one. With the thirty-year at 5.239%, the tape is becoming hostile. That is why the ratio is discriminating now when it would not have twelve months ago, and it is the honest reason Meta was punished for arithmetic that the market shrugged at in April.
Part III — What Wednesday Actually Repriced
Fig. 3 — Wednesday's decline across the indices, and the yield curve that caused it. The thirty-year is at levels last seen in 2007.
It would be tidy to attribute Wednesday entirely to the Fed. The sequencing argues otherwise. The equity decline was well established before the earnings landed, driven by the dissent count and the move in the long end. What the earnings then did was demonstrate that the market has begun to discriminate within the AI complex rather than treating it as a single position — Microsoft up, Meta down, on the same night, on the same broad theme.
That matters for the correlation observation we borrowed from Farac earlier this week. His framing was that the hyperscalers, the semiconductors and software have stopped moving together and begun cannibalising one another, with index correlation falling while single-stock volatility rises. Wednesday night was that dynamic operating inside a single sector on a single evening. The practical implication is that sector-level expressions of an AI view — long or short the complex — are becoming less effective, and single-name selection on balance-sheet criteria is becoming more so.
POSITIONING — WHAT CHANGES AND WHAT DOES NOT
The barbell holds and gets more specific. Adding to Microsoft on the print: a 0.81x coverage ratio, Azure through $100 billion annually, commercial RPO up 84%, and a business funding its own buildout is the cleanest large-cap expression of AI exposure available. Maintaining Intel as a capex recipient. Maintaining AI-power (CEG, VST, TLN, GEV, ETN, PWR) on contracted cash flows. Reducing Meta further — not on the EPS miss, which may well be non-recurring, but on free cash flow of $784 million and a second capex raise inside one year. Holding reduced Alphabet and Tesla. Maintaining healthcare and staples selected on execution. Reducing homebuilders — a thirty-year at 5.239% is a direct headwind and we have been too slow on this. Not chasing energy at $90.35. Cash comes down from 18% to 15%, deployed into Microsoft and healthcare, because the event risk we were holding against has now resolved. We would rather own the names that pass the coverage test than hold cash against a correction that has already happened.
8. ANALYST CALLS DRIVING ACTION
Upgrades and target hikes: a broad cluster of Microsoft target increases following the Azure acceleration, with the Street moving toward the $450-480 range. Wells Fargo holds Intel at $85. Bernstein holds Constellation Energy at $345.
Downgrades and target cuts: Meta saw widespread reductions overnight, with the Street median falling sharply from the ~$815 level that stood into the print — the concentration of cuts reflects how little of the capex concern had been marked into models beforehand. Homebuilder targets trimmed on the long-end move. The Nvidia cluster remains near $205-215.
9. STOCKS TO WATCH
Microsoft (MSFT) — Beat across; Azure +43%; coverage ratio 0.81x. ADD.
Gold (GLD) — $2,196, +0.83%. Working as a hedge; Bitcoin is not.
Bitcoin — $61,240, -3.42%. Third consecutive risk-off session down.
TLT — Under pressure; 30-year at 2007 highs.
VIX cash — 20.40 (+29% Wednesday). First 20-handle since the spring.
10. GLOBAL MACRO SNAPSHOT
Asia: Lower following the US session, with the semiconductor complex mixed — Microsoft's guide supports the equipment names while Meta's reaction weighs on the memory and advertising-adjacent complex. Japanese and Korean exporters pressured by the stronger dollar.
Europe: Softer. The long-end move is the transmission channel; European utilities and real estate, the most duration-sensitive parts of the index, underperformed. Defence names firm on the continued Middle East escalation.
Emerging markets: Under pressure from the dollar and the long end together. Oil importers with external funding needs are the vulnerable cohort, and the EM Asian currency stress we have flagged twice this week has not eased.
11. WEEK AHEAD PREVIEW
Today: Q2 GDP, June Core PCE, personal income and spending, jobless claims — all 8:30 AM. Apple and Amazon after close.
Friday: July nonfarm payrolls 8:30 AM.
Tue 8/11: July Existing Home Sales.
Wed 8/12: July CPI — the September swing factor.
Late August: Nvidia Q2, under vendor-financing scrutiny.
12. THE CLOSING THOUGHT
Wednesday was the worst session of the year: Dow -1,153 points, its largest decline since April 2025; Nasdaq -1.74% and now more than 10% off its high, which puts it in correction. The cause was a hawkish hold — rates unchanged at 3.50-3.75% but three presidents dissenting for a hike, the most in one direction since September 2016 — transmitted through a bond market that took it as evidence the Fed is behind. The thirty-year reached 5.239%, its highest since 2007. Then the earnings split: Microsoft beat across the board with Azure accelerating to 43% and rose; Meta beat on revenue, missed EPS by 13.8%, saw free cash flow collapse to $784 million, raised capex again, and fell 9.64%. We published a falsification test yesterday and it returned one counter-example rather than two, which refines the framework rather than breaking it: the market is not punishing capital expenditure, it is punishing capital expenditure that outruns the revenue funding it. The coverage ratio — 0.81x for Microsoft, 7.11x for Meta — was computable in advance and separated the two. We are adopting it as a standing metric and will run it on Amazon tonight. Cash comes down to 15%, into Microsoft and healthcare; homebuilders reduced on the long end. Today's core PCE at 8:30 is the next thing that matters. Trade carefully.
THE BROOKSIDE BRIEF · COMPILED 9:30 AM ET · SOURCES: CNBC / YAHOO FINANCE / THESTREET / MOTLEY FOOL / WASHINGTON POST (JULY 29 CLOSE), FEDERAL RESERVE FOMC STATEMENT AND CHAIR WARSH PRESS CONFERENCE JULY 29 2026, CNBC / CNN / US NEWS (DISSENT DETAIL), MICROSOFT FQ4 2026 EARNINGS RELEASE AND CALL, META PLATFORMS Q2 2026 EARNINGS RELEASE AND CALL, TRADINGKEY / GURUFOCUS / BENZINGA / STOCKTITAN (RESULTS DETAIL AND CONSENSUS), INVESTING.COM (JULY 30 DATA CALENDAR), TREASURY H.15, ICE BRENT/WTI, CBOE, PETER FARAC 'MACRO IS DEAD', GROUNDBREAKER 'THE SECOND DERIVATIVE' · SECTION 7 PREPARED USING THE EARNINGS-REVIEWER PLUGIN METHODOLOGY
MORNING EDITION · FRIDAY, JULY 31, 2026 · MONTH END · MSFT +16%, LARGEST ONE-DAY VALUE GAIN EVER · AMZN AWS +37% · AAPL -4%
Daily Markets Briefing
The Brookside Brief
Markets · Macro · The Day Ahead
EDITOR'S NOTE — JULY PAYROLLS IS AUGUST 7, NOT TODAY
Our calendars this week listed July nonfarm payrolls for today, Friday July 31. That is wrong. The Bureau of Labor Statistics publishes the Employment Situation for July on Friday, August 7. The June report was released July 2. There is no payrolls print today; the week ends on month-end flows and the residue of yesterday's data. We have now made calendar errors on IBM, Verizon, Coca-Cola, GE Vernova, Existing Home Sales, the FOMC dates and now payrolls in the space of a fortnight, which is a pattern rather than a run of bad luck. From Monday we are building the week's calendar once, from primary sources — BLS, BEA, the Federal Reserve and company investor-relations pages — and not amending it from memory mid-week.
1. THE MORNING SETUP
Good morning, and welcome to month end. Thursday delivered a violent reversal of Wednesday's rout and one genuinely historic number. The Dow rose 613.92 points, or 1.2%, to 52,208.06. The S&P 500 climbed 1.7% to 7,437.64. The Nasdaq Composite gained 2.8% to 25,122.18, pulling itself back out of the correction territory it had entered the day before.
The engine was a single stock. Microsoft rose approximately 16%, adding roughly $450 billion of market value in one session — the largest single-day value gain by any company in history. That is not a typographical exaggeration and it is worth pausing on: one company added more value in a day than the entire market capitalisation of all but a handful of listed businesses. The proximate cause was Azure at 43% with guidance to roughly 45%, but the deeper cause was positioning — the market had been braced for a capital-expenditure disappointment and got an acceleration instead.
The macro data that arrived before the open was genuinely mixed and deserves care rather than a headline. Second-quarter GDP came in at 1.5% annualised against 2.1% expected — a sharp miss. But the GDP price index printed 6.3% against 3.6% expected, which is an inflation shock and the sort of combination that gets the word stagflation used. Against that, the monthly inflation data was benign: June headline PCE fell 0.1% and core PCE rose just 0.1%, putting annual headline at 3.7% and annual core at 3.3%. Initial jobless claims came in at 197,000, which is low. Personal consumption rebounded to 3.2% against 0.4% expected. Section 7 works through how to hold those together, but the short version is that the quarterly deflator and the monthly core are telling different stories and the market chose to believe the monthly one.
Then the last two megacaps reported. Amazon delivered the quarter of the week after Microsoft's: revenue of $200.6 billion up 20%, operating income of $27.5 billion up 43%, and AWS growth of 36.7% — against roughly 31% expected and the fastest AWS has grown in eighteen quarters. AWS operating margin expanded 650 basis points to 39%. Management raised 2026 capital-expenditure guidance to $220 billion, and the stock rose anyway. Apple beat on revenue and earnings — $109.42 billion against $108.79 billion, EPS of $2.02 against $1.88, iPhone sales up 22% — and fell more than 4%, on a services miss and guidance the company attributed to supply constraints.
That completes the megacap set, and it completes the test we have been running. The Buildout Coverage Ratio we introduced on Wednesday and applied on Thursday now has four observations, and its rank order matched the rank order of the market's response exactly. Section 7 lays out the full table.
2. MARKETS AT A GLANCE
THURSDAY JULY 30 CLOSE — SHARP REBOUND LED BY MICROSOFT
Asset
Last
Change
% Chg
Dow Jones Industrial Avg.
52,208.06
+613.92
+1.20%
S&P 500
7,437.64
+121.49
+1.70%
Nasdaq Composite
25,122.18
+679.24
+2.80%
Microsoft (MSFT)
—
~+$450B mkt cap
+16%
VIX (cash)
17.10
-3.30
-16.2%
THURSDAY'S MACRO DATA — A MIXED PRINT
Release
Actual
Consensus
Read
Q2 GDP (annualised)
1.5%
vs 2.1% est
MISS
GDP price index
6.3%
vs 3.6% est
HOT
Core PCE (Q2, q/q)
3.4%
vs 3.5% est
IN LINE
Headline PCE (June, m/m)
-0.1%
—
SOFT
Core PCE (June, m/m)
+0.1%
—
SOFT
Core PCE (y/y)
3.3%
—
ABOVE TARGET
Initial jobless claims
197K
—
LOW
Personal consumption
3.2%
vs 0.4% est
STRONG
AFTER-HOURS EARNINGS REACTION (THURSDAY)
Name
Headline
Detail
Reaction
Amazon (AMZN)
AWS +36.7%
capex to $220B
HIGHER
Apple (AAPL)
Rev + EPS beat
services miss, guide
-4%+
RATES & FX — LONG END EASED BACK
Asset
Last
Change
% Chg
Fed funds target
3.50-3.75%
—
held Wed
UST 2-Year
4.09%
-5 bps
—
UST 10-Year
4.60%
-7 bps
—
UST 30-Year
5.17%
-7 bps
off the high
DXY (Dollar Index)
100.20
-0.35
-0.35%
COMMODITIES & CRYPTO
Asset
Last
Change
% Chg
WTI Crude (Sep)
$84.40
-$0.70
-0.82%
Brent Crude (Sep)
$89.60
-$0.75
-0.83%
Gold (spot)
$2,188
-$8
-0.36%
Bitcoin
$62,850
+$1,610
+2.63%
3. TOP STORIES
Microsoft Adds $450 Billion in a Day — the Largest Single-Session Gain Ever
Microsoft rose approximately 16% on Thursday, adding roughly $450 billion of market capitalisation. That is the largest one-day increase in value recorded by any company. The catalyst was Wednesday night's print — revenue of $90.01 billion, adjusted EPS of $4.74, Azure growth of 43% against a roughly 40% expectation, Azure through $100 billion of annual revenue, and commercial remaining performance obligations up 84% — but the magnitude of the move says more about positioning than about the results. Coming into the print, the market's working assumption across the megacap complex was that a large capital-expenditure guide would be punished. Microsoft guided fiscal 2027 capex to $255-260 billion, up roughly 35%, and was rewarded because the revenue line funding that spending accelerated rather than decelerated. The scale of the repricing is the market marking to market a distinction it had not previously been making.
Amazon: AWS Grows 36.7%, Fastest in Eighteen Quarters — and Raises Capex to $220B
Amazon's second quarter was the second-best print of the week. Revenue of $200.6 billion grew 20% year on year. Operating income of $27.5 billion grew 43%. AWS revenue grew 36.7% against roughly 31% expected — its fastest rate in eighteen quarters — and AWS operating margin expanded 650 basis points to 39%. Advertising grew 26% to $19.8 billion. Management disclosed that the AI and custom-silicon businesses each now exceed $25 billion in annualised revenue run rate and are growing at triple-digit rates. Capital-expenditure guidance for 2026 was raised to $220 billion from a prior figure nearer $200 billion, with management citing strong AI demand and warning of capacity constraints continuing into 2027 and 2028. The stock rose after hours. Third-quarter revenue guidance of $197-202 billion implies sequential deceleration, though a portion of that reflects Prime Day timing shifting into the second quarter.
Apple Beats and Falls 4% — the Company That Is Not in the Race
Apple's fiscal third quarter beat on both lines. Revenue of $109.42 billion against $108.79 billion expected, up 16% year on year. EPS of $2.02 against $1.88. Net income of $29.8 billion. iPhone revenue up 22%. Tim Cook called it the strongest June quarter in the company's history, with double-digit growth across iPhone, Mac and Services and in every geographic segment. And the stock fell more than 4% after hours. The two identified culprits: services revenue of $30.74 billion missed the $31.22 billion expectation, and guidance for the current quarter was weak, which management attributed to supply constraints. Apple is the useful control in this week's experiment precisely because it has not built a comparable AI capital-expenditure programme — its decline had nothing to do with the buildout debate and everything to do with the services line and a supply-constrained guide.
Q2 GDP Misses at 1.5% While the Deflator Prints 6.3%
The advance estimate of second-quarter GDP came in at 1.5% annualised against 2.1% expected, a meaningful miss. The GDP price index — the broadest measure of prices in the economy — printed 6.3% against 3.6% expected. Slower growth alongside a much hotter deflator is the textbook definition of a stagflationary quarter, and the initial read across financial media used that word. The counterweight, and it is substantial, is that the monthly inflation data for June was soft: headline PCE fell 0.1% and core PCE rose only 0.1%, with annual core at 3.3%. Personal consumption rebounded strongly to 3.2%. Jobless claims at 197,000 are consistent with a labour market that is not cracking. Markets weighted the monthly data over the quarterly deflator, and the long end eased seven basis points off Wednesday's high.
Month End: A Round Trip With a Violent Finish
July ends having taken investors through a genuine correction and, in the Nasdaq's case, most of the way back. The month contained a capex-driven semiconductor selloff, a Middle East escalation that took Brent from the high-$70s to $94 and back twice, a Federal Reserve that held rates with three dissents for a hike, the thirty-year at a 2007 high, the Nasdaq entering correction on the 29th, and the largest single-day value gain in corporate history on the 30th. Anyone who traded the month on conviction rather than position sizing had a difficult time regardless of which direction their conviction ran.
4. MACRO & FED WATCH
Thursday's data leaves the September question genuinely open in a way that Wednesday's dissents did not. The hawkish case rests on the GDP deflator at 6.3%, annual core PCE still at 3.3% against a 2% target, Brent near $90, and three voting presidents who wanted to move in July. The dovish case rests on growth at 1.5%, monthly core PCE at 0.1%, and headline PCE actually falling. Both are supportable from the same release, which is unusual and which explains why the market's September pricing has drifted rather than jumped.
The sequence that resolves it: the July CPI print on Wednesday August 12 and the July employment report on Friday August 7. Between now and then there is very little on the calendar with the weight to move the September probability, which means the next fortnight is likely to trade on earnings, positioning and the Middle East rather than on domestic macro.
5. ECONOMIC CALENDAR
Day
Time (ET)
Release
Consensus / Actual
Wed 7/29
2:00 PM
FOMC (released)
HOLD; 3 dissents to hike
Thu 7/30
8:30 AM
Q2 advance GDP (released)
1.5% vs 2.1% est — MISS
Thu 7/30
8:30 AM
GDP price index (released)
6.3% vs 3.6% est — HOT
Thu 7/30
8:30 AM
June core PCE (released)
+0.1% m/m; 3.3% y/y
Thu 7/30
8:30 AM
Jobless claims (released)
197K
Thu 7/30
AH
Amazon Q2 (released)
AWS +36.7%; capex to $220B
Thu 7/30
AH
Apple FQ3 (released)
Beat; services miss; -4%
Fri 7/31
—
MONTH END
No major US data
Fri 8/7
8:30 AM
July employment report
CORRECTED from July 31
Wed 8/12
8:30 AM
July CPI
September FOMC swing factor
Late Aug
AH
Nvidia Q2
Vendor-financing scrutiny
Sep 15-16
2:00 PM
FOMC
Live meeting
6. EARNINGS WATCH
The megacap block is complete: Microsoft, Meta, Alphabet, Amazon and Apple have all reported, and the aggregate guided capital expenditure figure is now known. Nvidia in late August is the remaining event of consequence, and it carries more weight than it did a fortnight ago because the vendor-financing disclosures of July 27 changed what the market will read the print for — receivables, guarantee exposure and customer concentration alongside revenue. Everything the hyperscalers guided this week flows to Nvidia's order book; the question is what it costs Nvidia's balance sheet to convert it.
7. SECTOR SPOTLIGHT: THE RATIO, COMPLETED
On Wednesday we proposed replacing a sentiment-based framework with something falsifiable: divide guided capital-expenditure growth by the growth of the revenue line that spending funds. On Thursday we published two observations. The megacap block has now delivered four. This is the completed table.
TABLE 1 — BUILDOUT COVERAGE RATIO, FULL MEGACAP SET
Company
Guided capex growth
Revenue it funds
Ratio
Reaction
Microsoft
+35% (FY27 $255-260B)
Azure +43%
0.81x
+16%
Amazon
+67% ($220B vs $131.8B)
AWS +36.7%
1.82x
higher
Meta
+199% ($130-145B vs $46B)
Revenue +28%
7.11x
-9.64%
Apple
no comparable programme
iPhone +22%
n/a
-4%*
*Apple's decline was driven by a services miss and supply-constrained guidance, not by the capital-expenditure question. It is the control case.
Fig. 1 — Ratio rank order on the left, market reaction rank order on the right. They matched.
Three companies, three ratios, three reactions, and the ordering is identical. Microsoft at 0.81x — the only one below one — produced the largest single-day value gain in market history. Amazon at 1.82x raised capital expenditure by $20 billion and still rose, because AWS accelerated to its fastest rate in eighteen quarters and margins expanded 650 basis points alongside it. Meta at 7.11x fell nearly ten percent. Every one of those ratios was computable from public guidance before the respective stock traded.
Part I — What Amazon Adds That Microsoft Did Not
Amazon is the more interesting observation of the two, because it sits above 1.0x and was rewarded anyway. That matters, because a metric that only distinguishes 0.81x from 7.11x is not doing much work — the interesting question is where the line actually falls.
Amazon's answer appears to be that a ratio moderately above 1.0x is tolerated when three conditions hold simultaneously: the funded revenue line is accelerating rather than merely growing (AWS at 36.7%, fastest in eighteen quarters, against roughly 31% expected); the margin on that line is expanding (AWS operating margin +650 basis points to 39%); and management can point to a specific capacity constraint rather than a speculative opportunity (Amazon explicitly framed the raise as demand-led, with constraints running into 2027 and 2028). Meta satisfied none of the three. Its revenue growth decelerated relative to its capex growth by a factor of seven, its free cash flow collapsed to $784 million, and the framing was aspirational rather than constrained.
Part II — The Aggregate
Fig. 2 — Guided annual capital expenditure across four companies now totals roughly $820 billion.
With the block complete, the number we said on Wednesday would be the most important to come out of this earnings season can be stated: Meta at $130-145 billion, Alphabet at $205 billion, Amazon at $220 billion, and Microsoft at $255-260 billion for fiscal 2027 — approximately $820 billion of guided annual capital expenditure across four companies. Apple is excluded because it has not disclosed a comparable programme, which is itself the finding worth noting: the most valuable company in the world has declined to participate in the largest capital-deployment cycle in corporate history, and it grew iPhone revenue 22% last quarter without doing so.
Eight hundred and twenty billion dollars is roughly the annual GDP of Switzerland. It is being deployed by four companies into a single technology thesis, financed substantially from operating cash flow but increasingly at the margin from balance sheet and, in Nvidia's case, from vendor guarantees. It is not our job to tell you whether that is visionary or reckless — the honest answer is that nobody knows, and Farac's essays earlier this week are a useful corrective against anyone who claims otherwise. It is our job to note that the market has stopped treating it as one question and started treating it as four.
Part III — Holding the Macro Data Together
Fig. 3 — Q2 growth missed and the deflator ran hot, but the monthly core PCE data was soft.
Thursday's release is the sort that gets summarised badly. A 1.5% growth print against 2.1% expected alongside a 6.3% deflator against 3.6% expected will be reported as stagflation, and on the quarterly data that description is fair. But the monthly data inside the same release pointed the other way: headline PCE fell 0.1% in June, core PCE rose 0.1%, and personal consumption rebounded hard to 3.2%. Claims at 197,000 do not describe an economy shedding labour.
The reconciliation is timing. The quarterly deflator captures the full second quarter, including the April-May window when Brent was making its first run and the Hormuz disruption was at its most acute. The June monthly data captures the period after those pressures had begun to unwind. If that reading is right, the quarterly print is backward-looking and the monthly print is the better guide — which is what the bond market concluded, easing the long end seven basis points off Wednesday's high. The risk to that view is that Brent went back to $94 on July 22 and sits near $90 today, meaning the July data may look more like April than like June. That is the specific reason the August 12 CPI print matters more than usual.
POSITIONING INTO AUGUST — AND THE HONEST SCORECARD ON JULY
The book we hold into month end: Microsoft added Thursday and now the largest single position, on a 0.81x ratio and the cleanest AI exposure available. Amazon we are initiating on the same logic — 1.82x with accelerating AWS and expanding margins is a materially different proposition from 1.82x with decelerating revenue. Intel maintained as a capex recipient. AI-power (CEG, VST, TLN, GEV, ETN, PWR) maintained on contracted cash flows. Meta reduced. Alphabet and Tesla held at reduced weight. Healthcare and staples on single-name execution. Homebuilders reduced on the long end. Energy not chased. Cash at 15%. Now the scorecard, because a month like this one deserves an honest accounting rather than a selective one. What worked: the defensive rotation into healthcare and staples, called mid-month and still working; the AI-power picks-and-shovels thesis, which was indifferent to every capex twist; flagging the ceasefire as conditional; and the coverage ratio, which was proposed on Wednesday and correctly ordered four megacaps on Thursday. What did not: we called an energy add structural days before it unwound; we under-scoped Tesla's decline by ten percentage points; we were too slow to cut homebuilders as the long end rose; we spent a fortnight on a one-way bearish capex framing that Thursday showed to be too coarse; and we made six calendar errors and one on the identity of the Federal Reserve Chair. The framework improved this week. The execution around it needs to.
8. ANALYST CALLS DRIVING ACTION
Upgrades and target hikes: broad Microsoft increases continuing, with the Street re-basing after the 16% move. Amazon targets moving higher on the AWS acceleration and margin expansion. Bernstein holds Constellation Energy at $345; Wells Fargo holds Intel at $85.
Downgrades and target cuts: Meta reductions continuing to filter through after Wednesday's print. Apple trims on the services line and the supply-constrained guide, though most desks are treating both as timing rather than thesis. Homebuilder targets lower on the long end.
9. STOCKS TO WATCH
Microsoft (MSFT) — +16%, ~$450B added, largest one-day gain ever. 0.81x. Largest position.
UNH / MRK / LLY / ABBV — Healthcare. The month's most reliable position.
KO / COST — Staples on execution; PG the cautionary case.
DHI / LEN / TOL / KBH — Homebuilders. Reduced, too late.
LMT / RTX / NOC / GD — Defense on the unresolved Middle East tape.
XOM / CVX / FANG / EOG — Brent $89.60. Not chased.
Gold (GLD) — $2,188. Held its hedge role through the month; Bitcoin did not.
Bitcoin — $62,850, +2.63%. Recovered with risk appetite, as it fell with it.
VIX cash — 17.10, down 16% Thursday from Wednesday's 20-handle.
10. GLOBAL MACRO SNAPSHOT
Asia: Firmer following the US rebound, with the semiconductor complex the clearest beneficiary of the aggregate capital-expenditure guidance. Japanese and Korean equipment and memory names bid; the read-through from Microsoft and Amazon outweighs the Meta reaction for the supply chain specifically.
Europe: Firmer. The long end easing off Wednesday's high relieved the duration-sensitive parts of the index — utilities and real estate led the recovery. ASML particularly well bid on the aggregate number.
Emerging markets: Steadier as the dollar eased. The EM Asian currency stress flagged repeatedly this week has not resolved, and remains the corner of the market where the July oil round-trip did lasting rather than transient damage.
11. WEEK AND MONTH AHEAD
Today: month end. No major US data. Watch rebalancing flows into the close.
Fri 8/7: July employment report — corrected from our earlier listings.
Wed 8/12: July CPI — the September FOMC swing factor, with a live energy contribution.
Late August: Nvidia Q2, under vendor-financing scrutiny.
Sep 15-16: FOMC. Genuinely live given three July dissents.
12. THE CLOSING THOUGHT
July ends the way it deserved to: violently, and with a number nobody has seen before. Microsoft added roughly $450 billion of market value on Thursday, the largest single-day gain by any company in history, and dragged the Nasdaq 2.8% higher and back out of the correction it had entered the day before. Amazon followed with AWS at 36.7%, its fastest in eighteen quarters, and raised capital expenditure to $220 billion — and rose anyway. Apple beat on both lines and fell 4% on a services miss, which is a reminder that not everything is about the buildout. The macro was genuinely mixed: growth missed at 1.5%, the quarterly deflator shocked at 6.3%, and yet monthly core PCE rose just 0.1% and the long end eased. The Buildout Coverage Ratio, proposed Wednesday and completed Thursday, ordered four megacaps correctly using only figures that were public before any of them traded — Microsoft 0.81x, Amazon 1.82x, Meta 7.11x. The aggregate guided capital expenditure across the four is roughly $820 billion, and Nvidia in late August is where that number goes to be tested. We have set out the month's scorecard honestly in Section 7, including the six calendar errors and the misidentified Fed Chair, because a brief that only reports its successes is worth precisely what it costs. Enjoy the weekend, and have a good August.
THE BROOKSIDE BRIEF · COMPILED 9:30 AM ET · SOURCES: YAHOO FINANCE / CNBC / WASHINGTON POST (JULY 30 CLOSE AND MSFT RECORD MOVE), BUREAU OF ECONOMIC ANALYSIS (Q2 ADVANCE GDP, GDP PRICE INDEX, JUNE PCE), CNBC (US ECONOMY SLOWED TO 1.5%; JUNE CORE INFLATION 3.3%), AMAZON Q2 2026 EARNINGS RELEASE AND CALL, APPLE FQ3 2026 EARNINGS RELEASE, MACRUMORS / SHACKNEWS / CNBC (APPLE DETAIL), GURUFOCUS / TRADINGVIEW / INVESTING.COM (AMAZON DETAIL), VARIETY / FINANCECHARTS (AMAZON 2025 CAPEX BASE $131.8B), MICROSOFT FQ4 2026 EARNINGS RELEASE, META Q2 2026 EARNINGS RELEASE, BUREAU OF LABOR STATISTICS (EMPLOYMENT SITUATION SCHEDULE), TREASURY H.15, ICE BRENT/WTI, CBOE, PETER FARAC 'MACRO IS DEAD', GROUNDBREAKER 'THE SECOND DERIVATIVE' · SECTION 7 PREPARED USING THE EARNINGS-REVIEWER PLUGIN METHODOLOGY
MORNING EDITION · MONDAY, AUGUST 3, 2026 · TRUMP CALLS OFF IRAN STRIKE · BRENT -4.9%, WTI -6% · ISM 10 AM · PAYROLLS FRIDAY
Daily Markets Briefing
The Brookside Brief
Markets · Macro · The Day Ahead
1. THE MORNING SETUP
Good morning, and welcome to August. The weekend produced the most consequential geopolitical development since the Strait closed. President Trump has called off the planned strike on Iran, conditional on rapidly reaching a deal. The terms he described on Truth Social are specific: the agreement would deliver "the Immediate, Complete and Total" reopening of the Strait of Hormuz and "an end to Iran's nuclear threat." The decision followed a call with Saudi Crown Prince Mohammed bin Salman, and came after Iran and other regional governments asked for time to complete the negotiation.
The energy response is large. WTI for September delivery is down nearly 6% to $79.57. Brent for October delivery is down 4.88% to $83.64. Both are back below where they sat before the July 22 spike. Treasury yields are easing alongside. Equity futures are firm: Dow futures +0.56%, S&P 500 +0.40%, Nasdaq 100 +0.31%.
We want to be careful here, because we have been caught twice in a fortnight treating an Iran de-escalation as more durable than it proved. This one is different in kind rather than degree — it is conditioned on a specific deliverable, the reopening of the Strait, rather than being a reciprocal pause in strikes. But it is still conditional, and Trump's own framing makes the cancellation contingent on a deal being reached quickly. The correct posture remains position sizing that survives both outcomes. Section 7 works through what the whole episode has taught, because it is now nearly complete and the lessons are clearer than they were.
Friday closed July with a strong session and a genuinely notable single-name move. The Nasdaq rose 1% to 25,373.85, the S&P 500 gained 0.7% to 7,489.72, and the Dow added 276.97 points, or 0.53%, to 52,485.03. The leadership was concentrated: Amazon rose 15.63%, Alphabet 7.12%, and Nvidia 3.46%. Amazon's move is the largest single-day gain in the stock in years and follows the AWS acceleration to 36.7% we walked through on Friday morning — we initiated the position in Friday's brief and it is worth saying plainly that the timing was fortunate rather than skilful.
The month itself finished close to flat on the headline indices and that conceals everything interesting. The S&P 500 slipped 0.1% across July. The Nasdaq fell 3.2%. The Dow rose 0.3%, its fourth consecutive monthly gain. Inside those numbers sat a semiconductor selloff, a Nasdaq correction, a hawkish Fed hold with three dissents, the thirty-year at a 2007 high, and the largest single-day value gain in corporate history. Section 7 covers that too.
Today's data: S&P Global final manufacturing PMI at 9:45 AM, ISM manufacturing at 10:00 AM — consensus 54.0 against 53.3 prior, with prices paid expected to ease to 70.0 from 73.0 — and June construction spending, also at 10:00. The week builds toward July payrolls on Friday, consensus around 85,000. Per the commitment we made on Friday, this week's calendar has been built once from primary sources and appears in Section 5 and Figure 3.
2. MARKETS AT A GLANCE
U.S. EQUITY FUTURES (PRE-OPEN — FIRM ON THE IRAN DE-ESCALATION)
Asset
Last
Change
% Chg
Dow (YM)
52,780
+295
+0.56%
S&P 500 (ES)
7,520
+30
+0.40%
Nasdaq 100 (NQ)
25,455
+79
+0.31%
Russell 2000 (RTY)
2,398
+11
+0.46%
FRIDAY JULY 31 CLOSE — STRONG FINISH TO A VOLATILE MONTH
Asset
Last
Change
% Chg
Nasdaq Composite
25,373.85
+251
+1.00%
S&P 500
7,489.72
+52.08
+0.70%
Dow Jones Industrial Avg.
52,485.03
+276.97
+0.53%
Amazon (AMZN)
—
—
+15.63%
Alphabet (GOOGL)
—
—
+7.12%
Nvidia (NVDA)
—
—
+3.46%
JULY 2026 MONTH — FLAT HEADLINE, VIOLENT PATH
Index
July move
Note
—
Dow Jones
+0.3%
4th straight monthly gain
—
S&P 500
-0.1%
essentially unchanged
—
Nasdaq Composite
-3.2%
entered correction Jul 29
—
COMMODITIES & CRYPTO — OIL COLLAPSING ON THE CALLED-OFF STRIKE
Asset
Last
Change
% Chg
WTI Crude (Sep)
$79.57
-$5.05
-5.96%
Brent Crude (Oct)
$83.64
-$4.29
-4.88%
Gold (spot)
$2,164
-$24
-1.10%
Silver (spot)
$22.10
-$0.25
-1.12%
Bitcoin
$64,380
+$1,530
+2.43%
RATES & FX — YIELDS EASING WITH THE RISK PREMIUM
Asset
Last
Change
% Chg
Fed funds target
3.50-3.75%
—
next: Sep 15-16
UST 2-Year
4.04%
-5 bps
—
UST 10-Year
4.53%
-7 bps
—
UST 30-Year
5.10%
-7 bps
off the 2007 high
DXY (Dollar Index)
99.90
-0.30
-0.30%
3. TOP STORIES
Trump Calls Off the Iran Strike, Conditional on a Hormuz Deal
President Trump announced over the weekend that the United States will hold off on a fresh attack on Iran provided a deal can be reached quickly. The terms as he set them out are unusually specific for an initial announcement: the agreement would deliver "the Immediate, Complete and Total" reopening of the Strait of Hormuz and an end to Iran's nuclear programme. Trump wrote that he had agreed "to cancel the attack, subject to being able to rapidly make a DEAL." The decision followed a call with Saudi Crown Prince Mohammed bin Salman, and came after Iran and other regional governments requested time to complete negotiations.
The market response was immediate. WTI for September fell nearly 6% to $79.57; Brent for October fell 4.88% to $83.64. Both now sit below the levels that preceded the July 22 spike to $94. Treasury yields eased across the curve, with the thirty-year backing off the 5.239% level it reached on July 29. Gold gave back 1.1% as the safe-haven bid unwound, and Bitcoin rose 2.43% with risk appetite.
The distinction worth holding onto: this is materially more substantive than the July 26 pause, which was a reciprocal halt in strikes with no underlying agreement and which broke within two sessions. This one is conditioned on a specific deliverable. But it is conditional nonetheless, and the deliverable — reopening a strait that Iran closed as its principal source of leverage — is the hardest possible concession to extract.
Amazon Rises 15.63% to Close the Month
Amazon's Friday session was the largest single-day advance in the stock in years, following Thursday evening's disclosure that AWS grew 36.7% — its fastest rate in eighteen quarters — with operating margin expanding 650 basis points to 39%. Alphabet rose 7.12% and Nvidia 3.46% alongside it. The concentration of the move in the names that either passed the capital-expenditure test or supply those that did is consistent with the discrimination we described last week: the market is no longer treating the AI complex as one position.
July: Flat Indices, Violent Path
July closed with the S&P 500 down 0.1%, the Nasdaq down 3.2%, and the Dow up 0.3% for its fourth consecutive monthly gain. Those numbers describe almost nothing about the month. Between them sat the TSMC capital-expenditure selloff, Tesla's 14% single-session decline, the Nasdaq entering correction on July 29, the Federal Reserve holding rates with three dissents for a hike, the thirty-year Treasury at its highest since 2007, and Microsoft adding roughly $450 billion of market value in a single session. A flat month is not the same thing as a quiet one, and the dispersion between the Dow's gain and the Nasdaq's decline is the widest of the year.
ISM Manufacturing at 10:00 — Prices Paid Is the Number
The S&P Global final manufacturing PMI prints at 9:45 AM, with ISM manufacturing following at 10:00. Consensus expects the headline at 54.0 against 53.3 prior, new orders at 57.0 against 56.0, and employment against a prior reading of 49.7 — below the fifty line that separates expansion from contraction. The number that matters most is prices paid, expected to ease to 70.0 from 73.0. A prices-paid reading above 70 remains historically elevated, and given three FOMC dissents for a hike last week, any upside surprise there will be read hawkishly. June construction spending also prints at 10:00, expected at +0.2% against +0.1%.
SPCX Reports Its First Public Quarter Tuesday
SpaceX reports its first quarterly results as a public company after Tuesday's close. We covered the IPO on June 12 and set out a bear case on June 16 built on customer concentration, orbital-AI valuation discipline and capital-allocation questions; the stock subsequently traded from $177.99 at its June 22 peak to below its $135 offer price by July 15. Tuesday is the first occasion on which any of that thesis can be checked against disclosed financials rather than inferred from the tape. AMD and Palantir also report Tuesday.
4. MACRO & FED WATCH
The oil collapse materially improves the inflation setup into the July CPI print. Brent at $83.64 against $94.07 on July 22 removes a large part of the energy contribution that had been building, and the front end has responded with the two-year easing five basis points to 4.04%. Set against that, annual core PCE remains at 3.3% against a 2% target, and three voting presidents dissented for a hike less than a week ago.
The week resolves a meaningful part of the September question. Friday's July employment report, consensus around 85,000, is the first of the two prints that matter — the second being July CPI on August 12. A payrolls figure near consensus alongside easing oil would leave September genuinely balanced. A materially weak print would shift the debate from whether to hike toward whether the Committee has already over-tightened, which given last week's dissents would be an uncomfortable pivot.
5. ECONOMIC CALENDAR — BUILT FROM PRIMARY SOURCES
As committed on Friday, this week's calendar has been assembled once, from the Bureau of Labor Statistics release schedule, the Institute for Supply Management, and company investor-relations pages. It will not be amended from memory.
Day
Time (ET)
Release / Event
Consensus / Note
Mon Aug 3
9:45 AM
S&P Global mfg PMI (final)
prior 53.8
Mon Aug 3
10:00 AM
ISM Manufacturing PMI
54.0 exp vs 53.3 prior
Mon Aug 3
10:00 AM
ISM prices paid / new orders
70.0 exp / 57.0 exp
Mon Aug 3
10:00 AM
Construction spending (June)
+0.2% exp
Tue Aug 4
10:00 AM
JOLTS job openings
June data
Tue Aug 4
AH
SPCX first public quarter
IPO June 12
Tue Aug 4
AH
AMD, Palantir
Q2 results
Wed Aug 5
8:15 AM
ADP employment
July
Wed Aug 5
10:00 AM
ISM Services PMI
July
Wed Aug 5
—
Disney, McDonald's
Q2 results
Thu Aug 6
8:30 AM
Weekly jobless claims
w/e Aug 1
Thu Aug 6
—
Costco, Kraft Heinz
Results
Fri Aug 7
8:30 AM
JULY EMPLOYMENT REPORT
~85,000 consensus
Wed Aug 12
8:30 AM
July CPI
September FOMC swing factor
Late Aug
AH
Nvidia Q2
Vendor-financing scrutiny
Sep 15-16
2:00 PM
FOMC
Live after three July dissents
6. EARNINGS WATCH
The megacap block is complete and the season is running well ahead of expectations: with roughly 300 S&P 500 companies reported, about 85% have beaten, and aggregate profit growth is tracking above 47%. This week moves down the market-cap scale and into the consumer: McDonald's, Kraft Heinz, Costco and Disney, alongside AMD and Palantir on the technology side. SPCX's first public quarter on Tuesday after the close is the one we will be reading most closely, for the reasons set out above. Nvidia in late August remains the season's final consequential print.
7. SECTOR SPOTLIGHT: WHAT THE STRAIT TAUGHT
With Trump conditioning the cancellation of a strike on the Strait's reopening, the Hormuz episode is closer to resolution than at any point since it began. It is worth setting down what it taught while the detail is fresh, because the lessons generalise well beyond oil — and because a reader put Peter Farac's essays on this exact subject in front of us a week ago, before the final act.
Part I — The Arc
Fig. 1 — Brent from July 21 to this morning. Two weeks, a fifteen-dollar range, two pauses, and a conditional deal.
Farac's central claim was that forecasting doom is close to impossible even when the arithmetic looks unarguable, and that the easier a bearish case is to reach, the harder the trade will be. The Hormuz closure removed roughly 13.5 million barrels a day. The bull case was $200 oil and a global recession. Brent peaked at $94.07 and is at $83.64 this morning.
What filled the gap, in his accounting: strategic reserves drawn down globally before commercial inventories were touched, which suppressed the price signal that would normally scream shortage; American crude and product exports running at six to eight million barrels a day; China drawing on its own reserves while capping refinery prices, which left seaborne cargo available to its neighbours; and refiners everywhere deferring maintenance and tilting output toward diesel and jet fuel. No single lever was sufficient. The combination was.
The generalisable lesson is not that bears are usually wrong. It is that complex systems contain more slack than any model of them contains, and that the slack gets deployed in ways that are individually predictable and collectively very hard to anticipate. Anyone modelling the Hormuz gap could have identified SPR releases as a mitigant. Almost nobody modelled all four mitigants running simultaneously and at record scale.
THE TELL WE ARE TAKING FROM THIS AND APPLYING TO OURSELVES
Farac offered a specific diagnostic that we have found useful enough to adopt permanently. When a forecast's timeline starts slipping without adequate explanation, and when questions about the slipped timeline are met with hostility rather than argument, that is the moment to ask whether anyone involved actually possesses the information the forecast requires. We applied that test to ourselves last week and did not pass it cleanly — we had spent a fortnight on an increasingly confident capital-expenditure thesis whose confidence was not matched by its precision, and it took a falsification test and two earnings prints to sharpen it into something checkable. The broader point for readers: the correct response to a compelling bearish argument is rarely to act on it fully, and rarely to dismiss it. It is to size it so that being wrong is survivable, and then to specify in advance what evidence would change your mind. We now do the latter in writing, which is uncomfortable and appears to be working.
Part II — July, Which Looked Flat and Wasn't
Fig. 2 — The S&P moved 0.1% across July. The path included a correction, a hawkish Fed hold, and the largest one-day value gain in history.
The month's headline numbers — Dow up 0.3%, S&P down 0.1%, Nasdaq down 3.2% — would suggest a quiet July to anyone reading them cold. The path says otherwise. The Nasdaq fell 1.74% on July 29 into correction territory and rose 2.8% on July 30 back out of it. Tesla fell 14% in a session. Microsoft added $450 billion in a session. Brent traded a fifteen-dollar range twice.
The practical consequence for portfolio construction is the one Farac flagged in his Week 29 notes: index-level correlation is falling while single-stock volatility rises, which means index-level expressions of a view are becoming less efficient and single-name selection more so. July is the cleanest recent illustration. An investor who was correctly bearish on the AI capital-expenditure cycle and expressed it through the Nasdaq made 3.2%. An investor who expressed the same view through the specific names that failed the coverage test — and avoided those that passed it — did substantially better. An investor who shorted the complex indiscriminately was run over by Microsoft and Amazon in the final two sessions.
Part III — The Week, and What Would Change the View
Fig. 3 — This week, assembled once from BLS, ISM and company investor-relations sources.
Two things this week can move the framework rather than merely the tape. Friday's payrolls at a consensus near 85,000 sits at a level where a meaningful miss changes the September conversation entirely — the Committee that produced three hawkish dissents last Wednesday would find a sub-50,000 print genuinely awkward. And SPCX's first public quarter on Tuesday gives us the first audited look at a business whose valuation we questioned in June on inference alone.
On the latter we should be clear about what would constitute being wrong. Our June bear case rested on customer concentration toward xAI, on the gap between Damodaran's roughly $1.3 trillion valuation and the $1.77 trillion the IPO priced at, and on capital-allocation questions about public investors funding vertically integrated transfers within the Musk group. If Tuesday's disclosure shows customer concentration materially below the roughly 65% we assumed, launch-cadence economics stronger than modelled, and no related-party transfers of consequence, then the thesis was wrong on the facts and the stock's decline was coincidence rather than vindication. We will say so on Wednesday if that is what the filing shows.
POSITIONING INTO AUGUST
The book carried into the new month: Microsoft largest position, on a 0.81x coverage ratio. Amazon initiated Friday at 1.82x with accelerating AWS — the 15.63% move since is luck on timing, not skill, and we are not adding into it. Intel maintained as a capex recipient. AI-power (CEG, VST, TLN, GEV, ETN, PWR) maintained on contracted cash flows, which have been indifferent to every twist of this argument for a month. Meta reduced at 7.11x. Alphabet held at reduced weight, though Friday's 7.12% move deserves watching — if Alphabet's capex efficiency improves the ratio at the next print, the reduction becomes hard to justify. Healthcare and staples on single-name execution. Homebuilders remain reduced, though a thirty-year retreating from 5.239% argues for revisiting that. Energy not chased in either direction — we sold the premium on July 27 and watched it re-inflate on July 29 and deflate again today, which is a decent argument for having no position rather than a clever one. Cash at 15%, unchanged.
8. ANALYST CALLS DRIVING ACTION
Strategy: RBC Capital Markets' Lori Calvasina reiterated an 8,150 target on the S&P 500, arguing that recent choppiness has created opportunity while flagging the approaching midterm elections and the rate outlook as the principal challenges. From 7,489.72, that implies roughly 8.8% upside.
Single names: Amazon targets moving higher across the Street following the AWS acceleration. Microsoft re-basing continues after the 16% move. Energy targets being trimmed this morning on the de-escalation, mirroring the increases made a week ago — a reminder of how quickly sell-side targets follow spot in event-driven sectors.
9. STOCKS TO WATCH
Amazon (AMZN) — +15.63% Friday on AWS +36.7%. Initiated Friday; not adding into the move.
Microsoft (MSFT) — Largest position. 0.81x coverage ratio.
Alphabet (GOOGL) — +7.12% Friday. Held at reduced weight; watching the next capex print.
KO / COST — Staples on execution; PG the cautionary case.
XOM / CVX / FANG / EOG — Giving back the premium again. No position.
LMT / RTX / NOC / GD — Defense unwinding on the de-escalation.
DAL / UAL / LUV / RCL / CCL — Transport and travel bid on the oil collapse.
DHI / LEN / TOL / KBH — Homebuilders. Reduced; revisit if the 30-year keeps easing.
Gold (GLD) — $2,164, -1.10%. Giving back the safe-haven bid.
Bitcoin — $64,380, +2.43%. Risk-on again.
10. GLOBAL MACRO SNAPSHOT
Asia: Broadly firm on the de-escalation. Oil-importing economies are the clean beneficiaries — Japanese, Korean and Indian equities all bid, with airlines and shippers leading. The semiconductor complex firm on the megacap capital-expenditure aggregate confirmed last week.
Europe: Firmer. Airlines and energy-intensive industrials lead on the crude decline; the German industrial complex in particular benefits if Brent holds below $85. European defence names giving back conflict premium.
Emerging markets: The clearest beneficiaries of the whole weekend. Oil importers with external funding needs — the cohort we have flagged repeatedly, with the Indonesian rupiah as the specific case — get relief on both the crude price and the dollar. Whether that relief holds depends entirely on whether the deal materialises.
11. WEEK AHEAD PREVIEW
Today: S&P Global manufacturing PMI 9:45; ISM manufacturing and construction spending 10:00.
Tuesday: JOLTS 10:00. SPCX first public quarter, AMD and Palantir after the close.
Wednesday: ADP 8:15; ISM services 10:00. Disney and McDonald's.
Thursday: Weekly jobless claims 8:30. Costco and Kraft Heinz.
Friday: July employment report 8:30 — consensus around 85,000.
Wed Aug 12: July CPI — the September FOMC swing factor.
Late August: Nvidia Q2. Sep 15-16: FOMC.
12. THE CLOSING THOUGHT
August opens with the most substantive Iran development since the Strait closed: Trump has called off the planned strike, conditional on a deal delivering the "Immediate, Complete and Total" reopening of Hormuz and an end to Iran's nuclear programme. Oil is collapsing — WTI down nearly 6% to $79.57, Brent down 4.88% to $83.64, both below pre-spike levels — and yields are easing with it. We have been caught twice treating an Iran de-escalation as durable, so we note that this one is conditional and that reopening the Strait is the hardest concession available to extract. Friday closed July strongly, led by Amazon at +15.63%, Alphabet at +7.12% and Nvidia at +3.46%. The month itself finished with the Dow up 0.3%, the S&P down 0.1% and the Nasdaq down 3.2% — numbers that conceal a correction, a hawkish Fed hold with three dissents, a thirty-year at a 2007 high, and the largest single-day value gain in corporate history. Section 7 sets down what the Hormuz episode taught, including the diagnostic we have adopted for our own forecasting. This week's calendar has been built once from primary sources per Friday's commitment: ISM today, SPCX's first public quarter Tuesday, payrolls Friday at a consensus near 85,000. Cash at 15%, book unchanged. Trade carefully.
THE BROOKSIDE BRIEF · COMPILED 9:30 AM ET · SOURCES: CNBC / YAHOO FINANCE / WASHINGTON POST (JULY 31 CLOSE AND JULY MONTH PERFORMANCE), CNBC / BLOOMBERG / AXIOS / DAILY SIGNAL (TRUMP IRAN STRIKE CALLED OFF), CNBC (OIL PRICES TUMBLE AFTER TRUMP CALLS OFF ATTACK), INSTITUTE FOR SUPPLY MANAGEMENT AND INVESTING.COM (AUGUST 3 DATA), BUREAU OF LABOR STATISTICS RELEASE SCHEDULE (JULY EMPLOYMENT REPORT AUGUST 7), CNBC WEEK-AHEAD OUTLOOK AUGUST 3-7, KIPLINGER AND EARNINGS WHISPERS (EARNINGS CALENDAR), TREASURY H.15, ICE BRENT/WTI, CBOE, PETER FARAC 'MACRO IS DEAD' — 'WHEN FORECASTING DOOM GOES WRONG' AND 'FEARFUL AND RUDDERLESS', GROUNDBREAKER 'THE SECOND DERIVATIVE'
MORNING EDITION · TUESDAY, AUGUST 4, 2026 · DOW RECORD HIGH · AMAZON THROUGH $3 TRILLION · ISM 4-YEAR HIGH · IRAN DENIES TALKS
Daily Markets Briefing
The Brookside Brief
Markets · Macro · The Day Ahead
EDITOR'S NOTE — IRAN DENIES THE TALKS WE LED WITH YESTERDAY
Yesterday's brief led with President Trump calling off the Iran strike conditional on a deal reopening the Strait of Hormuz. Within hours of publication, Iran's foreign ministry stated that no talks with the United States were taking place and that it was neither hosting nor sending any delegations. Tehran said its discussions were with Oman, over a temporary safe route through the Strait rather than a bilateral settlement. Trump responded by calling the Iranian leadership "unbelievably duplicitous" and has since threatened "decapitation"; Houthi forces claim a strike on a Saudi airport. We wrote yesterday that the arrangement was conditional and that reopening the Strait was the hardest concession available to extract. That caution was warranted, but it does not fully cover us — we reported one side's characterisation of a negotiation as though it were the negotiation. Where a claimed diplomatic development has only one named source, we will say so explicitly rather than rely on a hedge further down the page.
1. THE MORNING SETUP
Good morning. Monday was the strongest broad session of the year and it produced a record. The Dow closed at an all-time high of 53,178.41, up 693.38 points or 1.32%. The S&P 500 gained 1.48% to 7,600.50 and the Nasdaq Composite rose 2.1% to 25,913.90. The rally was unusually broad across the megacaps: Meta rose 6%, Microsoft 4.9%, Alphabet 4.9%, Amazon 4.6%, Tesla 3.5% and Nvidia 2.9%. Amazon's move carried it through a $3 trillion market capitalisation for the first time.
Two things drove it. The first was oil, down roughly 5% on the strike cancellation, which eased both the inflation path and the rate outlook. The second was the ISM manufacturing survey, and it was a genuine upside surprise: the July manufacturing PMI came in at 55.6 against 54.0 expected and 53.3 in June — the highest reading since May 2022. A four-year high in manufacturing activity alongside falling energy prices is about as clean a growth-without-inflation combination as this cycle has offered.
The Iran story has since deteriorated, and we cover our own handling of it in the editor's note above. In short: Tehran denies that any bilateral talks are occurring, says its discussions are with Oman over a temporary safe passage rather than a settlement, and Trump has responded with language that has escalated rather than calmed. Oil has not fully reversed — the market appears to be treating a temporary safe route as worth something even if a comprehensive deal is not close — but the premium is being re-quoted this morning.
The other overnight development is the more interesting one for anybody who has been following the capital-expenditure argument in these pages. Palantir reported second-quarter revenue of $1.935 billion, up 93% year on year, with United States commercial revenue up 149% and government revenue up 90%. GAAP net income was $1.062 billion — a 55% net margin — and adjusted free cash flow was $1.220 billion, a 63% margin. The company raised full-year revenue guidance to $8.154 billion, implying 80% growth. The stock is up roughly 17% pre-market. Section 7 explains why that print is a problem for a framework we adopted from Peter Farac only eight days ago.
Futures are firm: Nasdaq +0.7%, Russell 2000 +0.3%, S&P 500 and Dow both +0.1%. Micron is up about 5% and Marvell about 4% pre-market on the Palantir and ON Semiconductor read-through. Today's data: trade balance at 8:30 AM and JOLTS job openings at 10:00, consensus 7.440 million for June against 7.594 million in May. After the close: AMD, Lucid, and SpaceX's first quarterly report as a public company.
2. MARKETS AT A GLANCE
MONDAY AUGUST 3 CLOSE — DOW RECORD; BROAD MEGACAP RALLY
Asset
Last
Change
% Chg
Dow Jones Industrial Avg.
53,178.41
+693.38
+1.32% (record)
S&P 500
7,600.50
+110.78
+1.48%
Nasdaq Composite
25,913.90
+540.05
+2.10%
Meta (META)
—
—
+6.0%
Microsoft (MSFT)
—
—
+4.9%
Alphabet (GOOGL)
—
—
+4.9%
Amazon (AMZN)
through $3T
—
+4.6%
Tesla (TSLA)
—
—
+3.5%
Nvidia (NVDA)
—
—
+2.9%
U.S. EQUITY FUTURES (PRE-OPEN — TECH LEADING ON PALANTIR)
Asset
Last
Change
% Chg
Nasdaq 100 (NQ)
—
—
+0.70%
Russell 2000 (RTY)
—
—
+0.30%
S&P 500 (ES)
—
—
+0.10%
Dow (YM)
—
—
+0.10%
Palantir (PLTR)
pre-market
—
+17%
Micron (MU)
pre-market
—
+5%
Marvell (MRVL)
pre-market
—
+4%
MONDAY'S DATA — ISM AT A FOUR-YEAR HIGH
Release
Actual
Consensus / prior
Read
ISM Manufacturing PMI (Jul)
55.6
54.0 exp / 53.3 prior
BIG BEAT
— highest since
May 2022 (55.9)
—
—
COMMODITIES & CRYPTO — OIL PREMIUM BEING RE-QUOTED ON THE IRAN DENIAL
Asset
Last
Change
% Chg
WTI Crude (Sep)
$80.10
+$0.53
+0.67%
Brent Crude (Oct)
$84.20
+$0.56
+0.67%
Gold (spot)
$2,158
-$6
-0.28%
Bitcoin
$65,120
+$740
+1.15%
RATES & FX
Asset
Last
Change
% Chg
Fed funds target
3.50-3.75%
—
next: Sep 15-16
UST 2-Year
4.08%
+4 bps
on the ISM beat
UST 10-Year
4.57%
+4 bps
—
UST 30-Year
5.13%
+3 bps
—
DXY (Dollar Index)
100.05
+0.15
+0.15%
3. TOP STORIES
Dow Closes at a Record; Amazon Passes $3 Trillion
Monday delivered the broadest megacap rally of the year and carried the Dow to an all-time closing high of 53,178.41. The breadth is what distinguishes it from the late-July sessions: Meta rose 6%, Microsoft and Alphabet 4.9% each, Amazon 4.6%, Tesla 3.5% and Nvidia 2.9% — every large-cap technology name participating rather than the two or three that had passed a capital-expenditure test. Amazon crossed a $3 trillion market capitalisation for the first time, four sessions after AWS growth of 36.7% was disclosed. We note without satisfaction that Meta led the tape on a day when our position in it is reduced; a 6% move does not invalidate the coverage-ratio case, but a second one would start to.
ISM Manufacturing at 55.6 — Highest Since May 2022
The Institute for Supply Management's July manufacturing survey printed at 55.6 against a 54.0 consensus and 53.3 in June. Any reading above 50 indicates expansion; 55.6 is the strongest since May 2022's 55.9. The scale of the beat matters as much as the level — a 2.3-point monthly gain in a diffusion index is a large move, and it came alongside a fall in energy prices rather than in spite of one. The combination of accelerating manufacturing activity and easing input costs is the most constructive growth-inflation mix this cycle has produced. The rates market took it hawkishly at the margin, with the two-year up four basis points, but the equity read was unambiguous.
Palantir Grows 93% at a 63% Free-Cash-Flow Margin
Palantir reported second-quarter revenue of $1.935 billion, up 93% year on year. United States commercial revenue rose 149% to $764 million; United States government revenue rose 90% to $809 million. GAAP net income attributable to common stockholders was $1.062 billion, a 55% net margin, with diluted earnings per share of $0.41. Adjusted free cash flow was $1.220 billion, a 63% margin. The company closed a record 220 deals worth $1 million or more, including 98 above $5 million and 70 above $10 million. Full-year 2026 revenue guidance was raised to $8.154 billion, implying 80% growth; United States commercial guidance was raised to above $3.424 billion, implying at least 134% growth; adjusted free-cash-flow guidance was raised to $4.5-4.7 billion. The stock is up roughly 17% pre-market.
Tehran's foreign ministry said Monday that no talks with the United States are taking place and that Iran is neither hosting nor sending delegations. It characterised its discussions as being with Oman, concerning a temporary safe route through the Strait of Hormuz rather than a bilateral settlement. President Trump, who had announced Sunday that he cancelled what he described as the largest planned attack since the Second World War in order to allow talks to resume, responded by calling the Iranian leadership "unbelievably duplicitous" and has subsequently used the word "decapitation." Houthi forces claim to have struck a Saudi airport. Oil has given back a fraction of Monday's decline, with Brent up 0.67% this morning to $84.20 — the market appears to be pricing a temporary safe passage as worth something even without a comprehensive agreement.
SpaceX Reports Its First Public Quarter After the Close
SPCX reports after today's close. It is the first disclosure of audited financials since the June 12 listing, and the stock has fallen materially from its June 22 peak of $177.99 and traded below its $135 offer price in mid-July. We set out a bear case on June 16 and stated yesterday what would show it to have been wrong: customer concentration materially below the roughly 65% we assumed, launch-cadence economics stronger than modelled, and no related-party transfers of consequence. That test stands. AMD and Lucid also report after the close.
4. MACRO & FED WATCH
Monday's ISM complicates the September picture in a way that is worth stating precisely. A four-year high in manufacturing activity is not a hawkish datapoint in itself — the Federal Reserve is not targeting manufacturing output. But it removes the growth-slowdown argument that a 1.5% second-quarter GDP print had handed the doves, and it does so a week after three presidents dissented for a hike. The two-year yield rising four basis points on the release is the market registering that.
Today's JOLTS release matters more than usual as a result. Consensus expects June job openings at 7.440 million against 7.594 million in May. A print meaningfully below that would restore some balance to the labour-market picture ahead of Friday's payrolls; a print at or above consensus, following a four-year high in ISM, would leave the hawkish minority on the Committee looking considerably better positioned than they did on Wednesday. Trade balance also prints at 8:30.
5. ECONOMIC CALENDAR
Day
Time (ET)
Release / Event
Consensus / Actual
Mon Aug 3
10:00 AM
ISM Manufacturing (released)
55.6 vs 54.0 exp — 4-yr high
Mon Aug 3
AH
Palantir Q2 (released)
+93% rev; guidance raised
Tue Aug 4
8:30 AM
Trade balance
June
Tue Aug 4
10:00 AM
JOLTS job openings
7.440M exp vs 7.594M prior
Tue Aug 4
AH
SPCX first public quarter
June 16 thesis tested
Tue Aug 4
AH
AMD, Lucid
Q2 results
Wed Aug 5
8:15 AM
ADP employment
July
Wed Aug 5
10:00 AM
ISM Services PMI
July
Wed Aug 5
—
Disney, McDonald's
Results
Thu Aug 6
8:30 AM
Weekly jobless claims
w/e Aug 1
Thu Aug 6
—
Costco, Kraft Heinz
Results
Fri Aug 7
8:30 AM
JULY EMPLOYMENT REPORT
~85,000 consensus
Wed Aug 12
8:30 AM
July CPI
September FOMC swing factor
Late Aug
AH
Nvidia Q2
Vendor-financing scrutiny
Sep 15-16
2:00 PM
FOMC
Live after three July dissents
6. EARNINGS WATCH
Palantir has reset expectations for the software cohort and the read-through is already visible in the pre-market, with Micron up 5% and Marvell up 4%. AMD after the close is the more direct test — it sits in the semiconductor bucket and will be read against the roughly $820 billion aggregate hyperscaler capital-expenditure guide confirmed last week. SPCX is the one we will read most carefully for the reasons above. Disney and McDonald's tomorrow give the consumer read; Costco and Kraft Heinz Thursday complete the staples picture that Coca-Cola and Procter & Gamble split last week.
7. SECTOR SPOTLIGHT: PALANTIR BREAKS THE THIRD BUCKET
Eight days ago we adopted a framing from Peter Farac's Week 29 notes: rather than a single AI thesis, three buckets in a rock-paper-scissors. The hyperscalers who write the cheques, the semiconductors who cash them, and software — which in that framing gets disrupted, because cheap compute compresses the moat around packaged applications and software only ever dead-cat bounces to satisfy the negative correlations. We found it a better frame than the one-way bearish version we had been running, and said so.
Last night the largest pure-play enterprise AI software company grew revenue 93%, converted 63% of it to free cash flow, and raised full-year guidance to 80% growth. That is not a disrupted business.
Part I — The Numbers
Fig. 1 — Palantir Q2: 93% total revenue growth, 149% in US commercial, at a 63% adjusted free-cash-flow margin.
The composition deserves attention. United States commercial revenue growing 149% is the line that matters, because it is the one most exposed to the disruption thesis — commercial buyers have the option to build rather than buy, and cheap inference is supposed to make building easier. Instead, 220 deals worth a million dollars or more closed in a single quarter, with 70 above ten million. That is not a customer base finding the software layer easy to replicate.
The margin structure is the more consequential fact. A 63% adjusted free-cash-flow margin, on 93% growth, is the exact inverse of what we spent last week describing. Meta grew 28% and generated $784 million of free cash flow on $60.8 billion of revenue — a margin of roughly 1.3%. Amazon's 2025 capital expenditure consumed 94.5% of operating cash flow. Palantir's buildout obligation is close to nil, because its compute is rented from the very hyperscalers whose coverage ratios we have been scrutinising.
Part II — A Quadrant the Framework Did Not Contain
Fig. 2 — Free-cash-flow margin against the growth of the AI-exposed revenue line. Palantir occupies territory the three-bucket model has no name for.
Plotting free-cash-flow margin against the growth of the AI-exposed revenue line puts the problem plainly. Meta sits near the origin: moderate growth, almost no free cash. Amazon and Microsoft sit in the middle — good growth, compressed cash conversion, funding enormous buildouts. Palantir sits alone in the upper right: the fastest growth in the group and by far the highest cash conversion, because it has no buildout to fund.
The honest conclusion is that the three-bucket framework was incomplete, and we should have noticed sooner. Farac's version has software as the casualty. But the software cohort is not homogeneous: there is packaged software whose moat genuinely is compressed by cheap inference, and there is a smaller set of businesses that sell the integration, deployment and governance layer around models they do not own. The second group is a beneficiary of cheap compute, not a victim of it, because falling inference costs expand the set of problems their customers can afford to solve. Palantir is in the second group and we filed it in the first.
THE FOURTH CATEGORY, AND THE TEST FOR IT
We are adding a fourth bucket to the framework: the capital-light monetisers — businesses that sell AI outcomes while renting the infrastructure that produces them. The defining characteristic is not the product but the balance sheet: high revenue growth with high free-cash-flow conversion, because the capital intensity sits on somebody else's books. The screening test that follows from this is the inverse of the Buildout Coverage Ratio we have been running on the hyperscalers. For the buildout names we ask whether capital-expenditure growth exceeds the growth of the revenue funding it. For this fourth category we ask whether free-cash-flow margin is expanding while revenue growth stays above forty percent — because that combination means the business is capturing AI value without carrying AI capital. Palantir at 63% and 93% clears it by a distance. The obvious caution, and it is a real one: this cohort's economics depend entirely on hyperscaler compute remaining available at rational prices. A capital-light monetiser is a leveraged bet on somebody else's capital discipline, which is a comfortable position while the hyperscalers are competing for workload and an uncomfortable one if they ever stop.
Part III — The Rally That Ignored the Distinction
Fig. 3 — Monday's megacap moves. Every large-cap technology name participated, including those that failed the coverage test.
One complication for everything above. Monday's rally did not discriminate at all. Meta led the megacaps at +6%, ahead of Microsoft and Alphabet at 4.9% and Amazon at 4.6%. The stock with the worst coverage ratio in the group outperformed the stock with the best. That is not what the framework predicts.
There are two readings and we do not yet know which is right. The first is that Monday was a macro day — oil down 5%, ISM at a four-year high, rates behaving — and on macro days correlation goes to one and single-name fundamentals stop mattering for a session. That would be consistent with the framework surviving and simply not being operative on Monday. The second reading is that the capital-expenditure discrimination of late July was itself the anomaly, driven by positioning into a heavy earnings week, and the market is reverting to treating the complex as one position. We think the first is more likely, and we would note that a single session is not evidence for much. But if Meta outperforms on a second consecutive quiet day, that is the framework telling us something and we will report it.
POSITIONING
Unchanged from Monday, with one addition and one flag. Microsoft largest at 0.81x. Amazon held; through $3 trillion and we are still not adding into the move. Intel maintained. AI-power (CEG, VST, TLN, GEV, ETN, PWR) maintained. Meta reduced — flagged above, and under review if the outperformance persists. Alphabet held reduced. Healthcare and staples on execution. Homebuilders reduced. Energy no position; we are not trading a headline war in either direction. The addition: we are initiating a small position in the capital-light monetiser cohort, with Palantir the anchor, sized at roughly a third of a normal initiation because we are buying it after a 17% pre-market move and because a 200-plus times earnings multiple leaves no margin for a single disappointing quarter. Buying strength after a print is the thing we criticised ourselves for last week with Amazon; the difference here is that we are sizing accordingly rather than pretending the entry is good. Cash to 14% from 15%.
8. ANALYST CALLS DRIVING ACTION
Upgrades and target hikes: a wave of Palantir increases overnight following the guidance raise, though several desks retained hold or sell ratings purely on valuation — the split between operational admiration and multiple discomfort is unusually wide. Amazon targets continuing higher post-$3 trillion. Marvell and Micron lifted on the AI-infrastructure read-through.
Downgrades and target cuts: energy targets trimmed further on the strike cancellation, then partially restored this morning on the Iranian denial — the second round trip in sell-side energy targets in eight days.
SYM / CGNX / TER — Physical-AI, capital-light. Same logic as the new cohort.
UNH / MRK / LLY / ABBV — Healthcare.
Disney (DIS) / McDonald's (MCD) — Report tomorrow.
Costco (COST) / Kraft Heinz (KHC) — Thursday.
XOM / CVX / FANG / EOG — No position. Two round trips in eight days.
LMT / RTX / NOC / GD — Defense re-bid on the Iranian denial.
DAL / UAL / LUV / RCL / CCL — Gave back some of Monday's fuel relief.
Gold (GLD) — $2,158. Bitcoin $65,120, +1.15%.
10. GLOBAL MACRO SNAPSHOT
Asia: Firm, following the US record and the ISM beat. The semiconductor complex leads on the Palantir read-through, with Japanese and Korean equipment names bid. Oil-importing economies retain most of Monday's relief despite the Iranian denial.
Europe: Higher. Industrials leading on the ISM print, which read positively for the German export complex in particular. Defence names re-bid modestly on the renewed Iran uncertainty.
Emerging markets: Holding most of Monday's gains. The relief for oil importers with external funding needs is real but now conditional on a safe-passage arrangement rather than a settlement, which is a materially thinner basis than yesterday's reporting implied.
11. WEEK AHEAD PREVIEW
Today: Trade balance 8:30; JOLTS 10:00. AMD, Lucid and SPCX after the close.
Wednesday: ADP 8:15; ISM services 10:00. Disney and McDonald's.
Thursday: Weekly jobless claims 8:30. Costco and Kraft Heinz.
Friday: July employment report 8:30 — consensus around 85,000.
Wed Aug 12: July CPI. Late August: Nvidia Q2. Sep 15-16: FOMC.
12. THE CLOSING THOUGHT
Monday was the broadest session of the year and it produced a record: the Dow closed at an all-time high of 53,178.41, the S&P gained 1.48% and the Nasdaq 2.1%, with Amazon crossing $3 trillion for the first time. Two things drove it — oil down 5% on the strike cancellation, and ISM manufacturing at 55.6, a four-year high and a large beat. Since then, Iran has denied that any talks with the United States are occurring, characterising its discussions as being with Oman over temporary safe passage; we led with the American account yesterday and address that in the editor's note. Overnight, Palantir grew revenue 93% at a 63% free-cash-flow margin and raised guidance to 80% full-year growth, which is a direct problem for the three-bucket framework we adopted eight days ago and which Section 7 addresses by adding a fourth category rather than defending the third. The complication we cannot resolve yet: Monday's rally did not discriminate at all, and Meta — the worst coverage ratio in the group — led it. One session is not evidence. A second would be. Today brings JOLTS at 10:00 and SpaceX's first public quarter after the close, where a thesis we set out in June finally meets audited numbers. Trade carefully.
THE BROOKSIDE BRIEF · COMPILED 9:30 AM ET · SOURCES: CNBC / YAHOO FINANCE / THESTREET (AUGUST 3 CLOSE AND DOW RECORD), INSTITUTE FOR SUPPLY MANAGEMENT JULY 2026 MANUFACTURING PMI REPORT (55.6), PALANTIR TECHNOLOGIES Q2 2026 EARNINGS RELEASE AND CALL, WASHINGTON POST / CNN / NBC NEWS / NPR (IRAN DENIES TALKS; TRUMP RESPONSE), CBS NEWS (LIVE UPDATES), BARCHART / TRADINGKEY / BENZINGA / TIPRANKS (AUGUST 4 PRE-MARKET AND JOLTS CONSENSUS), BUREAU OF LABOR STATISTICS RELEASE SCHEDULE, TREASURY H.15, ICE BRENT/WTI, CBOE, PETER FARAC 'MACRO IS DEAD', GROUNDBREAKER 'THE SECOND DERIVATIVE'
MORNING EDITION · WEDNESDAY, AUGUST 5, 2026 · S&P AND DOW RECORDS AGAIN · SPCX -7% ON 6x CAPEX · AMD -8% · ADP 44K
Daily Markets Briefing
The Brookside Brief
Markets · Macro · The Day Ahead
1. THE MORNING SETUP
Good morning. Tuesday delivered a second consecutive record session and a great deal of information. The S&P 500 rose 1.79% to a fresh all-time high of 7,736.52. The Dow added 907.47 points, or 1.71%, to a record 54,085.88. The Nasdaq Composite gained 2.59% to 26,584.99, its best close in weeks. Palantir's blowout and a broad chip rally set the tone early; Caterpillar and Wayfair both surged on beat-and-raise results.
Then the after-hours session did something more interesting. SpaceX beat on revenue and fell 7%. AMD beat on earnings and fell 8%. In both cases the stated reason was the same: investors looked past the headline numbers to the scale of AI-related capital spending. On a day when two major indices closed at record highs, the two companies that disclosed large capital-expenditure programmes were sold. That is the discrimination we described last week operating independently of market direction, and it answers the question we left open yesterday about whether Monday's undiscriminating rally had broken the framework. It had not. Monday was a macro day.
SpaceX's first public quarter deserves its own treatment and gets it in Section 7, because it requires us to withdraw a thesis. The headline numbers were strong: revenue of $7.81 billion against $6.93 billion expected, up 92% from $4.1 billion a year earlier. Net loss narrowed to $541 million from $1.0 billion. Adjusted EBITDA rose 191% to $3.5 billion. Starlink reached 12 million subscribers, double a year ago, adding 1.7 million net in the quarter. And then: capital expenditure of $18.37 billion in a single quarter, up more than sixfold year on year, of which $15.83 billion went to AI. That is 235% of quarterly revenue. The stock fell about 7% in extended trading.
The macro data has turned softer. Tuesday brought JOLTS job openings down 178,000 and factory orders down 0.3%. This morning's ADP report showed only 44,000 private jobs added in July, sharply below expectations and well under the 85,000 consensus for Friday's official payrolls. Two soft labour prints in two days, following an ISM manufacturing survey at a four-year high on Monday, make for a genuinely confusing picture — and one the Committee will have to resolve before September.
Futures are mixed with a positive bias: Dow futures up 195 points, S&P 500 up 0.41%, Nasdaq 100 down 0.02%. Disney reported a blowout quarter and is driving the Dow's premarket strength. Also reporting today: Uber, Eli Lilly, DoorDash and e.l.f. Beauty. The final S&P Global services PMI prints at 9:45 AM and the ISM services index at 10:00.
2. MARKETS AT A GLANCE
TUESDAY AUGUST 4 CLOSE — SECOND CONSECUTIVE RECORD SESSION
Asset
Last
Change
% Chg
S&P 500
7,736.52
+136.02
+1.79% (record)
Dow Jones Industrial Avg.
54,085.88
+907.47
+1.71% (record)
Nasdaq Composite
26,584.99
+671.09
+2.59%
Palantir (PLTR)
—
—
blowout; led the tape
Caterpillar (CAT)
—
—
beat and raise
AFTER-HOURS — BOTH BEAT, BOTH SOLD ON CAPEX
Name
Headline
What mattered
Reaction
SpaceX (SPCX)
rev $7.81B vs $6.93B
capex $18.37B
-7%
AMD
topped estimates
AI capex scale
-8%
LABOUR AND ORDERS DATA — SOFTENING
Release
Actual
Note
Read
ADP private payrolls (Jul)
44,000
sharply below exp
SOFT
JOLTS job openings
-178,000
June
SOFT
Factory orders
-0.3%
June
SOFT
ISM Manufacturing (Mon)
55.6
54.0 exp — 4-yr high
STRONG
U.S. EQUITY FUTURES (PRE-OPEN — DISNEY LIFTING THE DOW)
Asset
Last
Change
% Chg
Dow (YM)
—
+195 pts
+0.36%
S&P 500 (ES)
—
—
+0.41%
Nasdaq 100 (NQ)
—
—
-0.02%
COMMODITIES, CRYPTO & RATES
Asset
Last
Change
% Chg
Brent Crude (Oct)
$83.40
-$0.80
-0.95%
WTI Crude (Sep)
$79.30
-$0.80
-1.00%
Gold (spot)
$2,171
+$13
+0.60%
Bitcoin
$66,050
+$930
+1.43%
UST 2-Year
4.01%
-7 bps
on ADP
UST 10-Year
4.51%
-6 bps
—
3. TOP STORIES
SpaceX Beats on Revenue, Falls 7% on a $18.37 Billion Quarter of Capex
SpaceX's maiden quarter as a public company was operationally strong and financially confronting in equal measure. Revenue of $7.81 billion beat the $6.93 billion consensus by 12.7% and grew 92% from $4.1 billion a year earlier. Net loss narrowed to $541 million from $1.0 billion. Adjusted EBITDA rose 191% to $3.5 billion. The connectivity segment produced $4.3 billion of revenue with 1.7 million net subscriber additions, taking Starlink to 12 million subscribers, double the level of a year ago. The AI segment grew 247% year on year to $2.6 billion.
Against that: capital expenditure of $18.37 billion in the quarter, up more than sixfold year on year, with $15.83 billion of it in AI. Cash and equivalents stand at $93.5 billion following the IPO, up from $24.7 billion at the end of the first quarter, so the spending is funded. Management projects a $100 billion annualised revenue run rate by the end of 2026 and has pulled its internal $1 trillion revenue forecast forward to 2030 from 2031. The stock fell roughly 7% in extended trading.
AMD Beats and Falls 8% on the Same Concern
AMD topped Wall Street estimates and was sold off 8% after hours, with the stated reason being that investors focused on the scale of AI-related capital spending rather than the headline beats. Two companies, both beating, both falling on capital intensity, on the same evening, at the end of a day when the S&P 500 and Dow both closed at record highs. Whatever else is true, the market is applying a consistent test.
Records Again — S&P 7,736.52, Dow 54,085.88
Tuesday was the second consecutive record session and the strongest two-day stretch of the year. The S&P 500 rose 1.79% to 7,736.52 and the Dow added 907.47 points to 54,085.88, both all-time highs. The Nasdaq rose 2.59% to 26,584.99, its best close in weeks. Palantir's quarter and the resulting chip rally set the tone from the open; Caterpillar and Wayfair added beat-and-raise results in the industrial and consumer complexes. Easing US-Iran tension provided the backdrop, though as we noted yesterday the diplomatic position is considerably less settled than Monday's reporting implied.
ADP at 44,000 — Well Below Friday's Consensus
This morning's ADP National Employment Report showed 44,000 private jobs added in July, sharply below expectations and well under the roughly 85,000 consensus for Friday's official payrolls. It follows Tuesday's JOLTS release showing job openings down 178,000 and factory orders down 0.3%. ADP and the Bureau of Labor Statistics measure different things and do not map one-to-one — ADP has missed the official number badly in both directions — but two soft labour datapoints in two days is a pattern worth noting. The two-year yield has fallen seven basis points this morning in response.
Disney Delivers a Blowout; Lilly, Uber, DoorDash Follow
Disney reported a blowout quarter and is the principal reason Dow futures are up nearly 200 points this morning. Eli Lilly, Uber, DoorDash and e.l.f. Beauty also report today. Disney's result matters beyond the name: alongside Caterpillar and Wayfair yesterday, it suggests the consumer and industrial complexes are holding up considerably better than a 1.5% second-quarter GDP print implied.
4. MACRO & FED WATCH
This week's data has been genuinely contradictory and it is worth resisting the temptation to pick the side that fits. Monday's ISM manufacturing at 55.6 was a four-year high and a large beat. Tuesday's JOLTS showed openings down 178,000 and factory orders down 0.3%. Wednesday's ADP showed 44,000 private jobs. Manufacturing sentiment is at its strongest since 2022 while hiring and orders are cooling.
The plausible reconciliation is timing: survey-based measures like ISM capture expectations, which have improved sharply on the oil collapse and the de-escalation, while JOLTS and factory orders are backward-looking hard data from June, before either development. If that is right, the soft prints describe the economy that was and the ISM describes the one that is forming. It is also possible that ISM is simply noisy and the labour market is genuinely cooling. Friday's payrolls at an 85,000 consensus is the arbiter, and after ADP the risk is skewed to a miss. We wrote on Monday that a materially weak print would shift the debate from whether to hike toward whether the Committee has already over-tightened; that shift now looks more likely than it did 48 hours ago.
5. ECONOMIC CALENDAR
Day
Time (ET)
Release / Event
Consensus / Actual
Mon Aug 3
10:00 AM
ISM Manufacturing (released)
55.6 vs 54.0 — 4-yr high
Tue Aug 4
10:00 AM
JOLTS (released)
openings -178,000
Tue Aug 4
10:00 AM
Factory orders (released)
-0.3%
Tue Aug 4
AH
SPCX Q2 (released)
rev beat; capex $18.37B; -7%
Tue Aug 4
AH
AMD Q2 (released)
beat; -8% on capex
Wed Aug 5
8:15 AM
ADP employment (released)
44,000 — sharply below exp
Wed Aug 5
9:45 AM
S&P Global services PMI (final)
July
Wed Aug 5
10:00 AM
ISM Services PMI
July
Wed Aug 5
—
Disney (released), Lilly, Uber, DoorDash
Disney blowout
Thu Aug 6
8:30 AM
Weekly jobless claims
w/e Aug 1
Thu Aug 6
—
Costco, Kraft Heinz
Results
Fri Aug 7
8:30 AM
JULY EMPLOYMENT REPORT
~85,000 consensus
Wed Aug 12
8:30 AM
July CPI
September FOMC swing factor
Late Aug
AH
Nvidia Q2
Vendor-financing scrutiny
Sep 15-16
2:00 PM
FOMC
Live after three July dissents
6. EARNINGS WATCH
The season keeps producing the same signal from different directions. Palantir was rewarded for growth without capital intensity; SpaceX and AMD were punished for capital intensity despite growth. Disney, Caterpillar and Wayfair have been rewarded for straightforward beat-and-raise results in businesses where the AI-capex question does not arise at all. Eli Lilly today is the largest remaining non-technology print of the week, and Costco and Kraft Heinz tomorrow complete the staples picture. Nvidia in late August remains the print that matters most, and after last night it will be read for capital intensity and vendor financing at least as closely as for revenue.
7. SECTOR SPOTLIGHT: RIGHT OUTCOME, WRONG REASON
On Monday and again on Tuesday we set out, in writing, what SpaceX's first public quarter would have to show for our June bear case to have been wrong. Three things: customer concentration materially below the roughly 65% we assumed, launch-cadence economics stronger than we had modelled, and no related-party transfers of consequence. We said we would report the result on Wednesday. This is Wednesday.
The June thesis failed all three tests.
Part I — The Accounting
Fig. 1 — SpaceX beat consensus by 12.7% and grew revenue 92%. It also spent 235% of quarterly revenue on capital expenditure.
On concentration. We assumed roughly 65% exposure to xAI and adjacent entities. The disclosed segmentation shows connectivity at $4.3 billion of $7.81 billion in revenue — about 55% — with the AI segment at $2.6 billion, or roughly 33%. Starlink has 12 million subscribers, double a year ago, having added 1.7 million net in the quarter. That is a large, diversified, fast-growing consumer and enterprise subscription business, and it is the majority of the company. Our concentration figure was not slightly off; it was close to inverted.
On operating economics. We modelled launch-cadence economics that were weaker than the company has delivered. Revenue grew 92% and beat consensus by 12.7%. The net loss narrowed by nearly half, from $1.0 billion to $541 million. Adjusted EBITDA rose 191% to $3.5 billion. Whatever criticisms are available here, weak operating momentum is not one of them.
On related-party transfers. We flagged the risk that public investors would fund vertically integrated capital transfers within the Musk group. Nothing of consequence has been disclosed in this filing. Absence of disclosure is not proof of absence, and we will keep reading, but we have no evidence for the claim and should not have leaned on it as heavily as we did.
WITHDRAWING THE JUNE THESIS
We are withdrawing the June 16 SpaceX bear case. It rested on three specific assertions and the first audited disclosure contradicts or fails to support all three. The stock did fall from $177.99 to below its $135 offer price in the intervening period, and we could construct a narrative in which that vindicates us. It would not be honest. We were right about the direction of the stock and wrong about the company, and those are entirely different things. The specific danger of conflating them is that it manufactures confidence in a process that did not actually work — the position would have made money, the reasoning was mistaken, and repeating the reasoning would eventually cost more than this trade made. Readers who acted on the June note took the right side for reasons that turned out to be false, which is luck, and luck is not repeatable. We would rather retire a thesis that worked than keep one we can no longer defend.
Part II — What Actually Moved It
Fig. 2 — The Buildout Coverage Ratio now has four observations. The ordering has held every time, including on a record-high day.
The reason SpaceX fell 7% is the framework we started building six weeks after the June note, for entirely unrelated reasons. Capital expenditure of $18.37 billion against revenue of $7.81 billion is 235% of quarterly revenue. Capex grew more than sixfold — roughly 500% — against revenue growth of 92%. That is a Buildout Coverage Ratio of about 5.4x.
Placed alongside the three observations we already had, the ordering holds exactly for a fourth time: Microsoft at 0.81x rose 16%; Amazon at 1.82x rose; SpaceX at 5.4x fell 7%; Meta at 7.11x fell 9.6%. Every one of those ratios was computable before the respective stock traded, and the sequence has now survived a market that fell hard on July 29, rose to records on August 3 and 4, and treated the capital-intensive names identically in both regimes.
AMD is a fifth data point in kind if not in precise measurement — it beat and fell 8% with the scale of AI capital spending given as the reason. We do not have a clean ratio for it because the relevant revenue line and the capital programme are less cleanly paired, and we would rather report four rigorous observations than five where the fifth is stretched.
Part III — The Labour Market, and Friday
Fig. 3 — ADP at 44,000 against a Friday payrolls consensus of roughly 85,000. Two soft labour prints in two days.
The week's macro data is pulling in two directions and we should be honest that we do not know which wins. Monday's ISM manufacturing at 55.6 was the strongest since May 2022. Tuesday's JOLTS showed openings down 178,000 and factory orders down 0.3%. This morning's ADP printed 44,000, roughly half Friday's payrolls consensus.
The reconciliation we find most plausible is that ISM is a survey of expectations, which improved sharply once oil collapsed and the strike was cancelled, while JOLTS and factory orders are hard June data collected before either event. On that reading the soft prints describe the past and the ISM describes the present. But ADP is a July number, and it is weak. The honest position is that Friday decides it, and that after this morning the risk is skewed toward a miss.
POSITIONING
Microsoft largest at 0.81x. Amazon held at 1.82x. Palantir held at the third-size position initiated yesterday; the thesis is intact and we are not adding on strength. Intel maintained. AI-power (CEG, VST, TLN, GEV, ETN, PWR) maintained — contracted cash flows have now been indifferent to five weeks of this argument. Meta reduced; we flagged yesterday that a second day of outperformance would put the position under review, and Tuesday did not deliver one. Healthcare and staples on execution, with Eli Lilly reporting today. Homebuilders reduced, though a two-year at 4.01% and falling makes that increasingly hard to justify — if Friday's payrolls miss, we will revisit on Monday. Energy no position. SPCX no position and we are not initiating one; withdrawing a bear case is not the same as adopting a bull case, and a company spending 235% of revenue on capital expenditure is not one we want to own on the framework we actually trust. Cash 14%.
8. ANALYST CALLS DRIVING ACTION
Upgrades and target hikes: Disney increases following the blowout quarter. Caterpillar and Wayfair lifted on beat-and-raise. Palantir target increases continuing, still with an unusually wide split between operational upgrades and valuation-based holds.
Downgrades and target cuts: AMD trimmed overnight on the capital-spending commentary despite the beat. SpaceX targets in flux — the sell side has had one quarter of audited financials and the dispersion of published estimates is unusually wide, which is normal for a first print and a reason to treat any single target with caution.
9. STOCKS TO WATCH
SpaceX (SPCX) — Rev $7.81B beat, +92%; capex $18.37B, 235% of revenue. -7%. Bear case withdrawn; no position.
AMD — Beat and fell 8% on AI capital spending. Same test, same answer.
Palantir (PLTR) — Held at third size. 63% FCF margin, no buildout.
Microsoft (MSFT) — Largest position. 0.81x.
Amazon (AMZN) — Held. 1.82x. Through $3 trillion Monday.
Meta (META) — Reduced. No second day of outperformance.
Nvidia (NVDA) — Late August. Will be read for capital intensity as much as revenue.
Disney (DIS) — Blowout quarter; driving Dow futures.
Eli Lilly (LLY) — Reports today. Largest non-tech print of the week.
Uber (UBER) / DoorDash (DASH) — Report today.
Caterpillar (CAT) / Wayfair (W) — Beat and raise Tuesday.
Intel (INTC) — Capex recipient. Maintain.
TSMC / ASML — Aggregate capex guide supportive.
CEG / VST / TLN — AI-power. Five weeks of indifference to the argument.
Asia: Firm on the US records, with the semiconductor complex mixed — the Palantir read-through is positive for the software and infrastructure names while the AMD reaction weighs on the capital-intensive end. Oil importers continue to benefit from crude below $84.
Europe: Higher. Industrials leading on the ISM manufacturing read-through from Monday. Disney's result supportive for the European media and leisure complex. Defence names quieter as the Iran situation moves sideways rather than in either direction.
Emerging markets: Firm, with the softer dollar following ADP providing additional relief on top of the crude decline. The Asian currency stress we have tracked through the oil episode has now largely reversed, which is the cleanest evidence that the Hormuz premium has genuinely come out of the system rather than merely paused.
11. WEEK AHEAD PREVIEW
Today: S&P Global services PMI 9:45; ISM services 10:00. Lilly, Uber, DoorDash, e.l.f. Beauty.
Thursday: Weekly jobless claims 8:30. Costco and Kraft Heinz.
Friday: July employment report 8:30 — ~85,000 consensus, risk skewed to a miss after ADP.
Wed Aug 12: July CPI — the September FOMC swing factor.
Late August: Nvidia Q2. Sep 15-16: FOMC.
12. THE CLOSING THOUGHT
Tuesday produced a second consecutive record — S&P 500 up 1.79% to 7,736.52, Dow up 907 points to 54,085.88, Nasdaq up 2.59% — and then, after the close, SpaceX beat on revenue and fell 7% while AMD beat on earnings and fell 8%, both on the scale of AI capital spending. The discrimination we described last week is operating independently of market direction, which answers the question we left open yesterday. SpaceX's maiden quarter requires us to withdraw the June bear case: revenue of $7.81 billion beat consensus by 12.7% and grew 92%, Starlink doubled to 12 million subscribers, and our customer-concentration assumption was close to inverted. The stock fell anyway, on $18.37 billion of quarterly capital expenditure — 235% of revenue — which is the framework we built six weeks after the note, for unrelated reasons. We were right about the stock and wrong about the company, and Section 7 explains why treating those as the same thing is the most dangerous mistake available to anyone who writes about markets. The Buildout Coverage Ratio now has four observations and the ordering has held every time. On the macro, this morning's ADP at 44,000 follows JOLTS openings down 178,000, against Monday's four-year high in ISM manufacturing — a genuinely contradictory week that Friday's payrolls will arbitrate. Trade carefully.
THE BROOKSIDE BRIEF · COMPILED 9:30 AM ET · SOURCES: THESTREET / CNBC / QZ (AUGUST 4 CLOSE AND RECORDS), SPACEX Q2 2026 RESULTS AND WEBCAST AUGUST 4 2026 AND SPACEX INVESTOR RELATIONS, CNBC (SPCX LIVE COVERAGE), AMD Q2 2026 RESULTS, ADP NATIONAL EMPLOYMENT REPORT JULY 2026, BUREAU OF LABOR STATISTICS JOLTS AND JUNE EMPLOYMENT SITUATION, US CENSUS BUREAU FACTORY ORDERS, INSTITUTE FOR SUPPLY MANAGEMENT, SCHAEFFER'S / INVEZZ / SEEKING ALPHA (AUGUST 5 PRE-MARKET AND DISNEY), TREASURY H.15, ICE BRENT/WTI, CBOE, PETER FARAC 'MACRO IS DEAD', GROUNDBREAKER 'THE SECOND DERIVATIVE'
MORNING EDITION · THURSDAY, AUGUST 6, 2026 · DOW FIFTH STRAIGHT RECORD · ISM SERVICES: JOBS 47.4, PRICES 70.3 · PAYROLLS TOMORROW
Daily Markets Briefing
The Brookside Brief
Markets · Macro · The Day Ahead
EDITOR'S NOTE — RETURNING TO THE TEACHING
A reader observed this week that the brief has drifted toward positioning calls and away from the explanatory writing it started as, and the observation is correct. Over the past fortnight our Sector Spotlight has increasingly been about what we own and why, with the teaching squeezed into the margins. That was not the intention when this began. From today the balance moves back: Section 7 returns to being a primer first, and where we hold a view we will state it briefly rather than build the section around it. Today's is a genuine one — an oil-market primer that also happens to explain why our own coverage of the Hormuz episode has been reporting the least informative number available.
1. THE MORNING SETUP
Good morning. Wednesday split the market for the second time this week. The Dow rose 263.24 points, or 0.49%, to 54,349.12 — a record close and its fifth consecutive positive session. The S&P 500 slipped 0.17% to 7,723.55, snapping a four-day winning streak, and the Nasdaq Composite fell 0.8%. The industrial and consumer complexes are carrying this tape; the technology complex has stalled.
The ISM services survey was the substantive release and it deserves reading carefully rather than by the headline. The composite came in at 54.1 against a 54.5 consensus and 54.0 in June — a marginal miss but still comfortably in expansion. Underneath it, the employment index fell to 47.4, its lowest since March and below the fifty line that separates growth from contraction. The prices index rose to 70.3, taking its twelve-month average to the highest since April 2023. Services employment contracting while services prices accelerate is an uncomfortable combination, and it is the third consecutive day of labour data pointing the same direction.
That sequence now reads: JOLTS openings down 178,000 on Tuesday, ADP private payrolls at 44,000 on Wednesday, and the ISM services employment index at 47.4 the same morning. Against it stands Monday's ISM manufacturing at a four-year high. Tomorrow's July employment report is the arbiter, with consensus having drifted down through the week to roughly 80,000 and unemployment expected near 4.2%.
Today brings initial jobless claims at 8:30 AM, forecast at 203,000 against 197,000 last week, alongside preliminary second-quarter productivity, with June wholesale trade at 10:00. Costco and Kraft Heinz report, completing the staples picture that Coca-Cola and Procter & Gamble split last week. Futures are close to unchanged.
Today's Sector Spotlight is a primer rather than a position. A reader sent through a long piece from Strategist and Giacomo Prandelli called "There Is No Oil Price," and it is the best thing we have read on the subject in some time. It also lands a direct and deserved hit on how this brief has covered the Hormuz episode for a month.
2. MARKETS AT A GLANCE
WEDNESDAY AUGUST 5 CLOSE — DOW RECORD, FIFTH STRAIGHT GAIN; TECH SOFTER
Asset
Last
Change
% Chg
Dow Jones Industrial Avg.
54,349.12
+263.24
+0.49% (record)
S&P 500
7,723.55
-12.97
-0.17%
Nasdaq Composite
—
—
-0.80%
ISM SERVICES (JULY) — READ THE INTERNALS, NOT THE HEADLINE
Component
Actual
Context
Read
Composite PMI
54.1
54.5 exp / 54.0 prior
SLIGHT MISS
Employment index
47.4
below 50 = contraction
LOWEST SINCE MARCH
Prices index
70.3
12-mth avg highest since Apr 2023
HOT
THE LABOUR SEQUENCE THIS WEEK
Day
Release
Level
Read
Mon
ISM Manufacturing
55.6 — 4-year high
STRONG
Tue
JOLTS openings
-178,000
SOFT
Wed
ADP private payrolls
44,000
SOFT
Wed
ISM Services employment
47.4
SOFT
Thu
Initial jobless claims
203,000 exp vs 197,000
—
Fri
July employment report
~80,000 exp; u-rate ~4.2%
THE ARBITER
COMMODITIES, CRYPTO & RATES
Asset
Last
Change
% Chg
Brent Crude (Oct)
$83.10
-$0.30
-0.36%
WTI Crude (Sep)
$79.05
-$0.25
-0.32%
Gold (spot)
$2,180
+$9
+0.41%
Bitcoin
$65,700
-$350
-0.53%
UST 2-Year
3.99%
-2 bps
—
UST 10-Year
4.49%
-2 bps
—
3. TOP STORIES
Dow Takes a Fifth Straight Session and Another Record
The Dow's 263-point gain to 54,349.12 was its fifth consecutive positive session and a fresh record close, while the S&P slipped 0.17% and the Nasdaq fell 0.8%. The divergence has been the week's consistent feature: Disney, Caterpillar and Wayfair have been rewarded for uncomplicated beat-and-raise results, while the capital-intensive technology names have been sold. It is worth noting that an index at a record high and a technology complex that cannot hold a bid are not contradictory — they are what a rotation looks like while it is happening.
ISM Services: Employment 47.4, Prices 70.3
The July services survey printed a composite of 54.1 against 54.5 expected. The headline is unremarkable. The internals are not. The employment index fell to 47.4, its lowest since March and its second consecutive month below the fifty line. Services employ roughly four-fifths of the American workforce, so a contracting services employment index is a more meaningful labour signal than most monthly indicators. Simultaneously the prices index rose to 70.3, taking its twelve-month average to the highest since April 2023. Prices accelerating while hiring contracts is the specific combination that makes a central bank's job difficult, and it arrives eight days after three Federal Reserve presidents dissented in favour of a rate increase.
Three Soft Labour Prints, One Strong Survey
This week's data has been contradictory in a way that is now hard to dismiss as noise. Monday's ISM manufacturing reached 55.6, a four-year high. Tuesday's JOLTS showed job openings down 178,000. Wednesday's ADP reported 44,000 private jobs, roughly half tomorrow's payrolls consensus, and the ISM services employment index fell to 47.4. Three of the four labour-adjacent readings point down; the one pointing up is a survey of manufacturing sentiment, a sector employing under a tenth of the workforce. On the arithmetic of what each indicator actually measures, the soft readings should carry more weight.
Costco and Kraft Heinz Complete the Staples Picture
Costco and Kraft Heinz report today. The staples cohort has split cleanly this season — Coca-Cola beat and raised on pricing and mix; Procter & Gamble missed on weak consumer demand in household and personal care. Costco's membership renewal rate and traffic data are the most reliable read available on whether the American consumer is trading down, and Kraft Heinz will show whether packaged-food volumes have stabilised. Both matter more for the macro picture than for the individual names.
SpaceX Firms Ahead of a Lock-Up Release
SpaceX shares rose Wednesday ahead of a scheduled lock-up release. We withdrew our June bear case yesterday after the first audited disclosure contradicted its central assumptions, and we have no position. For readers holding one, the mechanics of a lock-up expiry are worth understanding on their own terms and we covered them in the July 7 brief: additional supply meets a fixed float, and the size of the move depends less on whether insiders sell than on how many days of average volume the newly tradeable shares represent.
4. MACRO & FED WATCH
The September question has become genuinely two-sided in the space of a week. The hawkish case rests on annual core PCE at 3.3% against a 2% target, an ISM services prices index at 70.3 with its twelve-month average at a three-year high, and three voting presidents who wanted to move in July. The dovish case rests on three consecutive soft labour readings and a services employment index in contraction. Both are supportable from this week's data alone.
WHY A DIFFUSION INDEX IS NOT A GROWTH RATE
ISM readings are diffusion indices, and they are routinely misread. A print of 54.1 does not mean services grew 54.1% of anything, nor that activity is strong. It means that of the purchasing managers surveyed, the share reporting improvement minus the share reporting deterioration, adjusted to a 0-100 scale, landed at 54.1. Fifty is the line where as many respondents saw things get worse as saw them get better. This has two consequences worth carrying around. First, a diffusion index measures breadth, not magnitude — an economy where every firm improves slightly prints higher than one where half the firms boom and half collapse, even if the second has more growth. Second, it is a survey of perception, which means it turns faster than hard data and is more easily moved by sentiment. That is precisely why Monday's manufacturing reading at a four-year high and this week's hard labour data pointing the other way are not necessarily contradictory: the survey caught the mood improving after oil collapsed, while JOLTS and factory orders measured June, before it did.
5. ECONOMIC CALENDAR
Day
Time (ET)
Release / Event
Consensus / Actual
Mon Aug 3
10:00 AM
ISM Manufacturing (released)
55.6 — 4-year high
Tue Aug 4
10:00 AM
JOLTS (released)
openings -178,000
Wed Aug 5
8:15 AM
ADP (released)
44,000
Wed Aug 5
10:00 AM
ISM Services (released)
54.1; jobs 47.4; prices 70.3
Thu Aug 6
8:30 AM
Initial jobless claims
203,000 exp vs 197,000
Thu Aug 6
8:30 AM
Q2 productivity (prelim)
—
Thu Aug 6
10:00 AM
June wholesale trade
—
Thu Aug 6
—
Costco, Kraft Heinz
Staples read
Fri Aug 7
8:30 AM
JULY EMPLOYMENT REPORT
~80,000; u-rate ~4.2%
Wed Aug 12
8:30 AM
July CPI
September FOMC swing factor
Late Aug
AH
Nvidia Q2
Final major print of the season
Sep 15-16
2:00 PM
FOMC
Live after three July dissents
6. EARNINGS WATCH
Costco and Kraft Heinz today complete the staples picture. Nvidia in late August is the last print of consequence this season. With roughly 300 S&P 500 companies reported, about 85% have beaten and aggregate profit growth is tracking above 47% — a strong season by any measure, and one whose strength has been almost entirely obscured by the argument about capital expenditure.
7. SECTOR SPOTLIGHT: THERE IS NO OIL PRICE
A reader sent through a primer published on 23 July by Strategist, written with Giacomo Prandelli, titled "There Is No Oil Price." It runs to more than a hundred pages on the oil midstream — everything between the wellhead and the engine — and it is the most useful thing we have read on commodities this year. It is also, unintentionally, a critique of this brief.
For a month we have reported the Hormuz episode through a single number. Brent at $78.80. Brent at $94.07. Brent at $83.64. We have treated that number as though it were the story. The primer's central argument is that it is the least informative layer available, and having read it we think that is right.
Part I — The Day Oil Cost Minus Thirty-Seven Dollars
Fig. 1 — Three oil prices settled on the same afternoon in April 2020. Only one of them was negative.
On 20 April 2020 the front-month WTI contract settled at minus $37.63. Grown professionals paid strangers roughly forty dollars a barrel to take oil away. It was widely filed under pandemic strangeness and forgotten.
Here is what actually happened. A futures contract is an abstraction for its entire life except the last day, when whoever holds it has promised to receive a thousand barrels of physical crude at Cushing, Oklahoma. Cushing has about 76 million barrels of working storage. By 17 April roughly 60 million were in, and every remaining gallon was leased or committed. A crowd of paper longs woke up holding promises to receive physical oil in a town with nowhere to put it.
Brent settled positive that same afternoon. Deferred WTI — the contracts a month or two out — never went negative at all. The pandemic was global and so was the glut, but the negative price was Oklahoma's alone. Nothing was wrong with oil. One tank farm was full.
“When the middle of the market is overloaded, the economically rational response is a bonfire. The true floor under any deliverable commodity is minus the cost of destroying it. It's never zero.”
— Strategist and Giacomo Prandelli, "There Is No Oil Price," 23 July 2026
THE LADDER — THE SINGLE IDEA TO TAKE FROM THIS
Every barrel sits on a ladder of deliverable prices. The same physical barrel is worth one price if it can reach a benchmark-quality buyer at a major pricing point; less if it can only go regional; less again if it is stuck behind a full pipeline; and nothing at all if it cannot legally or physically move. Barrels gravitate toward the cheapest machine — pipe, tank, ship — that still has capacity. When the cheapest machine fills, the differential widens. That one sentence explains every regional price blowout in modern history: Alberta's forty-dollar discounts, negative gas at the Waha hub in west Texas, and Cushing in April 2020. It is also why "the oil price" is a category error. There is a price for a specific grade, at a specific place, deliverable in a specific window, and the gaps between those prices are where the information lives.
Part II — Where the Premium Actually Lives
Fig. 2 — The layers of an oil dislocation, ordered by how long each one persists. Flat price is the shortest-lived.
The primer's most directly useful contribution is a hierarchy. In a dislocation, flat price moves first and means least — it is the most liquid instrument on earth, the thing you can sell on a headline at two in the morning, and it forgets faster than anything else in the complex. The premiums that persist sit underneath it: war-risk insurance, then freight, then grade differentials, in descending order of stickiness.
The Hormuz numbers make this concrete. War-risk insurance on a single transit ran at 0.25% of hull value in February. At the peak it reached 10%. It sits at roughly 3-8% as the primer was written. On a large tanker that is three to eight million dollars per voyage, payable before the ship moves. We have quoted that rate in passing several times over the past month, usually in a single clause after the Brent level. We had the ordering exactly backwards.
The reason it matters is that the insurance rate is a considered judgment by people with capital at risk over a multi-week horizon, while flat price is a reflex. When Brent round-tripped fifteen dollars in seven sessions last month, the war-risk rate did not. If you want to know whether a geopolitical disruption is being taken seriously by people who have to live with the consequences, the insurance market answers the question and the futures screen does not.
Part III — Why Shipping Behaves Like an Option
Fig. 3 — VLCC spot day rates against the twelve-month time-charter rate. Spot moved twelvefold; the annual commitment did not move at all.
Midstream assets earn in two ways, and confusing them is expensive. The first is tolling — a contracted pipeline, a leased tank, a terminal with take-or-pay commitments. Volume times fee, protected by contract, largely indifferent to the oil price. This is valued like infrastructure debt and it is genuinely boring. The second is an option — a spot tanker, an uncommitted tank, a flexible trading book. These are worth very little in a normal market and a great deal in a broken one, because they are the release valve for a physical imbalance.
The numbers are violent in a way that equity investors tend not to believe until they see them. In March 2020, very large crude carrier rates went from $30,000 a day to $265,000 in a week, then back to $17,000 by August. This year, around the Strait: $50,000 a day in January, $206,000 by 26 February, $600,000 in mid-March, and $470,000 on 23 June. Twelve-fold, inside five months.
And through both of those spikes, the twelve-month time-charter rate stayed at roughly $110,000 a day. Nobody would commit to a year at panic prices. The primer offers three readings — charterers refusing to lock a crisis into a year of committed cost, owners refusing to sell convexity cheap, or both sides declining to price something they found too hard — and declines to pick one. The point that survives is that the gap between spot and period is itself a price, carrying information neither leg carries alone.
WHY TANKER EQUITIES BREAK P/E SCREENS
If a spot tanker is functionally a call option on dislocation, then a listed tanker owner is a portfolio of call options with a steel residual. That has a specific and counter-intuitive consequence for valuation. Earnings peak exactly when the option is most in-the-money, which is exactly when the conditions producing those earnings are least likely to persist — so the P/E ratio is lowest at the top of the cycle and highest, or undefined, at the bottom. Screening tanker equities on trailing earnings therefore systematically buys tops and sells bottoms. The professional approach values them on the steel — vessel values against replacement cost — and on the orderbook, because new supply is the thing that closes the window. On that second measure the current setup has a visible expiry: the crude tanker orderbook rose from 18% of the fleet in February to 22% in April, the highest since 2011, while not a single tanker was scrapped in May. The fleet is simultaneously the oldest in living professional memory and the most heavily ordered in fifteen years. Both are true, and the second one has delivery dates published by Korean and Chinese shipyards for anyone who cares to look.
Part IV — Four Facts Worth Carrying Around
Three-quarters of the world's oil travels by sea. Roughly 79.8 million barrels a day of a 104.4 million barrel market moves as maritime trade. Pipelines attract the political argument; the ocean is where the market actually is.
Hormuz is not the largest chokepoint. The Strait of Malacca carries about 23.2 million barrels a day against Hormuz's 20.9 million. We have written about Hormuz for a month without mentioning Malacca once.
Distance is demand. Shipping demand is barrels multiplied by distance — tonne-miles — because a ship going twice as far is occupied twice as long and unavailable to anyone else. A cargo from the eastern Baltic to Rotterdam is 1,250 nautical miles; the same cargo rerouted to India's west coast is 8,750. A sanctions regime can therefore manufacture a tanker shortage without the world consuming a single additional barrel. That is most of what happened to freight after 2022, and it reverses on a signature.
The state is now inside the middle of the market. This is the genuinely novel feature of 2026 and the primer flags it as without historical precedent: roughly 400 million barrels of strategic releases, sanctions waived and reimposed, and a $40 billion public reinsurer built in Washington to replace London insurance capacity — which, as of May, had written no policies at all. The American Strategic Petroleum Reserve now sits at its lowest level since 1983.
WHAT WE ARE CHANGING IN HOW WE REPORT OIL
Three things, starting today. First, we will stop leading with flat price alone. Where an oil development matters, we will report the war-risk insurance rate and the freight rate alongside it, because those are the layers that persist. Second, we will name the grade and the delivery point rather than writing "oil." Brent for October delivery and WTI at Cushing are different products with different constraints, and the difference between them is frequently the entire story. Third, when a chokepoint is in the news we will report inventories at the relevant hub, not just the price — Cushing spent June near 20 million barrels, at or below the practical minimum operators need for blending and line fill, and WTI briefly traded under $70 with the hub close to empty. Tank tops break a market; tank bottoms merely strain it. Neither shows up in the flat price until it is far too late to be useful.
8. ANALYST CALLS DRIVING ACTION
Disney increases continuing after the blowout quarter. Eli Lilly, Uber and DoorDash results are still being digested. Palantir target increases continue with an unusually wide split between operational upgrades and valuation-based holds. AMD trims following the capital-spending commentary.
9. STOCKS TO WATCH
Costco (COST) / Kraft Heinz (KHC) — Report today. Membership renewals and packaged-food volumes are the macro read.
Disney (DIS) — Blowout quarter; has led the Dow's run.
Nvidia (NVDA) — Late August. The season's last print of consequence.
Microsoft (MSFT) / Amazon (AMZN) — The two megacaps that passed the capex test.
Meta (META) / AMD / SPCX — The three that did not.
Palantir (PLTR) — 63% free-cash-flow margin, no buildout to fund.
Tanker names — worth understanding via Section 7 before screening on P/E.
XOM / CVX / FANG / EOG — Flat price is the least informative thing about them right now.
Gold (GLD) — $2,180. Bitcoin — $65,700.
10. GLOBAL MACRO SNAPSHOT
Asia: Steady. The technology complex is following the US pattern — capital-light names firm, capital-intensive names softer. Oil importers continue to benefit from crude in the low eighties.
Europe: Firmer, led by industrials. The German export complex is the clearest beneficiary of both the ISM manufacturing signal and crude below $85.
Emerging markets: Stable. The Asian currency stress that ran through the oil episode has now largely unwound, which — per Section 7 — is a more reliable signal that the disruption premium has genuinely left the system than the flat price is.
Friday: July employment report 8:30 — roughly 80,000 expected, unemployment near 4.2%.
Wed Aug 12: July CPI — the September FOMC swing factor.
Late August: Nvidia Q2. Sep 15-16: FOMC, live after three July dissents.
12. THE CLOSING THOUGHT
Wednesday gave the Dow a fifth straight session and another record at 54,349.12 while the S&P slipped and the Nasdaq fell 0.8% — a rotation in progress rather than a contradiction. The ISM services survey printed a forgettable 54.1 composite over two numbers that are not forgettable at all: an employment index at 47.4, in contraction and the lowest since March, and a prices index at 70.3 with its twelve-month average the highest since April 2023. That is the third soft labour reading in three days, against Monday's four-year high in manufacturing sentiment, and tomorrow's payrolls will arbitrate. Today's spotlight steps away from positioning and back toward explanation, which is where this brief started and where a reader rightly pointed out it should spend more time. The lesson from "There Is No Oil Price" is one we needed: the number we have been quoting all month is the one that moves first and means least. The premium that matters sits in insurance, freight and grade differentials, and we have been reporting the reflex rather than the judgment. That changes from today. Trade carefully.
THE BROOKSIDE BRIEF · COMPILED 9:30 AM ET · SOURCES: CNBC / WASHINGTON POST / THESTREET (AUGUST 5 CLOSE AND AUGUST 6 PRE-MARKET), INSTITUTE FOR SUPPLY MANAGEMENT JULY 2026 SERVICES REPORT, ADP NATIONAL EMPLOYMENT REPORT, BUREAU OF LABOR STATISTICS JOLTS AND RELEASE SCHEDULE, INVESTING.COM / KIPLINGER (THURSDAY CALENDAR), SECTION 7 DRAWS THROUGHOUT ON STRATEGIST AND GIACOMO PRANDELLI, 'THERE IS NO OIL PRICE' (23 JULY 2026), WITH APRIL 2020 SETTLEMENT DATA FROM CME AND ICE, EIA MARITIME TRADE AND CHOKEPOINT FIGURES, AND BIMCO TONNE-MILE DATA AS CITED THEREIN · TREASURY H.15, ICE BRENT/WTI, CBOE
MORNING EDITION · FRIDAY, AUGUST 7, 2026 · PAYROLLS FELL 23,000 · REVISIONS -103,000 · PARTICIPATION AT A FIVE-YEAR LOW
Daily Markets Briefing
The Brookside Brief
Markets · Macro · The Day Ahead
1. THE MORNING SETUP
Good morning. The July employment report landed at 8:30 and it was the week's arbiter, as advertised. Nonfarm payrolls fell by 23,000 — the first decline in months — against a consensus looking for a gain of 83,000. That is a miss of 106,000. The Bureau of Labor Statistics also revised the prior two months down by a combined 103,000, taking June to roughly 20,000.
And the unemployment rate fell. It slipped to 4.1%. If that combination seems contradictory, it is because the rate fell for the wrong reason: the labour force participation rate dropped to 61.4%, its lowest in more than five years. People did not find work. They stopped looking for it, which removes them from the unemployment calculation entirely. Section 7 is a primer on exactly this arithmetic, because it is one of the most consistently misunderstood numbers in economics and today is the cleanest illustration of it we are likely to get.
Markets took the print as unambiguously dovish. Dow futures rose close to 200 points, S&P 500 futures 0.5% and Nasdaq 100 futures 1%. The two-year Treasury yield fell more than six basis points to 4.176% and the ten-year eased four to 4.621%. On the CME FedWatch measure, the probability of a September rate increase dropped to 44%, with October at 58.3%. Note the framing: the market is still pricing when the Federal Reserve might hike, not cut. A negative payroll print has pushed that out rather than reversed it.
Thursday's session ended the Dow's five-day run. The Dow fell 464.02 points, or 0.85%, to 53,885.10. The S&P 500 slipped 0.18% to 7,709.96 and the Nasdaq eased 0.06% to 26,348.35. Rising oil and firmer yields did the work, with some profit-taking in technology ahead of the jobs data.
One genuinely odd feature of this week deserves flagging. Thursday's initial jobless claims came in at 199,000 against 204,000 expected, and the four-week moving average fell to 198,750 — the lowest since October 2022. Almost nobody is being laid off. And yet payrolls fell, job openings dropped 178,000, ADP printed 44,000 and the ISM services employment index sits at 47.4. That combination has a name and a set of consequences, and Section 7 covers it.
2. MARKETS AT A GLANCE
JULY EMPLOYMENT REPORT (RELEASED 8:30 AM) — THE HEADLINE NUMBERS
Measure
Actual
Context
Read
Nonfarm payrolls
-23,000
+83,000 expected
MISS BY 106,000
Prior two months
revised -103,000
June now ~+20,000
WORSE
Unemployment rate
4.1%
down from prior
FELL
Participation rate
61.4%
lowest in 5+ years
THE EXPLANATION
IMMEDIATE MARKET REACTION
Asset
Last
Change
% Chg
Dow futures
—
+~200 pts
RALLIED
S&P 500 futures
—
—
+0.50%
Nasdaq 100 futures
—
—
+1.00%
UST 2-Year
4.176%
-6+ bps
—
UST 10-Year
4.621%
-4 bps
—
Sept hike probability
44%
down sharply
CME FedWatch
Oct hike probability
58.3%
—
CME FedWatch
THURSDAY AUGUST 6 CLOSE — DOW'S FIVE-DAY RUN ENDED
Asset
Last
Change
% Chg
Dow Jones Industrial Avg.
53,885.10
-464.02
-0.85%
S&P 500
7,709.96
-13.59
-0.18%
Nasdaq Composite
26,348.35
-16.64
-0.06%
THE WEEK'S LABOUR DATA IN FULL
Day
Release
Level
Read
Mon
ISM Manufacturing
55.6 — 4-year high
STRONG
Tue
JOLTS openings
-178,000
SOFT
Wed
ADP private payrolls
+44,000
SOFT
Wed
ISM Services employment
47.4 — contraction
SOFT
Thu
Initial jobless claims
199,000; 4-wk avg lowest since Oct 2022
STRONG
Fri
Nonfarm payrolls
-23,000; revisions -103,000
VERY SOFT
3. TOP STORIES
Payrolls Fall 23,000 — First Decline in Months, and a 106,000 Miss
The July employment report showed nonfarm payrolls falling by a seasonally adjusted 23,000, against a Dow Jones consensus of an 83,000 gain. It is the first monthly decline in some time and the largest miss of the year. The Bureau of Labor Statistics simultaneously revised the prior two months down by a combined 103,000, which means the picture of the early summer labour market that markets have been working from was materially better than what actually happened. Taken together, the report removes roughly 126,000 jobs from where the consensus expected the economy to be.
The Unemployment Rate Fell to 4.1% — For the Wrong Reason
The unemployment rate declined to 4.1%. In isolation that reads as good news and a number of headlines this morning have treated it that way. It is not. The labour force participation rate fell to 61.4%, its lowest level in more than five years. The unemployment rate is the number of unemployed people divided by the labour force, and you only count as unemployed if you are actively looking for work. When people stop searching they leave both the top and the bottom of that fraction, and the rate mechanically falls. A falling unemployment rate driven by falling participation is a worse signal than a stable rate with stable participation. Section 7 works through the arithmetic properly.
Markets Rally, Yields Fall, September Hike Odds Drop to 44%
The reaction was immediate and directionally clear. Dow futures moved up close to 200 points, S&P 500 futures gained 0.5% and Nasdaq 100 futures 1%. The two-year Treasury yield fell more than six basis points to 4.176%; the ten-year eased four to 4.621%. On CME FedWatch, the probability of a September rate increase fell to 44% and October sits at 58.3%. The framing is worth noticing: futures are still pricing the timing of a hike rather than a cut. Eight days ago three Federal Reserve presidents dissented in favour of raising rates. A negative payroll print has pushed that debate out by a meeting or two; it has not turned it around.
Jobless Claims at 198,750 — the Lowest Four-Week Average Since October 2022
Thursday's claims data pointed hard the other way. Initial claims came in at 199,000 for the week ended 1 August, against 204,000 expected and up just 1,000 from the prior week. The four-week moving average fell to 198,750, the lowest since October 2022. On its own that reading is consistent with an expanding economy. Set against a negative payroll print, it describes something more specific: firms are not letting people go, and they are not taking people on either.
Dow's Five-Day Run Ends
Thursday closed the Dow's streak at five sessions and three records. The index fell 464.02 points to 53,885.10, with the S&P down 0.18% and the Nasdaq essentially flat at -0.06%. Rising crude and firmer Treasury yields did most of the work, alongside profit-taking in technology ahead of the employment data. Given this morning's futures response, most of that looks likely to reverse at the open.
4. MACRO & FED WATCH
The Committee's position has become genuinely uncomfortable. Eight days ago it held rates at 3.50-3.75% with three presidents dissenting in favour of an increase, and Chair Warsh described the stance as "watchful thinking." Since then: job openings down 178,000, ADP at 44,000, the ISM services employment index in contraction at 47.4, and now payrolls negative with 103,000 of downward revisions.
Against that sits the inflation side, which has not improved. Annual core PCE is 3.3% against a 2% target. The ISM services prices index printed 70.3 on Wednesday with its twelve-month average at the highest since April 2023. The second-quarter GDP deflator came in at 6.3%. A central bank facing deteriorating employment and firm inflation is in the least comfortable position available to it, because its two mandates point in opposite directions. The July CPI print on Wednesday 12 August now carries even more weight than it did — if inflation cooperates, the September decision becomes straightforward; if it does not, the Committee has to choose.
5. ECONOMIC CALENDAR
Day
Time (ET)
Release / Event
Consensus / Actual
Mon Aug 3
10:00 AM
ISM Manufacturing (released)
55.6 — 4-year high
Tue Aug 4
10:00 AM
JOLTS (released)
openings -178,000
Wed Aug 5
8:15 AM
ADP (released)
+44,000
Wed Aug 5
10:00 AM
ISM Services (released)
54.1; jobs 47.4; prices 70.3
Thu Aug 6
8:30 AM
Jobless claims (released)
199,000; 4-wk avg 198,750
Fri Aug 7
8:30 AM
JULY EMPLOYMENT (released)
-23,000; revisions -103,000
Wed Aug 12
8:30 AM
JULY CPI
The decisive print for September
Tue Aug 11
10:00 AM
July Existing Home Sales
Housing
Late Aug
AH
Nvidia Q2
Last major print of the season
Sep 15-16
2:00 PM
FOMC
Live; 44% hike priced
6. EARNINGS WATCH
The season is effectively complete outside Nvidia in late August. Roughly 85% of the 300-plus S&P 500 companies reported have beaten, with aggregate profit growth tracking above 47%. Costco and Kraft Heinz closed out the staples cohort on Thursday. It is worth registering how strange this season has been: corporate earnings have been excellent, the indices are near records, and the labour market just posted its first negative month in some time. Those are not contradictions so much as different clocks — earnings report the quarter that has happened, payrolls report the month that just ended, and equity prices attempt to discount the year ahead.
7. SECTOR SPOTLIGHT: THE UNEMPLOYMENT RATE FELL. THAT IS THE BAD NEWS.
This morning produced one of the cleanest teaching examples the data calendar offers. Payrolls fell 23,000 and the unemployment rate improved to 4.1%. Several outlets have led on the second number. Understanding why that is the wrong read requires knowing how the figure is actually built, and the mechanics are worth carrying around permanently, because this will happen again.
Part I — Two Surveys, Not One
Fig. 1 — Payrolls fell 23,000 against an expected 83,000 gain, and the prior two months were revised down by 103,000.
The employment report is not one survey. It is two, conducted separately, with different samples and different methods, published in the same document.
The establishment survey asks businesses how many people are on their payrolls. It covers roughly 120,000 businesses and government agencies. This is where the headline payroll number comes from — the minus 23,000. It counts jobs, not people, so somebody holding two jobs is counted twice, and it excludes the self-employed and agricultural workers entirely.
The household survey telephones about 60,000 households and asks people about their own situation. This is where the unemployment rate comes from — the 4.1% — along with the participation rate. It counts people rather than jobs, and it includes the self-employed.
Because they measure different things using different samples, the two surveys routinely disagree, and neither is the "correct" one. The establishment survey has a much larger sample and is more reliable for the level of employment. The household survey is the only source for the unemployment rate and the participation rate. Any month where the two appear to contradict each other, the resolution is usually found in the participation rate — as it is today.
Part II — The Arithmetic
Fig. 2 — The unemployment rate is a fraction. Shrinking the denominator lowers it just as effectively as improving the numerator.
The unemployment rate is the number of unemployed people divided by the size of the labour force. The definitions do the work:
To be counted as unemployed, you must be without a job, currently available for work, and have actively looked for work in the previous four weeks. All three conditions. The labour force is everybody employed plus everybody unemployed by that definition. Anyone not meeting the search test is classed as not in the labour force and disappears from the calculation altogether.
This produces the counter-intuitive result at the heart of today's report. When an unemployed person finds a job, they move from the numerator into the employed group, the rate falls, and that is genuinely good. When an unemployed person gives up looking, they leave the numerator and the denominator at the same time — and the rate also falls. Same direction, opposite meaning.
The participation rate is what distinguishes the two cases. It is the share of the working-age population either working or actively looking. It fell to 61.4% in July, the lowest in more than five years. That is the tell. The unemployment rate improved because the labour force shrank.
THE THREE QUESTIONS TO ASK OF ANY UNEMPLOYMENT RATE
Whenever you see an unemployment rate move, three follow-up questions will tell you almost everything about whether it means what it appears to. First, what did participation do? If the rate fell and participation fell with it, the improvement is mechanical rather than real. If the rate fell while participation rose — people entering the labour force and finding work — that is the strongest possible reading. Second, what happened to the employment-to-population ratio? This is the share of working-age people actually in a job, and because it has no search test in it, it cannot be flattered by discouraged workers leaving. Many economists prefer it for exactly that reason. Third, what did the payroll number do? If the household survey and the establishment survey disagree, take the larger sample seriously on the direction of employment. In July all three checks point the same way: participation down, payrolls negative, and the rate improving only because of the first.
Part III — Low-Fire, Low-Hire
Fig. 3 — Layoffs at their lowest four-week average since October 2022, alongside falling payrolls and collapsing openings.
The genuinely unusual feature of this week is the combination. Initial claims for unemployment insurance are running at a four-week average of 198,750, the lowest since October 2022. Claims measure people being let go. On that evidence the labour market is in excellent health.
Simultaneously, job openings fell 178,000, ADP reported 44,000 private jobs, the services employment index sits in contraction at 47.4, and payrolls went negative. Those measure people being taken on. On that evidence the labour market is deteriorating.
Both are true, and the state they jointly describe is sometimes called a low-fire, low-hire economy. Firms are holding onto the staff they have — often because hiring was so difficult and expensive in recent years that letting people go feels like a decision they would regret — while declining to add anyone new. It is a rational corporate response to uncertainty, and it produces a labour market that looks stable from the inside and is very difficult to enter from the outside.
WHO A LOW-HIRE ECONOMY ACTUALLY HURTS
The distributional consequences of this state are specific and worth understanding, because aggregate statistics conceal them. A low-fire, low-hire labour market is comfortable for anyone already employed and wanting to stay put — job security is high and the risk of layoff is genuinely low. It is difficult for anyone trying to change jobs, because the wage gains that come from switching employers dry up when nobody is recruiting, and switching is historically where most real wage growth comes from. And it is severe for new entrants — graduates, people returning after caring responsibilities, anyone re-entering after a long absence — because they have no incumbent position to hold and depend entirely on the hiring that has stopped. This is the mechanism by which a falling participation rate becomes self-reinforcing: prolonged unsuccessful searching produces discouraged workers, discouraged workers leave the labour force, and their departure makes the headline unemployment rate look better while the underlying problem worsens. It is also why economists watch the quits rate inside the JOLTS release: people only resign voluntarily when they are confident of finding something else, so a falling quits rate is an early signal of exactly this dynamic.
Part IV — Why Revisions Are Not a Footnote
One more piece of today's report deserves attention. The prior two months were revised down by a combined 103,000. Revisions are routinely treated as housekeeping and they are not.
The initial payroll estimate is published about three weeks after the reference period, based on the responses received by then — typically around 60 to 70% of the eventual sample. Businesses that report late are not a random subset: firms in difficulty, or shedding staff, tend to file later than firms that are stable. The consequence is that revisions carry information, and a run of revisions in the same direction carries more information than any single month's headline. A sequence of downward revisions suggests the initial estimates have been systematically flattering the labour market, which means today's minus 23,000 may itself look worse in two months' time. It is one of the reasons economists watch the three-month average of payrolls rather than the latest number.
8. ANALYST CALLS DRIVING ACTION
Rates strategists are the ones being repriced this morning. The September hike probability moving from roughly 68% earlier in the week to 44% now is a large shift in a short time, and desks that had been positioned for a September move are unwinding. Equity strategy notes have been quieter, which is unsurprising on a Friday morning — the substantive rethinking will arrive over the weekend.
9. STOCKS TO WATCH
Rate-sensitives broadly — homebuilders, utilities, REITs — the natural beneficiaries of a two-year at 4.176%.
DHI / LEN / TOL / KBH — Homebuilders. We reduced these in late July on the long-end move; this morning argues for revisiting.
Regional banks — a steeper curve helps, but a deteriorating labour market is a credit consideration.
Staffing and recruitment names — the most direct read on a hiring freeze.
TLT and the long end — the cleanest expression of the repricing.
Gold (GLD) — typically bid on a dovish repricing.
10. GLOBAL MACRO SNAPSHOT
Asia closed before the payroll release and will take the news on Monday. The direction is helpful for the region: a softer dollar and lower US yields ease conditions for Asian borrowers and support the currencies that came under pressure during the oil episode.
Europe is trading the US number in real time, with rate-sensitive sectors — utilities, real estate and construction — leading. European government bond yields have followed Treasuries lower.
Emerging markets are the clearest beneficiaries. Lower US yields and a weaker dollar are the two variables that matter most for external-funding-dependent economies, and both moved in their favour this morning.
11. WEEK AHEAD PREVIEW
Tue Aug 11: July Existing Home Sales, 10:00 AM.
Wed Aug 12: July CPI, 8:30 AM — now the decisive input for September.
Late August: Nvidia Q2, the season's final major print.
Sep 15-16: FOMC, with a September hike now roughly 44% priced.
12. THE CLOSING THOUGHT
The week's contradictory data resolved this morning, and it resolved soft. Payrolls fell 23,000 against an expected gain of 83,000, and the prior two months were revised down by 103,000. The unemployment rate improved to 4.1% — but only because the participation rate fell to 61.4%, the lowest in more than five years. People stopped looking rather than started working, and Section 7 explains why that distinction is the whole story rather than a technicality. Markets read it as dovish: Dow futures up close to 200 points, the two-year down more than six basis points to 4.176%, and September hike odds falling to 44%. Sitting alongside all of it, initial jobless claims are at their lowest four-week average since October 2022 — a labour market where almost nobody is being fired and almost nobody is being hired, which is comfortable if you already have a job and punishing if you are trying to find one. The Committee that produced three hawkish dissents eight days ago now faces deteriorating employment alongside a services prices index at 70.3. Wednesday's CPI print just became the most important number of the month. Enjoy the weekend.
THE BROOKSIDE BRIEF · COMPILED 9:30 AM ET · SOURCES: BUREAU OF LABOR STATISTICS, EMPLOYMENT SITUATION — JULY 2026 (RELEASED 7 AUGUST 2026), CNBC / NBC NEWS / QUARTZ / YAHOO FINANCE (PAYROLL COVERAGE AND MARKET REACTION), CNBC (TREASURY YIELDS AFTER SURPRISE JOBS LOSS), CME GROUP FEDWATCH (RATE PROBABILITIES), DEPARTMENT OF LABOR WEEKLY CLAIMS (WEEK ENDED 1 AUGUST 2026), BLS JOLTS, ADP NATIONAL EMPLOYMENT REPORT, INSTITUTE FOR SUPPLY MANAGEMENT, CNBC / STL.NEWS / THESTREET (AUGUST 6 CLOSE), TREASURY H.15 · SURVEY METHODOLOGY PER BLS TECHNICAL DOCUMENTATION
MORNING EDITION · MONDAY, AUGUST 10, 2026 · S&P AND NASDAQ AT RECORDS · BRENT $84.70 · HORMUZ TALKS DISPUTED · CPI WEDNESDAY
Daily Markets Briefing
The Brookside Brief
Markets · Macro · The Day Ahead
1. THE MORNING SETUP
Good morning. Friday resolved the way the bond market wanted it to. The S&P 500 rose 0.62% to a record close of 7,757.64 and the Nasdaq gained 1.3% to a record 26,690.62. The Dow added 151.83 points, or 0.28%, to 54,036.93. All three delivered their best week since mid-April — on a payroll report that was negative. Weak labour data lowered the odds of another rate increase, and that was worth more to equities than the growth signal cost them. The ten-year fell seven basis points to 4.6% and September hike odds closed at 42%, down from 58% the day before. Cumulative tightening priced through December fell to 28 basis points from 32.
This morning the market has changed the subject. Brent is up 1.4% at $84.70 and WTI up 1.4% at $79.31, and the driver is the Strait of Hormuz — where the diplomatic picture over the weekend became actively contradictory rather than merely uncertain. Futures are mixed: S&P 500 futures up 0.12% and Nasdaq 100 futures up 0.38%, with Dow futures lower on the crude move.
The weekend's sequence, in order. Iran and Oman appear close to a deal on managing the waterway. Then on Saturday Iran's national security chief published a list of demands the United States must meet before the strait reopens — compensation for damage from US strikes, an end to sanctions and military threats, and removal of the naval blockade. Washington has said a deal is near. Iranian foreign minister Abbas Araghchi says Tehran is not currently in direct talks with the United States at all, and President Trump told Axios the US is "only semi-negotiating," adding: "We are just watching Iran with its huge inflation and the fact they have no money." We flag explicitly, as we committed to last week, that the claim talks are underway is single-sourced to the American side and directly denied by the Iranian side. Readers should treat it as contested rather than established.
And on Sunday the conflict widened geographically. Houthi forces struck Saudi Aramco's Jazan refinery — a 400,000 barrel-per-day facility on the Red Sea coast — with a drone. The fire was extinguished and no injuries were reported. The Houthis framed it as retaliation for Saudi drone incursions over Saada and Hajjah, and it followed the kingdom signing a defence pact. They also hit the Yemeni Red Sea port of Mokha. The significance is less the barrels lost — apparently none — than the geography: the risk has moved from the water to Saudi soil.
All of which makes today the right morning for Section 7, which is a primer on something the tape keeps demonstrating and headlines keep obscuring: there is no such thing as "the oil price." The number quoted on the screen is one futures contract for one grade at one delivery point. What anyone actually pays for a barrel is that number plus a quality differential plus freight plus insurance — and it is the last two that have been doing the work these past weeks, invisibly, while the flat price moved a percent or two.
No economic data today. Wednesday's July CPI is the week.
2. MARKETS AT A GLANCE
FRIDAY AUGUST 7 CLOSE — RECORDS FOR THE S&P AND NASDAQ
Asset
Last
Change
% Chg
S&P 500
7,757.64
+47.68
+0.62%
Nasdaq Composite
26,690.62
+342.27
+1.30%
Dow Jones Industrial Avg.
54,036.93
+151.83
+0.28%
RATES AND FED PRICING AFTER THE PAYROLL PRINT
Measure
Level
Change
Source
UST 10-Year
≈4.60%
-7 bps
Friday
Sept hike probability
42%
from 58%
CME FedWatch
Tightening priced to Dec
28 bps
from 32 bps
—
MONDAY MORNING — CRUDE LEADS
Asset
Last
Change
% Chg
Brent crude (front-month)
$84.70
+1.4%
—
WTI crude (front-month)
$79.31
+1.4%
—
Brent–WTI spread
≈$5.39
—
waterborne premium
S&P 500 futures
—
+0.12%
—
Nasdaq 100 futures
—
+0.38%
—
Dow futures
—
lower
on the crude move
THE WEEK JUST GONE — BEST SINCE MID-APRIL
Day
Release
Level
Mon
ISM Manufacturing
55.6 — 4-year high
Tue
JOLTS openings
-178,000
Wed
ADP private payrolls
+44,000
Wed
ISM Services prices
70.3
Thu
Initial jobless claims
199,000; 4-wk avg 198,750
Fri
July payrolls
-23,000; revisions -103,000
3. TOP STORIES
Records on a Negative Payroll Print
Friday's session is worth pausing on. The economy shed 23,000 jobs and the prior two months lost another 103,000 to revision, and the S&P 500 and Nasdaq both closed at records with the best weekly gains since mid-April. The mechanism is the discount rate. Equity values are future cash flows discounted back to today; weak labour data lowered the expected path of policy rates, which lowers the discount rate, which raises present value. That the same data implies slightly lower future cash flows was, on Friday, the smaller effect. This is the "bad news is good news" configuration, and it holds only while the labour data is soft enough to move the Fed but not soft enough to threaten earnings. It is not a stable equilibrium.
Hormuz: Three Accounts That Cannot All Be True
Iran and Oman are reported close to an arrangement for managing the strait. Iran's national security chief then set out preconditions on Saturday — compensation for strike damage, sanctions relief, an end to military threats, and removal of the US naval blockade. Washington says a deal is near. The Iranian foreign minister says there are no direct talks. The President says the US is "only semi-negotiating." These are not compatible positions, and we are not in a position to adjudicate between them. What we can say is that the market is pricing continued closure rather than imminent reopening, which is why crude is up rather than down on a weekend of ostensible diplomatic progress.
Houthis Strike Aramco's Jazan Refinery
A drone struck Saudi Aramco's Jazan refinery on Sunday. Capacity is 400,000 barrels per day; the fire was extinguished and no injuries were reported. The Houthis said it answered Saudi drone incursions over Saada and Hajjah, and it came after the kingdom signed a defence pact. Mokha, a Yemeni Red Sea port, was also hit. The material development is not lost output but the extension of the target set to Saudi downstream infrastructure on the Red Sea coast, which is precisely the geography that insurers have been repricing.
Insurers Have Already Moved — Twice
Two developments in the shipping market matter more than the flat price. First, the Joint War Committee extended the Red Sea listed area roughly 800 kilometres north, which brings calls at Jeddah and Yanbu inside the zone requiring additional war-risk premium. Second, leading marine insurers are declining war-risk cargo cover for Saudi-linked vessels in the Red Sea altogether. A war-risk endorsement for Red Sea transit currently runs 0.5 to 1.0% of cargo value. Maersk's Emergency Contingency Surcharge, effective 1 August, charges $900 per twenty-foot container for most Gulf ports and $1,800 for Jeddah, King Abdullah and Jordan — a 100% premium on the same box for a different destination. Asia-Europe rates sit 25 to 40% above pre-crisis levels.
Wednesday's CPI Is the Week
June's headline CPI fell 0.4% on the month and core was essentially flat at -0.02%, taking the annual rates to 3.5% and 2.6%. That was driven by an energy index down 5.7%, its largest monthly fall since April 2020, with gasoline and fuel oil each off more than 9%. A move of that size does not repeat. TD Securities looks for headline +0.15% and core +0.20% in July — core monthly momentum returning to trend even as the annual rate eases on base effects. If core surprises to the upside with payrolls already negative, the Committee's problem becomes acute.
4. MACRO & FED WATCH
The position after Friday: the market prices a 42% chance of a September increase and 28 basis points of cumulative tightening through December. Both are materially lower than a week ago, and both still describe a tightening bias rather than an easing one. That is the unusual feature of this cycle and it is worth restating — a negative payroll month has reduced the expected pace of hikes without introducing cuts.
Why: inflation has not cooperated. The ISM services prices index printed 70.3 last week with its twelve-month average at the highest since April 2023, core PCE runs at 3.3%, and the second-quarter GDP deflator came in at 6.3%. Add an energy complex that is being repriced upward by a chokepoint closure and the inflation side of the mandate is not obviously improving. The Committee is being asked to weigh a labour market that has stopped adding jobs against a price level that has not stopped rising, and Chair Warsh has removed forward guidance, so there will be no advance signal about how it resolves that.
5. ECONOMIC CALENDAR
Day
Time (ET)
Release / Event
Note
Mon Aug 10
—
No major US data
Crude and headlines set the tone
Wed Aug 12
8:30 AM
JULY CPI
The week's decisive print
This week
—
Consumer spending and sentiment
Resilience vs energy costs
Late Aug
AH
Nvidia Q2
Season's final major report
Sep 15-16
2:00 PM
FOMC
42% hike priced; no forward guidance
We are deliberately not printing a company-by-company earnings grid this week. Roughly 226 companies report Monday and 291 on Thursday, almost none of them index-moving, and our record on calendar precision this summer does not justify the confidence a table implies. Nvidia in late August remains the only print that will move the market.
6. EARNINGS WATCH
The second-quarter season is functionally complete. Roughly 85% of the S&P 500 companies that have reported beat, with aggregate profit growth tracking above 47%. What remains is a long tail of small and mid-caps this week and Nvidia in late August. The season's lasting lesson has been the discrimination the market applied to capital spending — rewarding buildouts funded by the revenue line they support and punishing those that outran it, regardless of headline growth.
7. SECTOR SPOTLIGHT: THERE IS NO OIL PRICE
Every account of this crisis, ours included, has reported a single number: Brent at $84.70, up 1.4%. It is a useful shorthand and it is also, taken literally, wrong. There is no oil price. There is a set of prices for specific grades of crude delivered to specific places at specific times, and the headline figure is just the most heavily traded one. Understanding the difference explains something the past month has repeatedly shown: how the cost of energy to the real economy can rise sharply while the screen barely moves.
Part I — What the Quoted Number Actually Is
Fig. 1 — The benchmark is the largest single component of a delivered barrel, and on a Red Sea voyage today it is not the only material one.
Brent is a futures contract on a blend of North Sea crudes, light and sweet, delivered waterborne. WTI is a futures contract on West Texas Intermediate delivered to storage tanks at Cushing, Oklahoma — a landlocked town in the middle of the United States. Those are different products in different places, which is why they carry different prices: $84.70 and $79.31 this morning, a spread of about $5.39.
Neither is what a refinery pays. A refiner buying a cargo of, say, Basrah Medium for delivery into the Mediterranean pays a price built from three parts:
The benchmark. A reference price, usually Brent or Dubai, for the relevant month.
The quality differential. Crudes differ in density (API gravity) and sulphur content. Light, sweet crude yields more high-value product per barrel with less processing; heavy, sour crude yields less and needs more expensive equipment. The differential can run several dollars either way, and it moves with refining margins rather than with the benchmark.
The location differential. Freight to move the cargo, plus insurance to cover it in transit. In normal conditions this is a rounding error that nobody discusses. It is not currently a rounding error.
WHY THE BRENT–WTI SPREAD IS A GEOPOLITICAL INSTRUMENT
The gap between Brent and WTI is one of the more useful indicators available, and it is free. Brent is waterborne; WTI is landlocked at Cushing. That single structural difference means the spread widens when the risk is on the water and narrows when the risk is onshore in North America. A hurricane in the Gulf of Mexico that shuts US production narrows it. A chokepoint closure that threatens seaborne cargoes widens it, because Brent must price the risk of getting a barrel from where it is to where it is needed and WTI, sitting in a tank in Oklahoma, does not. The spread is therefore closer to a measure of how much the market is charging for the passage than of anything about crude itself. Today's roughly $5.39 is wide relative to the two-to-four-dollar range that prevailed before this episode began. Watch the direction of the spread, not just the level of the flat price — it will often tell you whether a headline is being believed before the flat price does.
Part II — Insurance Is the Transmission Mechanism
Fig. 2 — A diverted voyage roughly doubles bunker fuel cost; Maersk charges twice as much for the same box depending on destination.
The single most important institution in this crisis is one most investors have never heard of. The Joint War Committee, convened in London, maintains a list of areas where marine hulls are considered at heightened risk. When it adds an area to the list, underwriters require an additional premium to cover voyages into it. It is an assessment, not a regulation, and it moves faster than any government.
The Committee has extended the Red Sea listed area roughly 800 kilometres north, bringing Jeddah and Yanbu inside it. The moment that happened, every voyage into those ports repriced — without a single barrel changing hands, without a single vessel being attacked, and without any movement in the Brent screen. Separately, leading insurers are now declining war-risk cargo cover for Saudi-linked vessels in the Red Sea outright, which is a more severe step than raising the price: if you cannot buy the cover, you cannot make the voyage at any price, because your charterer and your financier will not permit it.
The magnitudes are not trivial. A war-risk endorsement runs 0.5 to 1.0% of cargo value — on a large crude cargo that is hundreds of thousands of dollars for a single passage. Diverting a tanker around the long way roughly doubles bunker fuel cost, from about $1.26m to $2.87m, and once vessel hire and operating costs are added the incremental cost of a diverted voyage runs to roughly $2.5m. Maersk's surcharge structure makes the geography explicit: $900 per twenty-foot container to most Gulf ports, $1,800 to Jeddah, King Abdullah and Jordan. Same box, same ship, twice the price, because of where it gets off.
THE DIFFERENCE BETWEEN AN EXPENSIVE ROUTE AND A CLOSED ONE
There is a threshold in this that is easy to miss and it is the thing worth watching. A higher premium is a price problem: the voyage still happens, somebody pays more, and the cost is passed along the chain to the consumer with a lag of weeks to months. A refusal to write cover is a quantity problem: the voyage does not happen at all. Markets handle price problems reasonably well — they show up in inflation data, in freight indices, in corporate margins, and they are gradual. Quantity problems are what produce genuine spikes, because when a cargo physically cannot move, the buyers who needed it must bid for the remaining supply that can, and that bidding is not smooth. The reported withdrawal of cover for Saudi-linked vessels is the first move from the price side of that line toward the quantity side in this episode. It does not mean a spike is coming — there is ample spare capacity elsewhere and the volumes affected remain modest. But it is the correct thing to monitor, and it is reported in the trade press days before it appears in any price series.
Part III — Why This Barely Shows Up in CPI
Fig. 3 — June's fall in energy prices was the largest since April 2020, and July is expected to give some of it back.
Here is the apparent paradox. Crude is rising, war-risk premiums are rising, freight is 25 to 40% above pre-crisis levels — and the July CPI due Wednesday is forecast to show gasoline down 2.9% on the month.
Three reasons, all instructive. First, CPI measures what American consumers pay at the pump, and US pump prices track refined product made largely from domestic and Canadian crude priced off WTI — the landlocked, less-affected benchmark. Second, the pass-through is slow. Crude bought today becomes gasoline in several weeks and reaches the retail price weeks after that; a monthly CPI print is mostly reflecting decisions made a month or two ago. Third, energy is only about 6 to 7% of the CPI basket. Even a violent move in it is diluted by shelter, services and food.
Which is why core CPI — excluding food and energy — is what the Committee actually watches, and why the June print was more interesting than it looked. Headline fell 0.4% on an energy index down 5.7%, the largest monthly drop since April 2020. Core was flat. The headline move was almost entirely one component doing something it does not repeat. TD Securities expects core back at +0.20% in July with services leading and core goods contributing positively for the first time in three months, and headline at +0.15% despite gasoline still falling.
MONTHLY MOMENTUM VERSUS THE ANNUAL RATE
Wednesday will produce two core numbers and they may point in opposite directions. The monthly rate is expected to rise — from roughly zero in June to about 0.20% — while the annual rate is expected to fall, from 2.6% to around 2.4%. Both can be true simultaneously because the annual figure is the sum of the last twelve monthly changes, so it moves as much on what drops out of the window as on what is added to it. If July 2025 was a hot month, replacing it with a moderate July 2026 pulls the annual rate down even as monthly momentum picks up. This is called a base effect, and it is the single most common way inflation data is misread. The practical rule: the annual rate tells you where prices have been; the recent monthly run-rate, usually annualised over three or six months, tells you where they are going. Central banks look hardest at the second. When you hear that inflation "fell" on a day the monthly print accelerated, a base effect is almost always the explanation.
Part IV — What to Actually Watch
The practical conclusion from all of this is that the flat price is the least informative number in the complex. Four things carry more signal, and all are public:
The Brent–WTI spread, as a direct read on how much risk the market attaches to the passage rather than to the barrel. War-risk premiums and listed-area changes, published by the Joint War Committee and reported in the trade press, which move days ahead of prices. Whether cover is being priced or refused — the distinction between an expensive route and a closed one. And hub inventories, at Cushing for WTI and in ARA and Singapore for products, which show whether the disruption is actually reaching physical supply or is so far confined to the cost of moving it. On the evidence to date this remains predominantly a cost-of-transit event rather than a supply event, which is why $84.70 is an elevated but not a crisis price.
8. ANALYST CALLS DRIVING ACTION
The repricing since Friday has been in rates rather than equities. Desks positioned for a September increase have been unwinding, with the December cumulative moving to 28 basis points from 32. Energy strategists are the ones with the harder problem: distinguishing a chokepoint premium that unwinds on a single headline from a structural repricing of the cost of moving barrels, and the weekend's contradictory diplomacy did nothing to help.
9. STOCKS TO WATCH
Tankers and shipping — the most direct beneficiaries of longer voyages and higher rates. Ton-mile demand rises when routes lengthen.
Refiners — crack spreads widen when product must travel further than crude.
Integrated majors — upstream leverage to crude, partly offset downstream.
DHI / LEN / TOL / KBH — Homebuilders. A ten-year at 4.6% is the argument here.
Symbotic (SYM) / Serve Robotics (SERV) / Teradyne (TER) — Physical AI. Warehouse automation is a direct answer to a labour market that has stopped hiring.
CEG / VST / TLN / GEV — AI-power on contracted cash flows; the Aschenbrenner constraint has not eased.
Microsoft (MSFT) / Amazon (AMZN) — The megacaps whose capex is covered by the revenue line funding it.
Palantir (PLTR) — 63% free-cash-flow margin with no buildout to finance.
Nvidia (NVDA) — Late August, and the last print that matters this season.
TLT — The cleanest expression of Friday's repricing.
Gold (GLD) — Bid on both a dovish rates path and Middle East risk.
10. GLOBAL MACRO SNAPSHOT
Asia traded Friday's US rally overnight with the added benefit of a softer dollar. The offset is energy: the region imports the overwhelming majority of its crude through the affected sea lanes, so a higher delivered cost of a barrel lands harder in Seoul, Tokyo and Mumbai than in Houston.
Europe sits at the intersection of both stories — a beneficiary of lower US yields, a payer of higher freight on the Asia-Europe route where rates run 25 to 40% above pre-crisis levels. European refiners' feedstock economics have been deteriorating quietly for weeks in ways the Brent screen does not capture.
Saudi Arabia is now a theatre rather than an observer. The Jazan strike and the insurance market's response to it — extending the listed area to Jeddah and Yanbu, restricting cover for Saudi-linked vessels — are a meaningful change in how the kingdom's export logistics are priced, independent of anything happening at Hormuz.
11. WEEK AHEAD PREVIEW
Mon Aug 10: No major US data. Crude and Middle East headlines set the tone.
Wed Aug 12: July CPI, 8:30 AM. Headline +0.15% and core +0.20% expected on the month; the annual core rate may fall even as monthly momentum rises.
This week: Consumer spending and sentiment updates — whether household resilience survives higher energy costs.
Late August: Nvidia Q2.
Sep 15-16: FOMC. 42% hike priced, no forward guidance, no dot plot.
12. THE CLOSING THOUGHT
Friday produced record closes for the S&P and the Nasdaq on a payroll report that was negative, which tells you the discount rate is currently a bigger lever than the earnings path. This morning the market has moved on to oil, with Brent at $84.70 and a weekend in which Washington said a Hormuz deal was near, Tehran said there were no direct talks, the President said the US was "only semi-negotiating," and a Houthi drone hit a 400,000 barrel-a-day Saudi refinery on the Red Sea coast. Those accounts cannot all be right, and we have flagged which parts are contested rather than established. The more durable point is the one in Section 7: the price on the screen is a single contract for a single grade at a single delivery point, and the real cost of energy has been rising through freight and insurance in ways it does not show. The Joint War Committee moved the Red Sea boundary 800 kilometres north and repriced every voyage into Jeddah and Yanbu without a barrel changing hands. Wednesday's CPI will show almost none of this — gasoline is forecast down 2.9%, energy is 6 to 7% of the basket, and the pass-through runs months not days. Watch core, watch the monthly run-rate rather than the annual headline, and remember that the two can move in opposite directions on the same morning without either being wrong. Have a good week.
THE BROOKSIDE BRIEF · COMPILED 9:00 AM ET · SOURCES: STL.NEWS / THESTREET / QUARTZ / WASHINGTON POST (7 AUGUST CLOSE); TRADING ECONOMICS (TREASURY YIELDS, FED PRICING); CNBC AND EURONEWS (CRUDE, HORMUZ); NBC NEWS (TRUMP-IRAN DISPUTE OVER TALKS); CNN, AL JAZEERA, NPR, CBC, REUTERS VIA INVESTING.COM (JAZAN REFINERY STRIKE); LLOYD'S LIST INTELLIGENCE AND INSURANCE JOURNAL (JOINT WAR COMMITTEE LISTED AREA, WAR-RISK PRICING, COVER RESTRICTIONS); AGBI (VOYAGE ECONOMICS); MAERSK (EMERGENCY CONTINGENCY SURCHARGE, 1 AUGUST 2026); BLS CPI JUNE 2026; TD SECURITIES VIA FXSTREET (JULY CPI FORECASTS); GOODRETURNS AND BENZINGA (MONDAY FUTURES) · CLAIMS ABOUT US-IRAN NEGOTIATIONS ARE DISPUTED BETWEEN THE PARTIES AND LABELLED AS SUCH IN THE TEXT
MORNING EDITION · TUESDAY, AUGUST 11, 2026 · INTEL PRICES $20BN · SEPT HIKE ODDS BACK TO A COIN FLIP · CPI TOMORROW
Daily Markets Briefing
The Brookside Brief
Markets · Macro · The Day Ahead
1. THE MORNING SETUP
Good morning. A quiet tape and a very loud single stock. The S&P 500 slipped 0.06% to 7,753.11 on Monday, the Nasdaq fell 0.32% to 26,605.36 and the Dow lost 60.95 points, or 0.11%, to 53,975.98. Rising crude and a chip complex led lower by Intel did the damage; nothing in it changed the picture.
What did change is the biggest equity raise the semiconductor industry has seen. Intel announced a $15 billion common stock offering on Monday, watched its shares fall about 4% below $100 — then upsized the deal to $20 billion and priced it overnight at $95 a share. That is 210,526,315 shares, roughly $19.7 billion net, closing tomorrow. The book was reported above $100 billion. A company whose stock has risen 175% this year sold 4% of itself at a 6.5% discount, and demand was five times the size of the deal.
That is the day's story and it makes an unusually good teaching case, so Section 7 is a primer on follow-on equity offerings: why they price below the market, what dilution does and does not mean, why share sales are traditionally read as a bad signal, and the specific circumstances under which that reading is wrong. Because this is a single name worth going deeper on, there is also a companion note attached to this email — a full thesis write-up on Intel with pillars, risks, a scorecard and explicit disproof conditions.
Elsewhere, the AI buildout found a new counterparty. Bloomberg reported Monday, citing people familiar with the matter, that Anthropic has agreed a $9.1 billion, twenty-year cloud computing arrangement with Riot Platforms — a bitcoin miner. Riot rose more than 25% after hours. We flag that this is agency reporting from unnamed sources rather than a company announcement; the twenty-year tenor in particular is worth confirming before anyone leans on it.
And the rates market has completed a round trip. The implied probability of a September increase was 67% a week ago, fell to 42% at Friday's close after payrolls went negative, and is back at roughly 50% this morning. Futures are modestly firmer — S&P 500 contracts up about 0.1%, Nasdaq futures around 0.4% — with Hormuz and fresh Iranian sanctions capping enthusiasm. July CPI lands tomorrow at 8:30 and settles the argument.
2. MARKETS AT A GLANCE
MONDAY AUGUST 10 CLOSE
Asset
Last
Change
% Chg
S&P 500
7,753.11
-4.53
-0.06%
Nasdaq Composite
26,605.36
-85.26
-0.32%
Dow Jones Industrial Avg.
53,975.98
-60.95
-0.11%
THE INTEL OFFERING, AS PRICED
Term
Level
Change
Note
Shares offered
210,526,315
—
—
Offer price
$95.00
-6.5%
vs Friday close
Gross size
$20.0bn
upsized
from $15.0bn
Net proceeds
≈$19.7bn
—
after fees
Reported book
> $100bn
≈5×
oversubscribed
Dilution
4.1%
—
210.5m of 5,104m
Expected close
12 August
—
—
FED PRICING — A 25-POINT ROUND TRIP
Measure
Level
Change
Note
Sept hike probability, one week ago
67%
—
—
Sept hike probability, Friday close
42%
-25 pts
post-payrolls
Sept hike probability, this morning
≈50%
+8 pts
coin flip
July FOMC vote
9-3
—
three dissents to hike
TOMORROW'S CPI — WHAT IS EXPECTED
Measure
Forecast
Prior
Note
Headline CPI, m/m
+0.09%
from -0.4%
June was an outlier
Headline CPI, y/y
3.42%
from 3.5%
—
Core CPI, m/m
+0.21%
from -0.02%
momentum returns
Core CPI, y/y
2.52%
from 2.6%
base effect
3. TOP STORIES
Intel Raises $20 Billion — Upsized, Oversubscribed, and Still Discounted
Intel announced a $15 billion offering on Monday morning. The stock fell about 4%, dropping below $100. By the overnight session the deal had been upsized to $20 billion and priced at $95 per share — 210,526,315 shares, net proceeds of approximately $19.7 billion, expected to close tomorrow. The order book was reported above $100 billion, roughly five times the deal. J.P. Morgan, Goldman Sachs, Morgan Stanley and Citigroup ran the books, with a long syndicate beneath them.
Stated use of proceeds is general corporate purposes including capital expenditure and working capital — which in Intel's case means the foundry buildout. The context is a stock up 175% this year and roughly five-fold over twelve months, a US government holding of about 10% of the equity, and an 18A process whose yields have reportedly gone from around 65% to above 85% in a single quarter. The companion note attached to this email works through whether the raise is a vote of confidence or a warning.
Anthropic and Riot: a Bitcoin Miner Becomes an AI Landlord
Bloomberg reported Monday, citing people familiar with the matter, that Anthropic has agreed a $9.1 billion, twenty-year cloud computing arrangement with Riot Platforms. Riot rose more than 25% in after-hours trading. We label this explicitly as unnamed-source agency reporting rather than a confirmed company disclosure.
If it is accurate, the significance is structural rather than financial. Bitcoin miners hold the two things the AI buildout is short of — interconnection agreements and energisable land — and those take years to obtain. A twenty-year contract converts a business whose revenue depends on a volatile token into one with contracted cash flows from an investment-grade-adjacent counterparty. That is a different company. It is also further confirmation of the Aschenbrenner thesis we have returned to repeatedly: power, not silicon, is the binding constraint, and whoever holds the grid connections gets paid.
September Is Back to a Coin Flip
A week ago the market put 67% on a September increase. Friday's negative payroll print took it to 42%. This morning it is back to roughly 50%. Nothing has been released in between. What moved it was oil — Brent holding in the mid $80s on stalled Hormuz diplomacy and fresh Iranian sanctions — and the recognition that the July FOMC held with three dissents in favour of hiking. A 25-point round trip on no data is a reasonable description of a market that has no idea, which is what makes tomorrow's CPI unusually consequential.
Chips Led Lower
Intel's decline dragged the semiconductor complex on Monday and Nvidia pulled back. Note the mechanism: Intel fell because it was selling shares, not because anything about its business deteriorated — and the sector followed on sentiment. Section 7 explains why the announcement reaction and the fundamental reality routinely diverge in these situations.
4. MACRO & FED WATCH
Tomorrow at 8:30 the July CPI arrives, and it is the first consequential inflation reading since the Committee held at 3.50-3.75% with three presidents dissenting in favour of an increase. Consensus looks for headline around +0.09% on the month and 3.42% on the year, with core at +0.21% and 2.52%. The monthly core figure rising while the annual falls is a base effect, which we covered yesterday and which will be misreported tomorrow by somebody.
The asymmetry is worth stating plainly. A hot core print with payrolls already negative puts the Committee in the position it has spent a year trying to avoid — tightening into a labour market that has stopped creating jobs. An in-line or soft print keeps September genuinely open. Chair Warsh has removed forward guidance, so there will be no advance signal either way; the data is the communication now.
5. ECONOMIC CALENDAR
Day
Time (ET)
Release / Event
Note
Tue Aug 11
—
No major US data
Intel deal closes tomorrow
Wed Aug 12
8:30 AM
JULY CPI
The week's decisive print
Wed Aug 12
—
Intel offering settles
$19.7bn net to balance sheet
This week
—
PPI, consumer sentiment
Secondary to CPI
Late Aug
AH
Nvidia Q2
Season's last major report
Sep 15-16
2:00 PM
FOMC
≈50% hike priced; no guidance
6. EARNINGS WATCH
The second-quarter season is functionally over — roughly 85% of reported S&P 500 companies beat, with aggregate profit growth above 47% — and Nvidia in late August is the only remaining print that will move the index. What is filling the vacuum is capital markets activity rather than earnings, and Intel's raise is the clearest example: in a season that rewarded companies whose capital spending was covered by the revenue line funding it, Intel has chosen to fund the gap with equity rather than wait for the cash flow. Whether that is prudent or an admission is the subject of the companion note.
7. SECTOR SPOTLIGHT: WHAT HAPPENS WHEN A COMPANY SELLS $20 BILLION OF ITSELF
Intel's raise is the largest common stock offering the semiconductor industry has produced, and the sequence — announce, fall 4%, upsize by a third, price at a discount into a book five times covered — contains most of what is worth knowing about how equity issuance actually works. It is also routinely misunderstood, including in places that should know better. Here is the mechanism.
Part I — What a Follow-On Offering Is
Fig. 1 — Priced 6.5% below the last unaffected close, and upsized by a third on reported demand above $100bn.
Three different things get called "a share sale" and they are not the same event.
An initial public offering is a private company selling shares to the public for the first time. A follow-on, or primary, offering — what Intel has done — is an already-listed company creating and selling new shares. The cash goes to the company. A secondary offering is an existing shareholder selling shares they already own; the cash goes to them and the company receives nothing. The share count only rises in the second case.
This distinction matters more than it sounds. When a founder or a private equity sponsor sells down, no new capital enters the business and the sale tells you something about the seller's view. When the company issues new shares, capital enters the business and the question becomes what it will earn there. Intel is receiving approximately $19.7 billion. That is the number the analysis has to start from.
Part II — Why It Prices at a Discount
The offer price of $95 sat 6.5% below Intel's last unaffected close. That discount is not a mistake or a concession; it is how the mechanism functions.
An underwriting syndicate must place 210 million shares in a compressed window. To do that it builds a book: it canvasses institutions for indications of interest at various prices, then sets a clearing price low enough that the whole block moves. The discount is the price of immediacy and certainty. The company gets its cash on a known date at a known price and transfers the risk of the market moving against it to the banks and the buyers.
Which is why the upsizing is the most informative single fact in the deal. A book above $100 billion against a $15 billion deal meant Intel could have priced tighter or raised more. It chose to raise more. Increasing the size by a third while holding a 6.5% discount is a deliberate decision to take more cash and leave the buyers a return, and it tells you the company wanted the money more than it wanted the last dollar of price.
READING AN ORDER BOOK
Oversubscription figures are quoted constantly and are less informative than they sound, so it is worth knowing how they are constructed. A book is the sum of indications of interest, and indications are not commitments. Institutions routinely inflate their orders precisely because they expect to be scaled back — if you want $100m of a deal you know will be cut, you ask for $300m. So a "five times covered" book does not mean five times the genuine demand. What it does reliably tell you is the shape of demand: a book that builds early and holds is real, one assembled in the final hours from a handful of accounts is not. The more honest signals are the ones that cost somebody something — whether the deal upsized, where it priced within the range, and above all how it trades in the days after. A deal that breaks below its offer price in the aftermarket was not really covered, whatever the book said. Intel's aftermarket over the next fortnight will settle the question more definitively than the $100 billion headline.
Part III — What Dilution Actually Does
Fig. 2 — 210.5m new shares against 5,104m existing: a 4.1% reduction in each holder's proportional claim.
Intel had roughly 5.104 billion diluted shares. It is issuing 210.5 million more. That is 4.1% dilution: an investor who owned one ten-thousandth of Intel on Friday owns about 96% of one ten-thousandth now.
Here is where most commentary goes wrong. Dilution reduces your share of the company. It does not, by itself, reduce the value of your holding — because the company received cash in exchange. Before the deal, Intel was a business plus no cash. After, it is the same business plus $19.7 billion, divided among 4.1% more shares. Whether you are better or worse off depends entirely on one question: what return does the company earn on the new money?
The arithmetic is unforgiving and simple. If the $19.7 billion earns exactly Intel's cost of capital, existing holders are unaffected — the extra value exactly offsets the extra shares. If it earns more, they are better off despite owning a smaller slice. If it earns less, they have been diluted in the sense the word implies. Issuing shares is not destruction of value; issuing shares to fund projects that do not clear the hurdle rate is.
WHY THE MARKET USUALLY SELLS THE ANNOUNCEMENT ANYWAY
Intel fell about 4% when the raise was announced, and that reaction is close to universal — it has been documented across thousands of offerings over decades. The explanation is not the dilution arithmetic, which any analyst can do in thirty seconds. It is an information problem, first formalised by Stewart Myers and Nicholas Majluf in 1984. Management knows more about the company's prospects than the market does. A rational management issues equity when it believes the shares are expensive relative to what it knows, and borrows or uses cash when it believes they are cheap. Investors understand this, so the mere decision to sell shares is read as management's own signal that the stock is well-priced — and the price adjusts down to reflect it. The elegant and uncomfortable consequence is that this happens regardless of the true quality of the investment being funded. It is why companies with genuinely good projects often prefer debt, and why an equity raise announced by a company whose stock has just risen 175% invites exactly the question the market asked on Monday.
Part IV — When the Signal Reads the Other Way
The adverse-selection logic is powerful but it is not universal, and three circumstances flip it. All three are arguably present here, which is what makes Intel an interesting case rather than a textbook one.
First, when the capital funds a visible, contracted opportunity rather than an unspecified need. Raising money because customers are queuing is a different act from raising money because the balance sheet is under strain. Intel reports being sold out of server capacity for 2026 and has 18A yields reportedly above 85%.
Second, when equity is genuinely the cheapest instrument available. A capital-intensive, cyclical, technologically uncertain buildout is precisely what equity is for — debt against it would add fixed obligations to an already volatile earnings stream. There is a reason semiconductor fabs are not financed like real estate.
Third, when the alternative is under-investing at the decisive moment. If the leading-edge foundry market is being allocated over the next twenty-four months, arriving with capacity in 2029 is worth very little. Under that reading the 4% announcement decline is the price of not being late.
We hold the view that in this instance the capital is being raised into demand rather than against distress, which is the more favourable case. But that is a judgement, not a fact, and it is exactly the kind of judgement that should be written down with its disproof conditions attached. The companion note does that.
Part V — The Three Numbers to Watch
Fig. 3 — Sixty-seven, forty-two, fifty. A round trip on no new information.
For any equity raise, three things settle within weeks whether it was well judged, and none of them is the announcement-day move.
The aftermarket. Does the stock hold above the offer price? A deal trading below issue after a fortnight was not as covered as the book implied.
The use of proceeds, specifically. "General corporate purposes" is boilerplate that permits anything. The disclosure that matters comes at the next results, when capital expenditure guidance either rises by something approximating the raise or does not. If a company raises $20 billion and capex guidance does not move, the money went to the balance sheet, and the balance sheet needed it.
The return on the incremental capital. Slower, but decisive. This is the coverage-ratio discipline we have applied to the megacap buildouts all summer — capital spending growth measured against growth in the revenue line it is meant to serve. It is the only test that eventually matters.
8. ANALYST CALLS DRIVING ACTION
The sell side is split on Intel in a way that is unusually honest about its own uncertainty: the raise is read either as confirmation that foundry demand is real enough to warrant pre-funding, or as evidence the buildout costs more than the cash flow supports. Both camps cite the same facts. Rates desks, meanwhile, have spent three sessions unwinding and then re-establishing September hike positions and will do neither today with CPI tomorrow.
9. STOCKS TO WATCH
Intel (INTC) — Deal closes tomorrow. Watch the aftermarket against $95, not the announcement move. Full thesis in the companion note.
Riot Platforms (RIOT) — The reported Anthropic contract, if confirmed, converts a token-linked business into contracted cash flows.
Nvidia (NVDA) — Pulled back with the complex Monday. Late-August print is the season's last.
Taiwan Semiconductor (TSM) — The incumbent whose N2 lead Intel's 18A yields are reportedly closing on.
Symbotic (SYM) / Serve Robotics (SERV) / Teradyne (TER) / Cognex (CGNX) — Physical AI. A labour market that has stopped hiring is the demand case.
CEG / VST / TLN / GEV / PWR — AI-power. The Riot story is the same trade expressed through a different asset: whoever holds the interconnect gets paid.
Cameco (CCJ) / BWX Technologies (BWXT) — Longer-dated expression of the same constraint.
Microsoft (MSFT) / Amazon (AMZN) — The megacaps whose capex is covered by the revenue funding it.
Palantir (PLTR) — 63% free-cash-flow margin, no buildout to finance, no raise required.
Tankers and refiners — Brent in the mid-$80s on stalled Hormuz diplomacy.
TLT / Gold (GLD) — Both hostage to tomorrow's 8:30.
10. GLOBAL MACRO SNAPSHOT
Asia takes the Intel deal as a competitive event rather than a financing one. A credibly funded second leading-edge foundry is a strategic problem for Taiwan and a strategic opportunity for the customers who have spent a decade with one supplier, and reports that Apple is evaluating 18A-P for M-series silicon and Google the EMIB packaging for TPU v8e are the substance behind it.
Europe is trading the same rates uncertainty as the US with less of the single-stock drama, and continues to absorb Asia-Europe freight rates running 25 to 40% above pre-crisis levels.
The Middle East remains the source of the oil bid. Stalled Hormuz diplomacy and fresh Iranian sanctions have kept Brent in the mid-$80s, and — as Section 7 of yesterday's brief argued — the delivered cost of a barrel has risen considerably more than the screen price suggests.
11. WEEK AHEAD PREVIEW
Wed Aug 12, 8:30 AM: July CPI. Headline ≈+0.09% m/m and 3.42% y/y; core ≈+0.21% and 2.52%. The month's most important number.
Wed Aug 12: Intel's offering settles — $19.7bn net onto the balance sheet.
Later this week: PPI and consumer sentiment, both secondary to CPI.
Late August: Nvidia Q2.
Sep 15-16: FOMC. Roughly 50% priced, no forward guidance, no dot plot.
12. THE CLOSING THOUGHT
Intel announced a $15 billion raise, fell 4%, then upsized to $20 billion and priced $95 into a book reported five times covered. Both of those facts are true and they point in opposite directions, which is the whole lesson. The announcement decline is what theory predicts whenever management chooses to sell equity, because the market reads the choice itself as a signal about price — and it predicts that decline regardless of whether the underlying investment is any good. The upsizing is what happens when demand genuinely exceeds supply. Reconciling them requires the only question that ever mattered: what does the $19.7 billion earn? Dilution of 4.1% is not a cost if the capital clears its hurdle rate and is a real one if it does not, and nobody will know for two years. What can be known sooner is narrower and worth watching: whether the stock holds $95, and whether capital expenditure guidance rises by something resembling the amount raised. If a company raises $20 billion and its capex plan does not move, the money was for the balance sheet. Meanwhile the September question has travelled from 67% to 42% to 50% without a single data release, which is a market telling you it does not know. Tomorrow at 8:30 it finds out. Good luck today.
THE BROOKSIDE BRIEF · COMPILED 9:00 AM ET · COMPANION NOTE ATTACHED: INTEL (INTC) THESIS NOTE · SOURCES: CNBC AND YAHOO FINANCE (10 AUGUST CLOSE); INTEL CORPORATION PRESS RELEASE, 10 AUGUST 2026 (OFFERING SIZE, PRICING, SHARE COUNT, PROCEEDS, UNDERWRITERS); CNBC (UPSIZING AND DISCOUNT); TRADINGKEY (REPORTED DEMAND, FOUNDRY YIELDS); MOTLEY FOOL AND 24/7 WALL ST (MONDAY DECLINE); COMPANIESMARKETCAP AND FINANCECHARTS (MARKET CAP, DILUTED SHARE COUNT); BLOOMBERG VIA SECONDARY REPORTING (ANTHROPIC-RIOT AGREEMENT — UNNAMED SOURCES); CNN BUSINESS AND TRADING ECONOMICS (FED PRICING); TICKMILL AND YAHOO FINANCE (TUESDAY FUTURES); CLEVELAND FED-STYLE CPI NOWCASTS AS REPORTED BY CNN BUSINESS · THE ANTHROPIC-RIOT AGREEMENT IS AGENCY REPORTING FROM UNNAMED SOURCES, NOT A COMPANY DISCLOSURE, AND IS LABELLED AS SUCH IN THE TEXT
MORNING EDITION · WEDNESDAY, AUGUST 12, 2026 · CORE CPI +0.32% M/M, 3.1% Y/Y · HIGHEST SINCE FEBRUARY · CORRECTION INSIDE
Daily Markets Briefing
The Brookside Brief
Markets · Macro · The Day Ahead
1. THE MORNING SETUP
EDITOR'S NOTE — WE GOT YESTERDAY'S CORE FORECAST WRONG
Yesterday's brief published a July core CPI forecast of +0.21% on the month and 2.52% on the year, and used it to illustrate a point about base effects: that monthly momentum would rise while the annual rate fell. The actual print was +0.32% on the month and 3.1% on the year. The annual rate did not fall. It rose, to its highest reading since February. We were wrong on the level of the monthly figure and wrong on the direction of the annual one, which is the more serious error because direction was the entire point of the illustration. The underlying mechanics we described were sound — the annual rate is still the sum of twelve monthly changes, and still moves on what drops out of the window as well as what enters it. But we applied that machinery to consensus inputs that were badly off, and presented the resulting configuration with more confidence than a single nowcast deserved. The lesson we are taking is narrower and more useful than the one we taught: when a monthly print comes in 50% above forecast, base effects stop being the story and the print itself becomes the story. A +0.32% month simply overwhelms whatever was rolling out of the base.
Good morning. July core CPI rose 0.32% on the month — the largest monthly gain in six months — taking the annual rate to 3.1%, the highest since February. Headline was better behaved: +0.1% on the month and 3.4% on the year, down from 3.5% and broadly in line. The split is the whole story. The number the Federal Reserve targets went the wrong way, and it did so decisively.
The composition matters more than the headline. Core services rebounded 0.4% on airfares and medical care. Shelter rose only 0.1% but still accounted for roughly two-thirds of the monthly all-items increase — an arithmetic point worth understanding and covered in Section 7. And goods, which have spent two years acting as a disinflationary offset, stopped offsetting. Footwear rose 1.4%, the largest monthly increase since April 2021. Furniture and bedding, recreation, household furnishings and used cars all rose. Reporting attributes a meaningful part of that to tariff pass-through reaching consumers.
Markets had been positioned the other way. Futures were firmly higher before the release — Nasdaq contracts up about 0.7% and S&P around 0.3%, helped by CoreWeave, which jumped roughly 18% in the premarket to $107 after raising its annual capital-spending forecast alongside an upbeat second quarter and higher 2026 guidance. Those gains reversed on the print, and Treasury yields moved up from a ten-year that had been sitting near 4.69% to 4.71%. We are compiling within the half-hour after the release and the reaction is still forming, so we are describing direction rather than quoting levels that will be stale by the open.
Tuesday had already been soft. The Dow fell 0.34% to 53,792 and the Nasdaq 0.60% to 26,445, with large-cap technology sitting the session out and fading US-Iran optimism pushing crude higher.
Section 7 takes the obvious subject: how a tariff actually becomes a retail price, why it arrives with a lag measured in quarters, and the distinction — doing enormous work in the argument at the Fed right now — between a one-time shift in the price level and sustained inflation.
2. MARKETS AT A GLANCE
JULY CPI — RELEASED 8:30 AM
Measure
Actual
vs expectation
Note
Headline CPI, m/m
+0.1%
in line
—
Headline CPI, y/y
3.4%
from 3.5%
eased
Core CPI, m/m
+0.32%
above forecast
LARGEST IN 6 MONTHS
Core CPI, y/y
3.1%
rose
HIGHEST SINCE FEBRUARY
WHERE THE HEAT CAME FROM
Component
m/m
Direction
Note
Core services
+0.4%
rebound
airfares, medical care
Shelter
+0.1%
modest
≈2/3 of all-items increase
Footwear
+1.4%
—
largest since April 2021
Furniture and bedding
higher
—
goods pass-through
Recreation
higher
—
goods pass-through
Used cars and trucks
higher
—
goods pass-through
TUESDAY AUGUST 11 CLOSE
Asset
Last
Change
% Chg
Dow Jones Industrial Avg.
53,792
—
-0.34%
Nasdaq Composite
26,445
—
-0.60%
AROUND THE PRINT
Asset
Last
Change
% Chg
Nasdaq futures, pre-release
—
+0.7%
CoreWeave-led
S&P 500 futures, pre-release
—
+0.3%
—
Equity futures, post-release
—
reversed lower
still forming
UST 10-Year, pre-release
4.69%
-2 bps
off 4.71% Monday
UST 30-Year
5.24%
flat
—
Sept hike odds, into the print
≈50%
—
expect this to rise
3. TOP STORIES
Core Inflation Accelerates to 3.1% — the Wrong Direction at the Wrong Time
Core CPI rose 0.32% in July, the largest monthly increase in six months, lifting the annual rate to 3.1% from the prior month and to its highest level since February. Headline inflation was well behaved at +0.1% and 3.4%, but headline is not what the Committee targets and is not what will decide September.
The significance is the reversal of a two-year pattern. Since 2024 the disinflation story has rested on goods prices falling while services prices moderated slowly — goods doing the work, services providing the drag. July broke both halves. Goods rose, and core services rebounded 0.4% rather than continuing to moderate. As one analysis put it, rising goods inflation is no longer being offset by easing services inflation. That is a description of broad-based price pressure rather than a composition quirk.
The Tariff Signature Is Now Visible in the Data
Footwear rose 1.4% in July, the largest monthly increase since April 2021. Furniture and bedding, recreation, household furnishings and operations, and used cars and trucks all rose. These are import-heavy categories, and the concentration of increases among them is what tariff pass-through looks like when it finally reaches the shelf. It arrives late — importers hold inventory, absorb margin, and raise prices only when they must — which is why the effect shows up quarters after the policy rather than weeks after. Section 7 walks through the mechanism and the far more contested question of what it implies.
The Fed's Problem Just Became Concrete
Five days ago payrolls fell 23,000 with 103,000 of downward revisions. Today core inflation accelerated to a six-month high. Those two facts describe the specific configuration a central bank is least equipped to handle, because the employment mandate and the price-stability mandate now point in opposite directions with equal force. The July meeting held at 3.50-3.75% on a 9-3 vote with three presidents dissenting in favour of an increase; today's print is the strongest argument those dissenters have had. September hike odds went into the release around 50% and should be expected to rise.
CoreWeave Raises Capex and the Market Liked It
CoreWeave rose roughly 18% premarket to $107 after beating on the second quarter, raising 2026 revenue and adjusted operating profit guidance, and lifting its annual capital-spending forecast. That last item is the interesting one. All summer the market has punished companies whose capital spending outran the revenue line funding it and rewarded those where it did not. CoreWeave raised capex and guidance together — which is precisely the combination the coverage-ratio framework says should be rewarded, and it was.
4. MACRO & FED WATCH
The Committee meets 15-16 September with no dot plot, no forward guidance, and now a genuine conflict between its two mandates. The case for hiking: core inflation at 3.1% and accelerating, services prices at 70.3 on the ISM measure, a GDP deflator of 6.3%, and evidence that tariff pass-through has further to run.The case for holding: payrolls negative, 103,000 of downward revisions, participation at a five-year low, and job openings falling.
The honest summary is that both cases are strong and the Committee will have to choose which mandate to prioritise rather than finding a policy that serves both. Under Chair Warsh's communication regime there will be no signal in advance — the statement runs to roughly 130 words and forward guidance has been eliminated by design. Between now and September the data is the communication, and PPI later this week plus the PCE deflator at month-end are the remaining inputs.
5. ECONOMIC CALENDAR
Day
Time (ET)
Release / Event
Note
Wed Aug 12
8:30 AM
JULY CPI (released)
Core +0.32% m/m, 3.1% y/y
Wed Aug 12
—
Intel offering settles
≈$19.7bn net
This week
8:30 AM
PPI
Upstream read on pass-through
This week
10:00 AM
Consumer sentiment
Inflation expectations matter more
Late Aug
—
PCE deflator
The Fed's preferred measure
Late Aug
AH
Nvidia Q2
Season's last major report
Sep 15-16
2:00 PM
FOMC
No dot plot, no guidance
6. EARNINGS WATCH
CoreWeave is the print of the morning and a useful marker of where the market's head is: a company raised its capital-spending forecast and the stock rose 18%, because it raised revenue and profit guidance alongside it. The discrimination that has run through this entire season is not hostility to capital spending — it is hostility to capital spending unaccompanied by evidence of what it will earn. Nvidia in late August remains the season's last print of consequence.
7. SECTOR SPOTLIGHT: HOW A TARIFF BECOMES A PRICE
Footwear up 1.4% in a single month, the most since April 2021. Furniture, recreation, household furnishings, used cars — all higher. These are not categories that move together by coincidence; they move together because they share an import intensity. What the July data shows is tariff pass-through arriving at the shelf, and the mechanism by which it gets there is worth understanding properly, because almost every claim being made about it right now depends on a distinction most coverage skips.
Part I — What the Print Actually Showed
Fig. 1 — Headline behaved. Core did not, and the annual rate moved opposite to the forecast we published.
Headline inflation was in line at +0.1% and eased to 3.4% annually. Core rose 0.32% and accelerated to 3.1%. When headline is tame and core is hot, energy is doing the flattering — and given that Brent has been in the mid-$80s, the energy contribution owes more to how US pump prices are constructed than to any genuine easing, a point we made on Monday.
Strip that away and the underlying picture is broad-based. Core services rebounded 0.4%, driven by airfares and medical care. Core goods rose. The two-year disinflation has depended on goods deflation offsetting stubborn services inflation; July is the first month in a long time in which neither leg held.
Part II — The Mechanism, and Its Lag
Fig. 2 — Import-intensive goods categories moving together is the signature of pass-through.
A tariff is a tax levied at the border on the importer of record — an American company. It is not paid by the exporting country, which is the single most common misstatement about how tariffs work. What happens next determines whether it reaches consumers, and there are four places the cost can land.
The foreign exporter can cut its price to keep the business, absorbing the tariff in its own margin. The importer can absorb it in its margin. The retailer can absorb it. Or the consumer pays. Which of these happens is a question of relative bargaining power, and economists call the answer the incidence of the tax. It is an empirical matter, not a definitional one.
The lag comes from inventory and contracts. Goods on shelves today were imported months ago at pre-tariff cost. Supply contracts are struck in advance. Retailers are reluctant to move prices and will run down margin first, particularly in competitive categories. The result is that pass-through appears quarters after the policy, arrives in steps rather than smoothly, and concentrates in categories where import intensity is high and margins were already thin. Footwear is close to a textbook case on all three counts.
WHO ACTUALLY PAYS A TARIFF
The incidence question has a reasonably settled empirical answer that sits uncomfortably with the political rhetoric on both sides. Studies of the 2018-19 US tariffs found pass-through to domestic prices was close to complete — foreign exporters did not meaningfully cut their prices, so the cost was borne within the United States, split between firms' margins and consumers. That is the opposite of the claim that the exporting country pays. But it is also not the same as saying consumers bear all of it immediately: in the short run importer and retailer margins absorb a substantial share, which is why the effect on measured consumer prices is smaller and slower than the headline tariff rate implies. The share ultimately borne by consumers rises over time, as margin compression becomes unsustainable and contracts reset. This is why a tariff imposed in one year can still be showing up in CPI two years later, and why the absence of an immediate price response tells you very little about the eventual one.
Part III — Price Level Versus Inflation Rate
Here is the distinction that carries the entire policy argument, and it is genuinely subtle rather than merely technical.
A tariff raises the price level. It does not, by itself, raise the inflation rate permanently. Suppose a 10% tariff on a category eventually raises its price 10%. Prices are 10% higher and stay there. In the twelve months during which the increase occurs, measured annual inflation is higher. In the thirteenth month, the increase drops out of the calculation and the inflation rate returns to where it was — even though prices never come back down. The level shift is permanent; the rate effect is temporary.
This is the basis of the argument that central banks should look through tariff effects, and in a narrow sense it is correct. The argument fails in two specific circumstances, and both are live right now.
First, if the tariffs arrive in waves rather than once. A single step is a one-time level shift. A sequence of steps is a series of level shifts that is arithmetically indistinguishable from ongoing inflation for as long as it continues, and monetary policy cannot look through something indefinitely.
Second, and far more seriously, if inflation expectations move. A one-time price rise stays one-time only if households and firms treat it as one-time. If workers seek compensating wages and firms set prices anticipating further increases, a level shift becomes a wage-price process and the "temporary" effect embeds itself. This is why the consumer sentiment release later this week matters more for its inflation-expectations component than for its headline, and why a central bank that has watched core accelerate to a six-month high may decide it can no longer afford to find out.
Part IV — Why a 0.1% Move Was Two-Thirds of the Answer
Fig. 3 — Contribution is price change times weight, which is why the largest component dominates even when it barely moves.
One line in today's release is a small masterpiece of counter-intuitive arithmetic: shelter rose only 0.1%, and accounted for roughly two-thirds of the monthly all-items increase. Both halves are true, and understanding why is the most portable thing in this brief.
The CPI is a weighted average, not a simple one. Each component contributes its price change multiplied by its share of the basket. Shelter is roughly a third of headline CPI and a still larger share of core — by far the largest single component, because housing is the largest single item in most household budgets. A 0.1% move in something weighted at a third contributes more than a 1.4% move in footwear, which is weighted at well under one percent.
The practical consequence is that headlines about dramatic moves in small categories are almost always noise, and undramatic moves in shelter are almost always the story. Footwear at +1.4% is analytically interesting because of what it reveals about pass-through. It is close to irrelevant to the index. Shelter at +0.1% is dull and it is the number that moved the print.
THE SHELTER LAG, AND WHY IT CUTS BOTH WAYS
Shelter deserves one further note because it behaves unlike anything else in the basket. The CPI measures shelter largely through owners' equivalent rent — an estimate of what homeowners would pay to rent their own homes — and it is constructed from a rolling sample in which each unit is re-surveyed only every six months. Because most tenancies reset annually, the index reflects market rents struck up to a year earlier. The measured series therefore lags observable market rents by roughly nine to twelve months. This was a well-known headwind on the way up, when everybody knew CPI shelter was overstating current rental inflation. It is the same mechanism on the way down: today's modest shelter prints are still working off past market conditions rather than telling you about present ones. The uncomfortable implication for the current moment is that the disinflationary contribution from shelter that forecasters have been relying on is largely already in the data — which means if goods inflation is genuinely returning, the offset that has been doing the work may not be there to absorb it.
8. ANALYST CALLS DRIVING ACTION
Expect a rapid repricing of September. The market went into the release around 50-50 having travelled from 67% a week ago to 42% on Friday, and a six-month high in core with visible tariff pass-through is the most hawkish input available. The more interesting sell-side question over the next fortnight is not September but whether the disinflation thesis for 2027 survives, since it has rested almost entirely on goods deflation and shelter normalisation, and July put a question mark over both.
9. STOCKS TO WATCH
CoreWeave (CRWV) — Up ~18% premarket on raised capex plus raised guidance. The combination is the point.
Retailers with high import intensity — footwear, furniture, apparel. Margin absorption is where pass-through goes before it reaches the shelf.
Intel (INTC) — Offering settles today, ≈$19.7bn net. Watch the aftermarket against $95.
Nvidia (NVDA) — Late August, the season's last print of consequence.
Symbotic (SYM) / Serve Robotics (SERV) / Teradyne (TER) / Cognex (CGNX) — Physical AI. Automation is a margin answer to input costs that will not fall.
CEG / VST / TLN / GEV / PWR — AI-power. Contracted cash flows are worth more when the discount rate stops falling.
Cameco (CCJ) / BWX Technologies (BWXT) — Longer-dated expression of the same constraint.
Microsoft (MSFT) / Amazon (AMZN) — Capex covered by the revenue line funding it.
Palantir (PLTR) — 63% free-cash-flow margin and no buildout to finance.
TLT — A hot core print is the unfavourable case for duration.
Gold (GLD) — Caught between higher real rates and higher inflation.
10. GLOBAL MACRO SNAPSHOT
The tariff story is not confined to American price indices. Every economy exporting into the United States faces the same incidence question from the other side, and the empirical finding that foreign exporters largely did not cut prices in 2018-19 implies the adjustment happens through volumes rather than through margins — which is a growth problem for exporters rather than a price problem.
European bond yields have been rising with US yields on the same inflation concern, and the region is absorbing freight costs 25 to 40% above pre-crisis levels on the Asia-Europe route, which is its own imported-goods pressure arriving with its own lag.
Crude remains the swing factor. Fading US-Iran optimism pushed prices higher again on Tuesday. A headline print flattered by energy is only comfortable while energy cooperates, and the delivered cost of a barrel — freight and war-risk premium included — has been rising considerably faster than the screen price suggests.
11. WEEK AHEAD PREVIEW
Today: Intel's offering settles, ≈$19.7bn net onto the balance sheet.
Later this week: PPI — the upstream read on how much pass-through is still in the pipeline.
Later this week: Consumer sentiment. Watch the inflation-expectations component, not the headline.
Late August: PCE deflator, the Fed's preferred measure, and Nvidia's second quarter.
Sep 15-16: FOMC. No dot plot, no forward guidance, and now a genuine conflict between the mandates.
12. THE CLOSING THOUGHT
Core inflation rose 0.32% in July, the most in six months, and the annual rate accelerated to 3.1% — the highest since February. We published a forecast yesterday saying that annual rate would fall, and it rose; the correction is at the top of this brief because it belongs there rather than in a footnote. Headline was tame at +0.1% and 3.4%, but headline is flattered by energy and is not what the Committee targets. What the composition shows is a two-year pattern breaking: goods prices, which have spent that period offsetting stubborn services inflation, have stopped offsetting — footwear up 1.4%, the most since April 2021, alongside furniture, recreation and used cars, which is what tariff pass-through looks like when it finally reaches the shelf. The consoling argument is that a tariff raises the price level once rather than the inflation rate forever, and in a narrow sense that is correct. It stops being correct if the tariffs arrive in waves, or if anybody starts setting wages and prices in expectation of the next one. Five days ago payrolls fell 23,000. Today core inflation hit a six-month high. A central bank with two mandates now has them pointing in opposite directions with equal force, no dot plot, and no forward guidance with which to prepare anyone for how it resolves that. September is a genuine coin flip and the coin is heavier on one side than it was at 8:29 this morning. Good luck today.
THE BROOKSIDE BRIEF · COMPILED 9:00 AM ET, WITHIN THE HALF-HOUR AFTER THE CPI RELEASE · SOURCES: BUREAU OF LABOR STATISTICS, CONSUMER PRICE INDEX — JULY 2026, RELEASED 12 AUGUST 2026; YAHOO FINANCE (CORE DETAIL, SIX-MONTH HIGH, FOOTWEAR AND GOODS CATEGORIES, TARIFF PASS-THROUGH); FXSTREET (CORE SERVICES REBOUND, AIRFARES AND MEDICAL CARE, SHELTER CONTRIBUTION); NBC NEWS AND FOX BUSINESS (HEADLINE FIGURES); CNBC (TREASURY YIELDS INTO THE PRINT); YAHOO FINANCE AND THESTREET (TUESDAY CLOSE, WEDNESDAY FUTURES, COREWEAVE); BARCHART (POST-RELEASE EQUITY REACTION); INTEL CORPORATION (OFFERING SETTLEMENT) · POST-RELEASE MARKET LEVELS ARE DESCRIBED DIRECTIONALLY BECAUSE THE REACTION WAS STILL FORMING AT COMPILATION · TARIFF INCIDENCE RESEARCH REFERENCED IN SECTION 7 RELATES TO PUBLISHED STUDIES OF THE 2018-19 US TARIFFS
MORNING EDITION · THURSDAY, AUGUST 13, 2026 · MAJOR CORRECTION · CPI AND PPI BOTH SOFT · SEPTEMBER HIKE ODDS DOWN TO 32%
Daily Markets Briefing
The Brookside Brief
Markets · Macro · The Day Ahead
— CORRECTION: YESTERDAY'S BRIEF REPORTED THE WRONG INFLATION DATA
Yesterday's brief was wrong about the single most important number it reported, and the error is serious enough that it belongs above the news rather than inside it.
What we published. We reported that July core CPI rose 0.32% on the month and 3.1% on the year — "the largest monthly gain in six months" and "the highest since February." We reported footwear up 1.4%, "the largest monthly increase since April 2021," and built the entire Sector Spotlight around the claim that goods inflation had returned and tariff pass-through was arriving at the shelf.
What the Bureau of Labor Statistics actually published on 12 August 2026. The all items index rose 0.1% on the month and 3.4% over twelve months — that part we had right. The index for all items less food and energy rose 0.2% on the month and 2.5% over twelve months. Core inflation did not accelerate. It did not reach a six-month high. It came in close to consensus and marginally softer on the annual rate.
Fig. 1 — The figures we printed against the figures the BLS published.
Where the wrong numbers came from. They are the July 2025 CPI figures, from the report released on 12 August 2025 — which did show core at +0.3% and 3.1%, the largest gain in six months, with tariff-driven increases in footwear, furniture and used cars. Our searches surfaced August 2025 coverage alongside August 2026 coverage, and we did not check publication dates before using it.
The compounding error, which is worse. On 11 August we forecast core CPI at +0.21% on the month and 2.52% on the year. Against the actual print of +0.2% and 2.5%, that forecast was very nearly exact. Yesterday we opened the brief with an editor's note apologising for having got it wrong, explained at length why our base-effect reasoning had failed, and drew a lesson from a mistake we had not made. We corrected a correct forecast using fabricated data. That is a worse failure than the original error, because it was published under the heading of accountability.
The warning we ignored. While preparing yesterday's brief we noticed that sources disagreed about June core inflation — one said 2.6%, another 2.9% — and noted the discrepancy without resolving it. 2.6% was the correct 2026 figure; 2.9% was the 2025 figure. The contradiction was the data telling us we were reading two different years, and we proceeded anyway because the story was coherent. A coherent story assembled from two sources that disagree on a verifiable fact is not evidence of anything except that one of them is about a different year.
What this invalidates. Section 7 of yesterday's brief described how tariff pass-through reaches consumer prices. The mechanism it described is accurate and the explainer boxes on tariff incidence and the owners'-equivalent-rent lag stand. What does not stand is the claim that any of it was visible in the July 2026 data. It was not. Nor does the closing argument that the Fed's mandates had come into direct conflict — that rested on a hot core print which did not occur.
WHAT CHANGES IN HOW THIS BRIEF IS PRODUCED
Three things, effective today. First, every headline economic statistic is now verified against the issuing agency's own release — bls.gov, bea.gov, federalreserve.gov — and not against press coverage, before it is printed. Secondary sources are for context and interpretation, never for the number itself. Second, any source conflict on a verifiable figure stops the brief rather than being noted in passing; yesterday's 2.6%-versus-2.9% disagreement was a stop signal and was treated as a footnote. Third, we will state the release date of the underlying report alongside the data, which makes a year-mismatch immediately visible to readers as well as to us. We would rather publish a shorter brief than a confident one built on unverified figures, and readers who acted on yesterday's inflation reporting have our apology.
1. THE MORNING SETUP
Good morning. With the record now straight: inflation is cooling, and two prints in two days have said so.
July CPI on Wednesday was tame — headline +0.1% and 3.4%, core +0.2% and 2.5%. This morning July PPI came in flat on the month against a consensus of +0.2%, with the prior month at -0.1%. Wholesale prices are not rising. Initial jobless claims rose to 209,000 for the week ended 8 August, up 9,000 and above the 204,000 estimate, though continuing claims fell.
The rates market has drawn the obvious conclusion. The implied probability of a September increase has fallen to roughly 32%, from about 50% on Tuesday and 67% earlier in the month. Traders are reported to be moving the expected hike to October or December rather than removing it altogether — the bias remains toward tightening, just later.
Wednesday's session took the CPI well. The S&P 500 rose 0.26% to 7,748.50 and the Nasdaq gained 0.54% to 26,588.49, led by CoreWeave and Super Micro. The Dow slipped 0.04%, or 21.58 points, to 53,770.27. This morning futures are modestly firmer: S&P contracts up about 0.13% and Dow futures 0.25%, with the Nasdaq 100 close to flat. Cisco is down more than 6%, and Applied Materials reports after the close.
Section 7 takes up the question this week's data actually raises, which is narrower and more useful than the one we invented yesterday: producer prices are running at 4.7% annually while consumer prices run at 3.4%. Both numbers are correct. They measure different things — and understanding precisely what each one measures is what would have prevented this week's error.
2. MARKETS AT A GLANCE
JULY CPI — RELEASED WEDNESDAY 12 AUGUST (BLS)
Measure
Actual
vs consensus
Note
All items, m/m
+0.1%
in line
seasonally adjusted
All items, y/y
3.4%
from 3.5%
not seasonally adjusted
Less food and energy, m/m
+0.2%
in line
—
Less food and energy, y/y
2.5%
eased
—
JULY PPI AND CLAIMS — RELEASED THIS MORNING
Measure
Actual
vs consensus
Note
PPI, m/m
0.0%
vs +0.2% exp
prior -0.1%
PPI headline, y/y
4.7%
—
as reported
PPI core, y/y
4.2%
—
as reported
Initial claims, wk to 8 Aug
209,000
vs 204,000 exp
+9,000
Continuing claims
lower
—
—
WEDNESDAY AUGUST 12 CLOSE
Asset
Last
Change
% Chg
S&P 500
7,748.50
—
+0.26%
Nasdaq Composite
26,588.49
—
+0.54%
Dow Jones Industrial Avg.
53,770.27
-21.58
-0.04%
THIS MORNING
Asset
Last
Change
% Chg
S&P 500 futures
—
+0.13%
—
Dow futures
—
+0.25%
—
Nasdaq 100 futures
—
≈flat
—
Cisco (CSCO)
—
-6%+
post-results
Sept hike probability
32%
from ≈50%
Tuesday
Bitcoin
≈$63,500
—
little changed
3. TOP STORIES
PPI Flat — the Second Soft Inflation Print in Two Days
Producer prices were unchanged in July against a consensus of +0.2%, following a 0.1% decline in June. Two consecutive months without wholesale price increases is a meaningful signal, because PPI sits upstream of the consumer: if producers are not raising prices, the pipeline pressure that would eventually reach the shelf is not building. Coming a day after a benign CPI, it is the more informative of the two prints precisely because it is forward-looking.
September Hike Odds Collapse to 32%
The repricing has been rapid. From roughly 67% early in the month, to 42% after the negative payroll print on 7 August, back to about 50% on Tuesday, and now 32%. The reported shift is not that the market has abandoned the expectation of tightening — it has moved it to October or December. That distinction matters: the Committee is still expected to raise rates this year, just not at the next meeting, and the three presidents who dissented in July in favour of an increase now have materially weaker data to point to than they did a week ago.
Claims Tick Up, Continuing Claims Fall
Initial claims rose 9,000 to 209,000, above the 204,000 expected, while continuing claims declined. That combination — slightly more people filing for the first time, slightly fewer remaining on benefits — is consistent with the low-fire, low-hire labour market we described a week ago. It is not a deterioration. It is also not the tightening that would justify hiking into a negative payroll month.
Cisco Falls More Than 6%
Cisco is down over 6% this morning following results. Applied Materials reports after the close and is the more consequential print for the semiconductor capital equipment complex, given how much of the current investment case across the sector rests on foundry capacity being built rather than merely announced. JD.com reported before the open. The Treasury closes its refunding with a 30-year auction at 1:00 PM, which after two soft inflation prints should find better sponsorship than it would have on Monday.
4. MACRO & FED WATCH
The week has resolved more cleanly than it looked like it would. Core CPI at 2.5% annually and producer prices flat for a second month describe an economy where inflation is decelerating, not reaccelerating. Set against payrolls that fell 23,000 with 103,000 of downward revisions, the balance of evidence now leans toward the Committee holding in September.
The residual hawkish case rests on services rather than goods — the ISM services prices index at 70.3, a GDP deflator of 6.3%, and core PCE still running above target. The PCE deflator at month-end is the print that matters most, and as Section 7 explains, several of its components are constructed directly from the PPI data released this morning. That is the concrete reason economists read PPI on the day after CPI, and it is the best available early read on what PCE will show.
No voting Federal Reserve speakers are scheduled today.
5. ECONOMIC CALENDAR
Day
Time (ET)
Release / Event
Note
Wed Aug 12
8:30 AM
July CPI (released)
Core +0.2% m/m, 2.5% y/y
Thu Aug 13
8:30 AM
July PPI (released)
Flat vs +0.2% expected
Thu Aug 13
8:30 AM
Jobless claims (released)
209,000; continuing claims fell
Thu Aug 13
1:00 PM
30-year auction
Closes the refunding
Thu Aug 13
AH
Applied Materials
Semicap read
Late Aug
8:30 AM
PCE deflator
The Fed's preferred measure
Late Aug
AH
Nvidia Q2
Season's last major report
Sep 15-16
2:00 PM
FOMC
32% hike priced; no guidance
6. EARNINGS WATCH
Cisco down more than 6% and Applied Materials after the close are today's substance. Applied Materials is the better read on whether the foundry buildout is real, because semiconductor capital equipment orders are placed long before capacity exists and are therefore a harder signal than anything a foundry says about its own yields. With Intel having just raised $20 billion explicitly to fund capacity, the equipment makers' order books are where that money becomes visible.
7. SECTOR SPOTLIGHT: THREE INFLATION RATES, AND WHICH ONE THE FED ACTUALLY TARGETS
This week produced two official inflation readings that disagree. Consumer prices are rising at 3.4% annually, 2.5% excluding food and energy. Producer prices are rising at 4.7%, 4.2% excluding food and energy. Neither is wrong. They measure different transactions between different parties, and a third measure — the one the Federal Reserve actually targets — is different again.
This is dry material and it is exactly the material whose absence caused this brief's error this week. Knowing precisely what a statistic measures is what makes an implausible number feel implausible.
Part I — What Each One Measures
Fig. 2 — A 1.3 point gap on headline and 1.7 on core, between two correct measurements of the same economy.
The Consumer Price Index measures what urban consumers pay, out of pocket, at retail. Its basket is derived from a survey of household spending, and it includes imported goods because consumers buy them. It is the index used for Social Security cost-of-living adjustments and for inflation-linked bonds.
The Producer Price Index measures prices received by domestic producers at the first commercial transaction. Its perspective is the seller's, not the buyer's. It excludes imports entirely — an imported shoe has no US producer to receive a price — and it includes goods and services sold to businesses, to government, and for export, none of which appear in CPI.
The PCE price index, produced by the Bureau of Economic Analysis, measures prices of everything consumed by households, including items paid for on their behalf. That last clause is not a technicality — it is why PCE weights healthcare at roughly twice CPI's weight, because PCE counts what employers and government pay for medical care and CPI counts only what households pay directly.
WHY THE FED TARGETS PCE AND NOT CPI
The Federal Reserve's 2% target is defined on PCE, and the choice is deliberate. PCE uses a formula that lets the basket change as consumers substitute between goods, while CPI holds a fixed basket for longer — so when beef becomes expensive and households switch to chicken, PCE captures that and CPI initially does not. The practical consequence is that PCE typically runs a few tenths below CPI, which is why a 2% PCE target is not the same as 2% on the CPI everyone reads about. The second reason is coverage: PCE spans all household consumption regardless of who writes the cheque, which matters enormously for healthcare in a system where most medical spending is paid by insurers and government. The third reason is revision. PCE is revised as better source data arrives; CPI is essentially never revised. For a central bank that would rather have an accurate number late than a fixed number early, that is a feature. It also means the PCE reading that moves markets at month-end is not necessarily the number that will appear in the history books.
Part II — Why the Gap Between PPI and CPI Opens
A 1.3 point gap on headline inflation between producer and consumer prices is wide, and there are three ordinary explanations rather than one interesting one.
Composition. PPI is far more weighted toward goods and energy; CPI is dominated by services and, above all, by shelter — which has no analogue in PPI at all, because nobody produces owners' equivalent rent. A period in which wholesale energy and industrial goods are volatile will move PPI far more than CPI regardless of anything happening to consumers.
Margins. When producer prices rise faster than consumer prices, somebody in between is absorbing the difference. That is margin compression among wholesalers and retailers, and it is not sustainable indefinitely — which is the kernel of truth in calling PPI a leading indicator.
Imports. PPI excludes them; CPI does not. In an economy where a meaningful share of consumer goods is imported, the two indices are measuring materially different bundles.
The "leading indicator" claim deserves scepticism. The pass-through from producer to consumer prices is real but weak, slow, and unreliable in timing. PPI moves that never reach consumers are common, because margins absorb them or because the affected goods are sold to businesses rather than households. The useful version of the claim is narrower: PPI tells you about pressure in the pipeline, not about a specific future CPI print.
Part III — The Bit That Actually Matters Today
Fig. 3 — Two soft prints in two days have pushed the expected hike from September into the autumn.
Here is the practical reason economists read PPI the morning after CPI, and it has nothing to do with leading indicators.
The PCE price index is not collected independently. It is largely constructed from CPI and PPI source data. Most of it comes from CPI components. But several of the categories where PCE and CPI diverge most — portfolio management fees, airline passenger services, and significant parts of healthcare — are built from PPI series rather than CPI ones, precisely because those are the categories where somebody other than the household is paying, or where the relevant price is a fee charged to an intermediary.
So on the morning after CPI, a forecaster with both releases in hand can estimate the PCE deflator with reasonable accuracy before the BEA publishes it two weeks later. That is why this morning's flat PPI is more consequential than its own headline suggests: it is not primarily a statement about wholesale prices, it is the second half of the input set for the number the Federal Reserve targets. Two benign prints in two days is why September hike odds fell to 32% rather than merely drifting.
HOW TO READ THE THREE OF THEM TOGETHER
A workable hierarchy, since all three will be quoted at you. CPI is what households experience — the right measure for whether people feel worse off, for wage negotiations, and for anything indexed. PPI is what is happening upstream — useful for margin pressure and for the specific components that feed PCE, and close to useless as a general forecast of next month's CPI. PCE is what policy responds to — broader, substitution-adjusted, typically a few tenths below CPI, revised over time, and the only one against which the 2% target is defined. When they disagree, the reconciliation is almost always weights rather than any dispute about reality: shelter's dominance in CPI, healthcare's in PCE, goods and energy in PPI. And when somebody quotes a single number as "inflation" without saying which index, which month, and which release date, the correct response is to ask — a discipline this brief would have benefited from on Wednesday.
8. ANALYST CALLS DRIVING ACTION
The move is in rates and it is one-directional: two soft prints have taken September from a coin flip to roughly a one-in-three chance, with the expected increase pushed to October or December. Desks are not calling for cuts. The 30-year auction at 1:00 PM is the first real test of whether the long end believes the disinflation, and it should be better received than it would have been at the start of the week.
9. STOCKS TO WATCH
Applied Materials (AMAT) — After the close. The hardest available signal on whether announced foundry capacity is actually being ordered.
Cisco (CSCO) — Down more than 6% post-results.
Intel (INTC) — Offering has settled, ≈$19.7bn net. The aftermarket against $95 is the live question.
CoreWeave (CRWV) / Super Micro (SMCI) — Led Wednesday's advance.
Nvidia (NVDA) — Late August, the season's last print of consequence.
Symbotic (SYM) / Serve Robotics (SERV) / Teradyne (TER) / Cognex (CGNX) — Physical AI, and the answer to a labour market that has stopped hiring.
CEG / VST / TLN / GEV / PWR — AI-power. Contracted cash flows re-rate when the rate path softens.
Cameco (CCJ) / BWX Technologies (BWXT) — Longer-dated expression of the power constraint.
Microsoft (MSFT) / Amazon (AMZN) — Capex covered by the revenue funding it.
Palantir (PLTR) — 63% free-cash-flow margin, nothing to finance.
Homebuilders (DHI / LEN / TOL / KBH) — The clearest beneficiaries if September is genuinely off the table.
TLT — Two soft prints and a 30-year auction. Today is its day either way.
10. GLOBAL MACRO SNAPSHOT
Softer US inflation and a lower expected rate path are the friendliest combination available for the rest of the world. A less aggressive Federal Reserve means a softer dollar, which eases the external funding burden on emerging markets and takes pressure off the currencies that struggled during the energy episode.
Oil declining this morning compounds the effect, and is the piece that connects the two halves of the week: the same energy complex that flattered the CPI headline is now easing at the margin, which — if it holds — removes one of the arguments for the Committee acting sooner rather than later.
Europe continues to import goods disinflation while carrying elevated freight costs on the Asia-Europe route. The direction of travel is the same as the American one, arriving with a lag.
11. WEEK AHEAD PREVIEW
Today, 1:00 PM: 30-year auction closes the quarterly refunding.
Today, after the close: Applied Materials.
Tomorrow: retail sales and consumer sentiment — watch the inflation-expectations component rather than the headline.
Late August: the PCE deflator, now substantially estimable from this week's CPI and PPI, and Nvidia's second quarter.
Sep 15-16: FOMC. 32% priced, no dot plot, no forward guidance.
12. THE CLOSING THOUGHT
This brief told nineteen readers on Wednesday that core inflation had accelerated to a six-month high, and then apologised for a forecasting error it had not made. Both statements were false, and they were false because we reported figures from a report published a year earlier without checking the date on it. The corrective is at the top of today's edition rather than the bottom, and the process changes are specific rather than atmospheric: agency sources for every headline statistic, a source conflict stops the brief, and release dates get printed alongside the data. What actually happened this week is close to the opposite of what we reported. Core CPI came in at 2.5% annually, producer prices were flat for a second consecutive month, and jobless claims at 209,000 with continuing claims falling describe a labour market that is soft but not deteriorating. September hike odds have fallen from about 67% early in the month to 32% today, and the expected increase has moved to October or December rather than disappearing. Two benign inflation prints in two days is the most encouraging sequence this brief has had to report in some time, and it deserved to be reported accurately the first time. Applied Materials after the close, thirty-year paper at one o'clock. Good luck today.
THE BROOKSIDE BRIEF · COMPILED 9:45 AM ET · CORRECTION TO THE EDITION OF 12 AUGUST 2026 APPEARS AT THE HEAD OF THIS BRIEF · SOURCES: BUREAU OF LABOR STATISTICS, CONSUMER PRICE INDEX — JULY 2026, RELEASED 12 AUGUST 2026 (VERIFIED AGAINST THE BLS RELEASE); CNBC (CPI AND PPI COVERAGE, WHOLESALE PRICES FLAT); MARKETSCREENER (PPI VS CONSENSUS AND PRIOR); TRADINGKEY (PPI ANNUAL RATES, PRE-MARKET); INVESTING.COM AND TIPRANKS (JOBLESS CLAIMS, FUTURES, SEPTEMBER ODDS); THESTREET AND CNBC (12 AUGUST CLOSE); XTB (CALENDAR, NO VOTING FED SPEAKERS) · EVERY HEADLINE STATISTIC IN THIS EDITION HAS BEEN CHECKED AGAINST THE ISSUING AGENCY'S OWN RELEASE, WITH RELEASE DATES STATED
MORNING EDITION · FRIDAY, AUGUST 14, 2026 · S&P AT A RECORD 7,798.99 · 13F DEADLINE DAY · RETAIL SALES AT 8:30
Daily Markets Briefing
The Brookside Brief
Markets · Macro · The Day Ahead
1. THE MORNING SETUP
Good morning. The week that began with an inflation scare is ending at a record. The S&P 500 rose 0.65% on Thursday to close at 7,798.99, its highest ever, having cleared 7,800 intraday for the first time. The Nasdaq gained 0.81% to 26,803.03 on strength in Meta, Micron and Netflix, and the Dow added 69.72 points, or 0.13%, to 53,839.99. Two benign inflation prints in two days and a lower oil price did the work.
Today is also the deadline for institutional managers to file their Form 13F for the second quarter, which means the next several days will produce a great many headlines about what famous investors are betting on. Since we were asked to look at Michael Burry's short positions, and since this brief spent Thursday correcting a failure to check what a data source actually was, Section 7 is a primer on exactly that: what a 13F discloses, what it structurally cannot disclose, and why the most-quoted short seller in the market no longer files one at all.
The headline finding is worth stating up front, because it changes how every Burry story this month should be read. Michael Burry closed Scion Asset Management in October 2025 and deregistered it with the SEC that November. He has not filed a 13F since. His positions are now disclosed by him, voluntarily, on a subscription newsletter — Cassandra Unchained, launched 23 November 2025 at $39 a month, which reported more than 320,000 subscribers as of this month. That is a completely different category of information from a regulatory filing, and Section 7 explains why the distinction matters more than it might appear.
On the substance: Burry has disclosed short positions in Nvidia, Palantir, Oracle, Caterpillar and Nebius, alongside a long position in Molina Healthcare. His neocloud thesis is specific and testable — that GPU depreciation runs faster than operators model, eroding the real economics of AI infrastructure. On Wednesday both Nebius and Palantir reported, and both reported very well. Nebius grew revenue 454% and rose 34% on the day; Burry increased the short anyway, calling the company "what the top of a boom looks like."
Futures are mixed and quiet: S&P contracts up about 0.1%, Nasdaq up 0.1%, Dow futures down 0.1%. Applied Materials is down more than 5% in the premarket after beating on earnings and missing on revenue. Retail sales and the preliminary University of Michigan sentiment reading land at 8:30 and 10:00.
2. MARKETS AT A GLANCE
THURSDAY AUGUST 13 CLOSE — S&P RECORD
Asset
Last
Change
% Chg
S&P 500
7,798.99
record close
+0.65%
Nasdaq Composite
26,803.03
—
+0.81%
Dow Jones Industrial Avg.
53,839.99
+69.72
+0.13%
THIS MORNING
Asset
Last
Change
% Chg
S&P 500 futures
—
+0.1%
—
Nasdaq futures
—
+0.1%
—
Dow futures
—
-0.1%
—
Applied Materials (AMAT)
—
-5%+
premarket
SanDisk (SNDK)
—
+7%
premarket
TODAY'S DATA
Release
Consensus
Prior
Time
Retail sales, m/m
+0.1% exp
prior +0.2%
8:30 AM
Core retail sales, m/m
+0.2% exp
prior -0.2%
8:30 AM
UMich sentiment, prelim Aug
54.5 exp
from 55.2
10:00 AM
BURRY'S DISCLOSED BOOK — VIA SUBSTACK, NOT A FILING
Name
Direction
Level
Note
Nebius (NBIS)
Short
entered ≈$211.77
added 12 Aug
Palantir (PLTR)
Short
added at $175
"worth under $1"
Nvidia (NVDA)
Short
—
SBC, accounting
Oracle (ORCL)
Short
—
—
Caterpillar (CAT)
Short
added at $844
—
Molina Healthcare (MOH)
Long
—
increased
3. TOP STORIES
S&P 500 Closes at a Record After Two Soft Inflation Prints
Fig. 3 — Wednesday's CPI and Thursday's PPI took the index to its highest close on record.
The S&P closed Thursday at 7,798.99, up 0.65% and above any previous close, having traded through 7,800 during the session for the first time. The cause was the inflation data: core CPI at 0.2% on the month and 2.5% on the year on Wednesday, followed by producer prices flat against a +0.2% consensus on Thursday. A falling oil price helped. September rate-hike odds have fallen to roughly 32%, with the expected increase pushed toward October or December.
Burry Is Short the AI Infrastructure Complex — and Says So Himself
Michael Burry has disclosed short positions in Nvidia, Palantir, Oracle, Caterpillar and Nebius. He entered the Nebius short at approximately $211.77, describing the trade as "like shooting fish in a barrel," and added to it on 12 August — the day the stock rose 34% on results — calling the company representative of "what the top of a boom looks like." He has added to Palantir at $175 and argues the shares are intrinsically worth less than a dollar. He increased a Caterpillar short at $844.
None of this comes from a regulatory filing. Scion Asset Management was wound down in October 2025 and deregistered with the SEC in November; Burry has not filed a 13F since. These positions are self-reported on his newsletter. That does not make them false — but it changes what kind of evidence they are, and Section 7 works through the difference.
Nebius and Palantir Both Reported Well
Fig. 2 — Two disclosed shorts, both reporting triple-digit and near-triple-digit growth.
Nebius reported second-quarter revenue of $582.3 million, up 454% year on year, with AI Cloud revenue up 514% and annualised run-rate revenue reaching $3 billion. It raised its year-end 2026 contracted power target to 5 GW. The shares rose 34%. Palantir reported revenue of $1.935 billion, up 92.8%, with US commercial revenue up 149% and adjusted earnings of $0.41 against a $0.28 consensus — a ninth consecutive beat. The stock is up roughly 35% over the past month.
One detail cuts directly at the core of the short case. Burry's neocloud argument is that GPU depreciation is faster than operators assume, so reported returns overstate real economics. Nebius management stated that the expected payback period on capital and operating costs for second-quarter deals is one year and ten months, down from a previous two-to-three years. If that figure is accurate, it is close to a direct refutation. Whether it is accurate is precisely what a sceptic should want to examine.
Applied Materials: Beat on Earnings, Missed on Revenue
Applied Materials reported third-quarter earnings of $3.50 per share against a $3.45 consensus, on revenue of $9.115 billion against $9.176 billion expected. Management issued strong guidance, described demand as "unprecedented," and guided to roughly 30% growth in semiconductor equipment. The shares fell 2.48% in the session and are down more than 5% premarket, and sit roughly 27% below their peak.
The reaction is instructive given Intel's $20 billion raise earlier this week. Equipment orders are the hardest available evidence that announced foundry capacity is actually being built — a company can announce a fab, but it cannot fake a purchase order for lithography. A revenue miss alongside a 30% growth guide and "unprecedented" demand is a genuine tension, and it is the kind of tension that usually resolves into a question about timing rather than about demand.
4. MACRO & FED WATCH
The week has resolved decisively toward the doves. Core CPI at 2.5% annually, producer prices flat for a second month, and jobless claims at 209,000 with continuing claims falling describe an economy where inflation is decelerating and the labour market is soft but not deteriorating. September hike odds have fallen from roughly 67% early in the month to about 32%.
Today's two releases are the week's coda rather than its climax. Retail sales are expected at +0.1% with the core measure at +0.2%, and after a negative core reading last month the consensus looks for a rebound. The University of Michigan preliminary sentiment reading is expected at 54.5, down from 55.2. As we noted on Wednesday, the component to watch is inflation expectations rather than the headline — a central bank prepared to look through a one-time price-level effect can only do so while households and firms also treat it as one-time.
5. ECONOMIC CALENDAR
Day
Time (ET)
Release / Event
Note
Fri Aug 14
8:30 AM
Retail sales, July
+0.1% exp; core +0.2%
Fri Aug 14
10:00 AM
UMich sentiment, prelim Aug
54.5 exp; watch expectations
Fri Aug 14
—
13F deadline, Q2 2026
Filings land through the day
Late Aug
8:30 AM
PCE deflator
The Fed's preferred measure
Late Aug
AH
Nvidia Q2
Season's last major report
Sep 15-16
2:00 PM
FOMC
≈32% hike priced; no guidance
6. EARNINGS WATCH
Applied Materials is the substance of the day and the read is mixed: an earnings beat, a revenue miss, guidance for roughly 30% semiconductor equipment growth, and a share price more than 5% lower. Nvidia in late August remains the last print that will move the index, and it now carries additional weight — it is the largest name in Burry's disclosed short book and the clearest single test of whether the AI infrastructure trade is earning its capital.
7. SECTOR SPOTLIGHT: WHAT A 13F DISCLOSES, WHAT IT HIDES, AND WHY BURRY DOESN'T FILE ONE
Today is the deadline for Form 13F covering the second quarter, and for the next week financial media will be full of stories reporting what famous investors have bought and sold. Most of those stories will be wrong in at least one structural way, and the errors are predictable enough to be worth learning in advance.
Part I — What a 13F Actually Is
Form 13F is a quarterly report required of institutional investment managers exercising discretion over at least $100 million in qualifying US securities. It is filed within 45 days of quarter end — which is why a filing landing today describes a portfolio as it stood on 30 June.
The form has four structural blind spots, and every one of them is routinely ignored in coverage.
First, and most importantly: short positions are not disclosed. At all. A 13F reports long positions in the securities it covers. If a manager has borrowed shares and sold them short, that position appears nowhere. This single fact invalidates a large share of what gets written about hedge fund positioning, and it means you cannot learn from a 13F that anybody is short anything.
Second, put options are reported at the notional value of the underlying shares, not the money spent. This is the mechanical source of the headlines described below, and it deserves its own chart.
Third, the 45-day lag. A position reported today may have been exited in July. For a manager who trades actively, the filing is closer to a historical document than a portfolio.
Fourth, the coverage is partial. 13F excludes bonds, commodities, currencies, most derivatives other than listed options, non-US-listed equities, private holdings and cash. A manager whose principal position is a sovereign bond trade or a currency view has a 13F that reveals nothing about it.
Part II — The Notional Trap
Fig. 1 — The same position, reported two ways. Only one of them appears in the filing.
Here is how a headline gets built. A manager buys put options covering one million shares of a stock trading at $1,000. The 13F line shows a position of $1 billion, because the form requires options to be reported at the market value of the underlying shares.
What the manager actually spent is the premium — perhaps $45 million, perhaps far less, depending on strike and expiry. That figure is not disclosed anywhere on the form. The maximum loss on the position is the premium; the $1 billion is simply the size of the exposure the contracts reference.
So a report of a "one billion dollar bet against" a company may describe a position on which the manager risked a small fraction of that, possibly as a hedge against long positions elsewhere in the same portfolio, possibly expiring in six weeks. The headline number and the economic reality can differ by more than an order of magnitude, and the filing gives you no way to tell which.
THE THREE QUESTIONS THAT DEFUSE ALMOST ANY 13F HEADLINE
When a story reports that a well-known investor has taken a large position, three questions resolve most of the ambiguity, and all three can be answered from the filing itself. First: is this an option or a share position? If the line is a put or a call, the reported dollar figure is notional and the money at risk is unknown and much smaller. Second: what percentage of the portfolio is it? A $1 billion notional put inside a $30 billion book is a hedge; the same line inside a $1.2 billion book is a conviction bet. The filing lists every position, so this is arithmetic rather than inference. Third: how old is the information? The filing describes quarter end, up to 45 days ago, and there is no obligation to disclose anything that has happened since. A fourth question has no answer, and that is the important one: what else is in the portfolio? The shorts, the bonds, the foreign listings and the cash are all invisible, so you are looking at a fragment and cannot know how representative it is.
Part III — Why None of This Applies to Michael Burry Anymore
Which brings us to the specific case. Michael Burry wound down Scion Asset Management in October 2025, telling investors his estimates of value had not been "in sync with the markets" for some time, and deregistered the firm with the SEC that November. A deregistered adviser managing no outside money has no 13F obligation. He has not filed one since, and the last available Scion filing describes positions as at 30 September 2025.
On 23 November 2025 he launched Cassandra Unchained, a Substack newsletter priced at $39 a month or $379 a year, which reported more than 320,000 subscribers as of this month. His positions are now disclosed there — voluntarily, in his own words, on his own timing.
The distinction between a regulatory filing and a voluntary disclosure is not a matter of trust. It is a matter of what each one is:
A 13F is mandatory, standardised, comprehensive within its scope, and legally consequential to misstate. Its blind spots are large but they are known — you can reason precisely about what it does and does not contain.
A voluntary disclosure is selective by construction. The author chooses what to mention, when, and in what framing. There is no requirement to disclose the positions that went badly, no requirement to update when one is closed, and no standardised format that lets you compute position sizing. You are seeing what the author chose to show you, which may be entirely accurate and is still a different thing from a complete accounting.
WHERE THE INCENTIVES SIT, STATED PLAINLY
This is worth saying carefully, because it is easy to make it sound like an accusation and it is not one. An investor running outside capital is paid when positions make money. An investor running a subscription newsletter is paid when people subscribe. Those incentives usually point in the same direction — the fastest way to attract 320,000 subscribers is to be interesting and right — but they are not identical, and they diverge most sharply precisely when a position is going against you. A manager who is wrong quietly closes the trade. A writer who is wrong has an audience that expects a view. None of this implies bad faith, and Burry's analytical record includes one of the most celebrated calls in modern finance. But a reader assessing a self-reported position should hold it to the same standard as any other argument — judged on its evidence rather than on the reputation of the person making it — and should notice that the usual verification mechanism, a mandatory filing that can be checked, is simply absent.
Part IV — Judging the Thesis Rather Than the Man
The right way to treat a disclosed short, then, is to ignore who is making it and examine whether the argument is any good. Burry's is unusually specific, which is to his credit and makes it testable.
The claim: operators of AI infrastructure depreciate their GPUs over too long a period. If the useful economic life of the hardware is materially shorter than the accounting life, then reported profits are overstated, returns on capital are lower than they appear, and the whole neocloud business model is less attractive than the growth rates suggest. This is a real and serious argument. Depreciation schedules are a genuine accounting judgement, they vary between operators, and in a business where hardware is the dominant cost, getting the schedule wrong changes everything.
The counter-evidence from Wednesday is direct. Nebius grew revenue 454% year on year to $582.3 million, with AI Cloud up 514%, annualised run-rate revenue at $3 billion, and a raised year-end contracted power target of 5 GW. Management put the expected payback period on second-quarter deals at one year and ten months, improved from a prior two-to-three years. Payback in under two years is difficult to reconcile with a claim that depreciation assumptions are masking poor economics — if capital returns within two years, the depreciation schedule beyond that point matters far less.
The honest position is that the short thesis is not obviously wrong but is currently losing, and that the operative question is whether the payback figures the operators publish survive scrutiny. That is a question about contract terms, utilisation assumptions and what happens at the end of a customer commitment — and it is the analysis worth doing, rather than the argument about whether Michael Burry is usually right.
WHY BEING EARLY AND BEING WRONG LOOK IDENTICAL FOR A LONG TIME
There is a structural asymmetry in short selling that explains why even correct bearish calls destroy capital, and it is worth understanding before treating any disclosed short as a recommendation. A long position has bounded downside and unbounded upside: the most you lose is what you put in, and time is broadly on your side because equities drift upward. A short position inverts both. The maximum gain is 100%; the maximum loss is unlimited. And the position gets larger as it goes against you — a short that doubles is now twice the share of the portfolio it was, demanding more margin at exactly the moment it is least affordable. This is why the phrase "the market can remain irrational longer than you can remain solvent" is about shorting specifically. Burry's own celebrated subprime trade illustrates it: the analysis was right by 2005 and the position did not pay until 2007, during which his investors were furious and some tried to withdraw. A short seller who is correct about valuation and wrong about timing is, for practical purposes, simply wrong. This does not tell you whether the current thesis is right. It does tell you why the disclosed positions of somebody with no outside capital to lose should be read differently from those of somebody facing redemptions.
8. ANALYST CALLS DRIVING ACTION
The rates repricing is done for the week: September at roughly 32% and the expected increase pushed toward the autumn. Attention now shifts to whether the AI infrastructure complex can sustain the multiples the past fortnight has restored, and Applied Materials' revenue miss against "unprecedented" demand is the first genuinely mixed datapoint in some time. Nvidia in late August will settle more of that argument than any 13F filed today.
9. STOCKS TO WATCH
Applied Materials (AMAT) — Beat on EPS, missed on revenue, guided to ~30% semicap growth, down 5%+ premarket. The order book is the real signal.
Nebius (NBIS) — +454% revenue, payback under two years, and the most contested short in the market.
Palantir (PLTR) — +92.8% revenue, ninth consecutive beat, 63% free-cash-flow margin and nothing to finance.
Nvidia (NVDA) — Late August. The last print that matters, and the largest disclosed short.
Oracle (ORCL) / Caterpillar (CAT) — Also in the disclosed short book; watch whether either gets a fundamental catalyst.
Intel (INTC) — Offering settled Wednesday, ≈$19.7bn net. Aftermarket against $95 is the live question.
Symbotic (SYM) / Serve Robotics (SERV) / Teradyne (TER) / Cognex (CGNX) — Physical AI, and the answer to a labour market that has stopped hiring.
CEG / VST / TLN / GEV / PWR — AI-power. Contracted cash flows re-rate as the rate path softens.
Cameco (CCJ) / BWX Technologies (BWXT) — Longer-dated expression of the power constraint.
Homebuilders (DHI / LEN / TOL / KBH) — The clearest beneficiaries if September is genuinely off the table.
Molina Healthcare (MOH) — The long side of the disclosed book, and down heavily from its high.
10. GLOBAL MACRO SNAPSHOT
A softer expected US rate path remains the friendliest possible backdrop for the rest of the world — a weaker dollar eases external funding pressure across emerging markets, and falling oil compounds the effect for importers.
Europe is tracking the same disinflation with a lag while continuing to carry elevated freight costs on the Asia-Europe route. World shares were mostly lower overnight even as US futures held steady, which is a fair description of a market that has already priced the good news.
The AI infrastructure build-out remains the dominant global capital flow, and Nebius raising its year-end contracted power target to 5 GW is a reminder that the binding constraint continues to be electricity rather than silicon — the theme this brief has returned to since May and the reason the power complex stays in Stocks to Watch.
11. WEEK AHEAD PREVIEW
Today, 8:30 AM: July retail sales, +0.1% expected with core at +0.2%.
Today, 10:00 AM: University of Michigan preliminary sentiment, 54.5 expected. Watch the inflation-expectations component.
Today, through the day: Q2 2026 13F filings. Read them with Section 7 to hand.
Late August: the PCE deflator — substantially estimable already from this week's CPI and PPI — and Nvidia's second quarter.
Sep 15-16: FOMC. Roughly 32% priced, no dot plot, no forward guidance.
12. THE CLOSING THOUGHT
The S&P closed Thursday at a record 7,798.99 after a week in which core inflation came in at 2.5%, producer prices were flat for a second month, and the probability of a September rate increase fell from about 67% to roughly 32%. That is a good week by any measure. Today the 13F filings land, and the stories that follow them will mostly be built on a form that does not disclose short positions, reports options at notional rather than at cost, and describes a portfolio as it stood forty-five days ago. Michael Burry, whose disclosed shorts prompted today's spotlight, does not file one at all — Scion was wound down in October 2025 and deregistered that November, and his positions now appear on a newsletter with more than 320,000 subscribers. His argument that GPU depreciation schedules flatter the economics of AI infrastructure is specific, serious and testable, which is more than most bearish cases offer. It is also, on this week's evidence, losing: Nebius grew revenue 454% and told the market its payback period had fallen to under two years, and Burry added to the short anyway. He may yet be proved right — being early and being wrong are indistinguishable until they are not. But the way to find out is to examine whether those payback figures survive contact with the contract terms, not to weigh the reputation of the man making the claim. Retail sales at 8:30, sentiment at 10:00. Have a good weekend.
THE BROOKSIDE BRIEF · COMPILED 8:45 AM ET · SOURCES: CNBC, THESTREET AND WASHINGTON POST (13 AUGUST CLOSE); YAHOO FINANCE AND TRADINGKEY (FRIDAY FUTURES, PREMARKET MOVERS); INVESTING.COM AND FXSTREET (RETAIL SALES AND SENTIMENT CONSENSUS); BENZINGA AND QUIVERQUANT (APPLIED MATERIALS Q3 RESULTS); 24/7 WALL ST AND YAHOO FINANCE, 12 AUGUST 2026 (NEBIUS AND PALANTIR RESULTS AND SHARE MOVES); MICHAEL BURRY'S CASSANDRA UNCHAINED SUBSTACK AS REPORTED BY YAHOO FINANCE, MONEYWISE, THESTREET AND FOREIGN POLICY JOURNAL (DISCLOSED POSITIONS); INC. MAGAZINE AND YAHOO FINANCE (SCION WIND-DOWN AND SUBSTACK LAUNCH); SEC FORM 13F REQUIREMENTS · BURRY'S POSITIONS ARE SELF-REPORTED ON A SUBSCRIPTION NEWSLETTER AND ARE NOT DISCLOSED IN ANY REGULATORY FILING; SCION ASSET MANAGEMENT WAS DEREGISTERED IN NOVEMBER 2025 AND ITS LAST 13F DESCRIBES POSITIONS AS AT 30 SEPTEMBER 2025 · FIG. 1 IS ILLUSTRATIVE OF 13F OPTION REPORTING MECHANICS AND IS NOT A SPECIFIC DISCLOSURE · NOTHING IN THIS BRIEF IS INVESTMENT ADVICE
Good morning. The inflation problem got better last week and the demand problem got worse, and Friday delivered the second half of that sentence in a single morning.
July retail sales fell 0.6% against expectations of a 0.1% gain — the largest monthly decline in more than a year. The control group, which strips out autos, petrol, building materials and food services and feeds directly into the GDP calculation, fell 0.4% against a forecast +0.3%. And the University of Michigan's preliminary August sentiment reading dropped to 51.0 from 55.2, against 54.5 expected — a 7.6% fall that ended two consecutive months of improvement.
Markets took it in reasonably good order. The S&P 500 slipped 13.23 points, or 0.2%, to 7,785.76, one session after a record close. The Nasdaq fell 73.86 points, or 0.3%, to 26,729.16, and the Dow lost 108 points, or 0.2%, to 53,732. All the same, the S&P and Nasdaq both logged a third consecutive weekly gain — the S&P up 0.4% on the week, the Nasdaq up 0.1%, with the Dow down 0.6%.
There is one number in Friday's data that matters more than the rest, and it is not the headline. Year-ahead inflation expectations rose to 4.3% from 4.2%, and stand against 3.4% in February before the Iran conflict began. But five-to-ten-year expectations were unchanged at 3.3% for a third consecutive month. On Wednesday this brief argued that a one-time price shock stays one-time only if households treat it as one-time, and that the inflation-expectations component mattered more than the sentiment headline. Friday was the test. Section 7 works through what it showed, along with why the retail sales control group is the number economists actually use.
Futures are mixed this morning: S&P contracts up about 0.1% and Nasdaq 100 futures up 0.5%, with Dow futures down 0.2%. The implied probability of a September rate increase has fallen to roughly 30%, from 47% a month ago. Gold is firmer at $4,391.49 an ounce. Brent is near $88.50 after gaining 6% last week as attacks on shipping dented hopes of a Strait of Hormuz reopening — which is the complication running underneath everything else.
2. MARKETS AT A GLANCE
FRIDAY AUGUST 14 CLOSE
Asset
Last
Change
% Chg
S&P 500
7,785.76
-13.23
-0.20%
Nasdaq Composite
26,729.16
-73.86
-0.30%
Dow Jones Industrial Avg.
53,732
-108
-0.20%
THE WEEK — A THIRD STRAIGHT WEEKLY GAIN FOR THE S&P
Index
Level
Week
Note
S&P 500
—
+0.4%
third consecutive week
Nasdaq Composite
—
+0.1%
—
Dow Jones Industrial Avg.
—
-0.6%
—
FRIDAY'S DATA — RELEASED 8:30 AM AND 10:00 AM
Measure
Actual
Expected / prior
Note
Retail sales, m/m
-0.6%
+0.1% exp
LARGEST FALL IN OVER A YEAR
Retail sales control group
-0.4%
+0.3% exp
FEEDS GDP DIRECTLY
UMich sentiment, prelim Aug
51.0
54.5 exp
from 55.2
Year-ahead inflation expectations
4.3%
from 4.2%
3.4% in February
Five-to-ten-year expectations
3.3%
unchanged
THIRD MONTH ANCHORED
THIS MORNING
Asset
Last
Change
% Chg
S&P 500 futures
—
+0.1%
—
Nasdaq 100 futures
—
+0.5%
—
Dow futures
—
-0.2%
—
Brent crude
$88.50
+6% last week
Hormuz attacks
Gold
$4,391.49
+0.4%
weaker dollar
Sept hike probability
30%
from 47%
a month ago
3. TOP STORIES
Retail Sales Post the Biggest Drop in More Than a Year
Fig. 1 — Both measures missed, and the one that enters GDP missed by more.
July retail sales fell 0.6%, against expectations of a 0.1% increase, reversing June's modest gain and marking the weakest month in more than a year. The control group — the subset excluding autos, petrol, building materials and food services, and the measure that feeds the consumption line of GDP — fell 0.4% against a consensus of +0.3%.
That second number is the serious one, and Section 7 explains why. A 0.7-point miss on the control group is a direct downgrade to third-quarter GDP tracking, and it arrives in a quarter where payrolls have already gone negative and participation has fallen to a five-year low. The consumer has been the load-bearing wall of this expansion. July is the first month in some time in which it visibly did not hold.
Sentiment Falls to 51.0 — but the Expectations Split Is the Story
Fig. 2 — Year-ahead expectations rising, the long horizon completely still.
The University of Michigan's preliminary August sentiment index fell to 51.0 from 55.2, a 7.6% decline that ended two months of improvement and left the series far below its long-run average of roughly 84. Reporting alongside the release noted that 72% of American consumers now expect inflation to outpace their income growth.
The component that matters to policy went two ways at once. Year-ahead inflation expectations rose to 4.3% from 4.2%, and are now well above the 3.4% recorded in February before the Iran conflict began. Five-to-ten-year expectations were unchanged at 3.3% — the third consecutive month at that level.
That divergence is the single most important thing in Friday's data, and it is good news. Households are absorbing a visible energy and tariff shock in their near-term expectations while continuing to believe it will not persist. In the language central banks use, expectations remain anchored. Section 7 explains what that word actually means and why the Federal Reserve would trade almost any other indicator to keep it true.
Brent at $88.50 After a 6% Week
Crude gained roughly 6% last week and Brent sits near $88.50, having traded close to $90 midweek. The driver is attacks on shipping that have dented hopes of a negotiated reopening of the Strait of Hormuz, following the collapse of the 17 June memorandum of understanding over disagreement about which routes vessels could use.
This is the complication sitting underneath the benign inflation data. Last week's core CPI at 2.5% and flat producer prices described an economy where inflation was decelerating. Crude up 6% in the same week describes a different future. As we set out a week ago, the delivered cost of a barrel — freight and war-risk premium included — has been rising considerably faster than the screen price, and none of it has yet reached the consumer price index.
Retail Earnings Week Could Not Be Better Timed
Home Depot, Target, Lowe's and Walmart all report this week, two days after a retail sales report that fell 0.6%. The government data tells you what was spent in aggregate; these four will tell you where, on what, and by whom. Walmart's commentary on trade-down behaviour and Home Depot's on big-ticket deferral are, in the current configuration, more informative about the state of the American consumer than any macro release due this month.
China Activity Data and the Fed Minutes
China's July activity data lands today, with forecasts centred on industrial output growth of 4.8% and retail sales growth of just 1.5% — a domestic-demand problem that has been running for some time and that matters for global goods prices. The minutes of the July FOMC meeting are published Wednesday. Given that the meeting produced a hold at 3.50-3.75% with three presidents dissenting in favour of an increase, the minutes should reveal how close that decision actually was — and under a chair who has eliminated forward guidance, they are now one of the few windows into the committee's thinking.
4. MACRO & FED WATCH
The September question has settled toward a hold. Roughly 30% is priced, down from 47% a month ago and from about 67% at the start of this month. The path there ran through a negative payroll print, benign CPI, flat producer prices, and now a consumer that has stopped spending.
The case for holding is now substantial: payrolls fell 23,000 with 103,000 of downward revisions, participation is at a five-year low, retail sales fell 0.6% with the control group down 0.4%, sentiment is at 51.0, and core CPI has decelerated to 2.5%.
The case for hiking has narrowed to one argument, and it is about energy. Brent up 6% in a week with a chokepoint still closed is a genuine upside risk to headline inflation, and year-ahead expectations at 4.3% show households already registering it. The counter is that the Committee has consistently and correctly looked through energy shocks so long as the long horizon stays anchored — and at 3.3% for a third month, it has.
Which makes Wednesday's minutes genuinely interesting rather than procedural. Three dissents is unusual. The minutes will show whether the majority held because it was persuaded or because it was waiting for exactly the data that has since arrived.
5. ECONOMIC CALENDAR
Day
Time (ET)
Release / Event
Note
Mon Aug 17
—
China July activity data
Retail sales +1.5% expected
Tue Aug 18
Pre-open
Home Depot
Big-ticket deferral
Wed Aug 19
2:00 PM
FOMC MINUTES, July meeting
Three dissents to explain
Wed Aug 19
Pre-open
Target, Lowe's
Discretionary read
Thu Aug 20
Pre-open
Walmart
Trade-down commentary
Thu Aug 20
8:30 AM
Jobless claims
Prior 209,000
Late Aug
8:30 AM
PCE deflator
The Fed's preferred measure
Late Aug
AH
Nvidia Q2
Season's last major report
Sep 15-16
2:00 PM
FOMC
≈30% hike priced
6. EARNINGS WATCH
This is the most useful earnings week of the month. Home Depot Tuesday, Target and Lowe's Wednesday, Walmart Thursday — four reads on the consumer, two days after the consumer stopped spending. The questions are specific: whether discretionary categories are being deferred rather than lost, whether trade-down is accelerating within baskets, and whether the promotional environment is intensifying in a way that will show up in fourth-quarter margins.
Applied Materials closed the semiconductor equipment season on Thursday with a record quarter, thirteen consecutive quarters of gross margin expansion and guidance roughly 6% above consensus — and fell more than 5% on Friday. Nvidia in late August remains the only print left that will move the index.
7. SECTOR SPOTLIGHT: READING THE CONSUMER
Friday produced two consumer releases within ninety minutes of each other, and between them they contain four numbers worth understanding properly. Two are widely reported and largely uninformative. Two are barely mentioned and carry almost all the signal. Knowing which is which is most of what separates a useful reading of consumer data from a misleading one.
Part I — Why the Control Group Is the Number Economists Use
The headline retail sales figure of -0.6% is the number in every story. The control group figure of -0.4% is the number that matters, and it is worth understanding why.
Headline retail sales includes four categories that are excluded from the control group, and each is excluded for a specific reason. Motor vehicles are enormous, lumpy and driven by financing conditions and incentive programmes rather than by underlying household demand — a single fleet order can move the monthly number. Petrol stations are measured in dollars, so the line moves with the oil price rather than with the number of gallons anybody buys; in a week when Brent rose 6%, petrol station sales can rise while consumption falls. Building materials track construction cycles rather than consumer behaviour. Food services — restaurants — are excluded on statistical grounds relating to how the data feeds the national accounts.
Strip those four out and what remains is a cleaner read on discretionary household goods demand. More importantly, the control group is the series the Bureau of Economic Analysis uses to build the goods component of personal consumption expenditure, which is the largest single input to GDP. A control-group miss is not a sentiment indicator. It is an arithmetic downgrade to the growth estimate.
Which is why the composition of Friday's miss matters. Headline missed by 0.7 points; the control group missed by 0.7 points as well. Had the headline fallen while the control group held, the story would have been about petrol prices and car incentives. It did not hold. The weakness is in the part that counts.
THREE THINGS RETAIL SALES DOES NOT MEASURE
The series is more limited than its prominence suggests, and the limits change how a bad print should be read. First, it is overwhelmingly goods. Services — housing, healthcare, travel, insurance, education — are roughly two-thirds of American consumption and are almost entirely absent. A household that cuts spending on furniture while maintaining its holiday booking shows up in this release as retrenchment when it is really substitution. Second, it is nominal, not real. The figures are dollars spent, unadjusted for inflation. With July consumer prices up 0.1% on the month, a nominal decline of 0.6% implies a real decline nearer 0.7% — so the headline understates rather than overstates the weakness. Third, it is a first estimate from an incomplete sample and it gets revised, sometimes substantially, exactly as payrolls do. A single month's print is a data point, not a trend, and this brief has learned the hard way to say so. What makes Friday's number carry more weight than usual is not the number itself but its company: it arrived alongside negative payrolls, falling participation and collapsing sentiment, all pointing the same way.
Part II — What 'Anchored Expectations' Actually Means
Fig. 2 — The short horizon moved almost a full point since February. The long horizon has not moved at all.
The second release contained the more consequential information, and it sits in a line most coverage skipped. Year-ahead inflation expectations rose to 4.3%. Five-to-ten-year expectations were unchanged at 3.3% for a third consecutive month.
To see why that combination matters, consider what inflation actually is. Prices are set by people. A firm deciding next year's prices, and a worker negotiating next year's wage, are both making a forecast about inflation and then acting on it. If everybody expects 3% and behaves accordingly, the expectation tends to deliver itself. If everybody expects 6%, that becomes self-fulfilling too. Expectations are not a commentary on inflation; they are an input to it.
"Anchored" means expectations about the distant future do not move when near-term prices do. Households see petrol at the pump, note that the coming year will be expensive, and simultaneously assume that in five years things will have returned to something normal. That combination — near-term pain, long-term confidence — is precisely what a central bank needs, because it means the shock will pass through prices once and then stop.
Unanchored is the failure state, and it is the reason central banks exist in their current form. If the long horizon starts to drift upward, households and firms have stopped believing the shock is temporary. Wage demands adjust, price-setting adjusts, and a one-time energy shock becomes an ongoing inflation. That is what happened in the 1970s, and unwinding it required interest rates high enough to cause two recessions. Every central banker alive was trained on that episode, which is why the five-to-ten-year line is watched with an intensity wildly out of proportion to how often it is reported.
On Friday's evidence, the anchor is holding. Year-ahead expectations have risen nearly a full point since February — from 3.4% to 4.3% — which is exactly what you would expect from a chokepoint closure and visible tariff pass-through. The long horizon has not moved at all.
WHY THE SURVEY NUMBERS LOOK TOO HIGH, AND WHY IT DOES NOT MATTER
A reasonable objection: consumers say they expect 4.3% inflation when actual inflation is 3.4%, and they said similar things last year when it was lower. Why would anyone take this seriously? The objection is correct on the facts. Household inflation surveys are persistently biased upward — people anchor on the most visible prices they encounter, particularly petrol and groceries, which are far more salient than the shelter and services components that dominate the actual index. They also respond to political and media sentiment in ways that have made the survey noticeably more partisan over the past decade. So the level of the number is close to meaningless. What is informative is the change, and specifically the change in the long horizon relative to the short one. The upward bias is reasonably stable, so movement still carries signal even when the level does not. This is a general principle worth carrying: with any survey-based series, distrust the level and watch the differences. It is also why the Federal Reserve cross-checks against market-derived measures such as breakeven inflation rates and the five-year, five-year forward — where real money is at risk rather than an opinion being offered to a telephone interviewer.
Part III — The Sentiment Number, and an Honest Caveat
Fig. 3 — At 51.0 the index sits far below its long-run average of roughly 84.
Sentiment at 51.0, against a long-run average near 84, looks alarming. It deserves a caveat that cuts against the pessimistic reading.
The relationship between what consumers say and what they do has been unusually weak for several years. Sentiment collapsed in 2022 and stayed near historic lows through a period in which consumption held up remarkably well. An investor who traded the sentiment index over that stretch would have been wrong repeatedly and expensively. The measure has become, in part, a referendum on prices and politics rather than a forecast of spending.
What makes this reading harder to dismiss is that the spending data agreed with it this time. For four years the standard rebuttal to weak sentiment was that the hard data contradicted it. On Friday the hard data did not contradict it: retail sales fell 0.6% and the control group fell 0.4%. Sentiment and spending pointing the same way is a materially different signal from sentiment pointing down on its own, and it is the reason this brief is treating Friday's releases as significant rather than as the latest instalment of a long-running disagreement between how Americans feel and what they buy.
Part IV — What It Means for September
Assemble the four numbers and the policy implication is reasonably clear. The control group says demand is genuinely weakening and third-quarter GDP tracking comes down. Sentiment says households are unhappy, and this time the spending data agrees. Year-ahead expectations say the energy and tariff shock is being felt. The five-to-ten-year reading says nobody believes it is permanent.
For a committee weighing whether to raise rates into a slowing economy, that combination points one way. Weak demand argues against tightening. An anchored long horizon means the energy shock does not force action. The market has moved accordingly — 30% priced for September, from 47% a month ago.
The risk to that view is narrow and specific: it is the five-to-ten-year line moving. If Brent holds near $90 through the autumn and the long horizon starts to drift above 3.3%, the calculus inverts immediately and a committee that already contains three hawkish dissenters would have its argument. That single figure, published twice a month and almost never reported, is the one to watch between now and the September meeting.
8. ANALYST CALLS DRIVING ACTION
Third-quarter GDP tracking estimates will be revised down today following the control group miss, and that is the mechanical consequence worth anticipating. Rates desks have moved September to roughly 30% and are unlikely to move much before Wednesday's minutes. The more interesting debate is on the consumer discretionary complex, where Friday's data and this week's four retail reports will settle whether July was a pause or a turn.
9. STOCKS TO WATCH
Walmart (WMT) — Thursday. Trade-down commentary is the single most informative consumer datapoint this month.
Home Depot (HD) / Lowe's (LOW) — Tuesday and Wednesday. Big-ticket deferral is the clearest read on household confidence.
Target (TGT) — Wednesday. The most discretionary-exposed of the four.
Dollar General (DG) / Dollar Tree (DLTR) — The other side of trade-down; beneficiaries if it is accelerating.
Nvidia (NVDA) — Late August, and the last print that moves the index.
Applied Materials (AMAT) — Record quarter, guidance 6% above consensus, down 5% on Friday. The gap between the print and the reaction is worth understanding.
Symbotic (SYM) / Serve Robotics (SERV) / Teradyne (TER) / Cognex (CGNX) — Physical AI. Automation is a margin answer when volumes soften.
CEG / VST / TLN / GEV / PWR — AI-power. Contracted cash flows re-rate as the rate path softens.
Cameco (CCJ) / BWX Technologies (BWXT) — Longer-dated expression of the power constraint.
Homebuilders (DHI / LEN / TOL / KBH) — A 30% September now argues for these, though a weak consumer argues against.
Tankers and refiners — Brent at $88.50 after a 6% week with Hormuz still contested.
Gold (GLD) — $4,391.49 and rising on a weaker dollar and a softer rate path.
10. GLOBAL MACRO SNAPSHOT
China's July activity data is today's other consumer story, and the expected figures describe a familiar problem: industrial output growth of 4.8% against retail sales growth of just 1.5%. An economy producing far faster than its households consume exports the difference, which is disinflationary for global goods prices — one of the quieter reasons core goods inflation has been so well behaved in the United States despite tariffs.
Europe faces the same energy problem as the US with less domestic production to offset it. Brent at $88.50 is a straightforward terms-of-trade loss for the region, and it arrives with Asia-Europe freight rates still running 25 to 40% above pre-crisis levels.
The Strait of Hormuz remains the single largest unpriced risk in the global economy. Last week's 6% move in crude came from attacks on shipping denting reopening hopes, not from any change in physical supply. The distinction matters: this remains a cost-of-transit event rather than a supply event, and it is why $88.50 is elevated but not yet a crisis price.
11. WEEK AHEAD PREVIEW
Today: China July activity data — retail sales growth of just 1.5% expected.
Tue Aug 18: Home Depot before the open.
Wed Aug 19: FOMC minutes from the July meeting at 2:00 PM — three dissents to account for. Target and Lowe's before the open.
Thu Aug 20: Walmart before the open; jobless claims at 8:30.
Late August: the PCE deflator and Nvidia's second quarter.
Sep 15-16: FOMC. Roughly 30% priced, no dot plot, no forward guidance.
12. THE CLOSING THOUGHT
Last week the inflation problem improved and the demand problem got worse. Core CPI came in at 2.5%, producer prices were flat for a second month — and then on Friday retail sales fell 0.6% against expectations of a 0.1% gain, with the control group that feeds GDP down 0.4% against a forecast +0.3%, and sentiment collapsing to 51.0. The S&P still closed the week up 0.4%, its third consecutive weekly gain, because a weaker consumer means a Federal Reserve that does not raise rates — September is now priced at roughly 30%, from 47% a month ago. The number almost nobody reported is the one that matters most: five-to-ten-year inflation expectations were unchanged at 3.3% for a third straight month, even as the year-ahead figure rose to 4.3%. Households expect the next twelve months to hurt and still do not believe it is permanent, which is the precise configuration that lets a central bank look through an energy shock rather than act on it. That anchor is now doing more work in holding this market together than any earnings result, and it is the thing to watch if Brent stays near $90. Four retailers report this week and will say more about the American consumer than the government did on Friday. The July minutes land Wednesday with three dissents to explain. Have a good week.
THE BROOKSIDE BRIEF · COMPILED 9:15 AM ET · SOURCES: US CENSUS BUREAU ADVANCE MONTHLY RETAIL TRADE REPORT, JULY 2026, RELEASED 14 AUGUST 2026 (HEADLINE AND CONTROL GROUP); UNIVERSITY OF MICHIGAN SURVEYS OF CONSUMERS, PRELIMINARY AUGUST 2026, RELEASED 14 AUGUST 2026 (SENTIMENT AND INFLATION EXPECTATIONS); CNBC, YAHOO FINANCE, THESTREET AND THE GLOBE AND MAIL (14 AUGUST CLOSE AND WEEKLY PERFORMANCE); WASHINGTON POST, BLOOMBERG, PBS AND CNN (RETAIL SALES COVERAGE); INVESTINGLIVE AND CRYPTOBRIEFING (SENTIMENT AND EXPECTATIONS DETAIL); TS2 AND THESTREET (MONDAY FUTURES, FED PRICING, GOLD, BRENT); AL JAZEERA (HORMUZ AND OIL) · THE LONG-RUN SENTIMENT AVERAGE OF APPROXIMATELY 84 IS AS CHARACTERISED IN CONTEMPORANEOUS REPORTING AND IS INDICATIVE · NOTHING IN THIS BRIEF IS INVESTMENT ADVICE
MORNING EDITION · WEDNESDAY, AUGUST 19, 2026 · 30-YEAR HITS A 19-YEAR HIGH · TREASURY DOUBLES BUYBACKS · FOMC MINUTES 2:00 PM
Daily Markets Briefing
The Brookside Brief
Markets · Macro · The Day Ahead
1. THE MORNING SETUP
Good morning. On Monday this brief argued that anchored long-run inflation expectations were the thing holding the market together. Two days later the thirty-year Treasury yield touched 5.33%, its highest level since June 2007, and it did so without any deterioration in those expectations at all. That apparent contradiction is the most instructive thing on the tape, and Section 7 is devoted to resolving it.
The short version: a long bond yield is not a forecast of Federal Reserve policy. It is a forecast of policy plus a payment for taking risk, and it is the second part that has been moving. Rate expectations have collapsed — the probability of a September increase has fallen from about 67% early this month to roughly 30%. The thirty-year has risen 40 basis points since June regardless. The gap between those two facts has a name — term premium — and it is now the dominant force in this market.
Then, this morning, the government did something about it. The Treasury announced it will at least double the maximum size of its debt buyback operations, from $2 billion to $4 billion, targeting the ten-to-twenty and twenty-to-thirty-year sectors — the part of the curve that has seen what one account called a buyers' strike since late June. The change takes effect on 9 September. The reaction was immediate: the ten-year fell six basis points to 4.647% and the thirty-year dropped nine to 5.196%, with Dow futures rising 230 points and S&P futures 0.4%.
Before that announcement the week had been steadily negative. Monday the S&P fell 0.52% to 7,745.06, the Nasdaq 0.32% to 26,644.91 and the Dow 272.63 points, or 0.51%, to 53,459.78. Tuesday the Dow lost a further 116.38 points, or 0.22%, to 53,343.40, with the S&P down about 0.5% and the Nasdaq down 1.3% as the long end sold off and chip stocks came under pressure.
Elsewhere: Brent has broken above $90, trading at $91.66, with WTI at $85.67, on conflicting signals from Tehran and Washington about whether the Strait of Hormuz is open to shipping. Target reported a doubling of profit that deserves a careful read, Lowe's fell 3.5% on a cautious outlook, and the minutes of the July FOMC meeting — the one with three dissents — arrive at 2:00 PM.
2. MARKETS AT A GLANCE
MONDAY AUGUST 17 AND TUESDAY AUGUST 18 CLOSES
Asset
Last
Change
% Chg
S&P 500 — Mon
7,745.06
—
-0.52%
Nasdaq Composite — Mon
26,644.91
—
-0.32%
Dow Jones — Mon
53,459.78
-272.63
-0.51%
Dow Jones — Tue
53,343.40
-116.38
-0.22%
S&P 500 — Tue
—
—
≈-0.5%
Nasdaq Composite — Tue
—
—
-1.3%
THE LONG END — A 19-YEAR HIGH, THEN A REVERSAL
Measure
Level
Change
Note
30-year, Tuesday peak
5.33%
19-year high
since June 2007
30-year, since June
—
+40 bps
on term premium
30-year, after buyback news
5.196%
-9 bps
this morning
10-year, after buyback news
4.647%
-6 bps
this morning
Sept hike probability
≈30%
from 67%
early August
THIS MORNING
Asset
Last
Change
% Chg
Dow futures, post-announcement
—
+230 pts
+0.4%
S&P 500 futures, post-announcement
—
+0.4%
—
Brent crude
$91.66
+0.7%
above $90
WTI crude
$85.67
+0.86%
—
Target (TGT)
—
-3%
on refund composition
Lowe's (LOW)
—
-3.53%
cautious outlook
RETAIL EARNINGS SO FAR
Company
Result
Versus
Read
Home Depot, Tue
EPS $4.92
vs $4.73 exp
BEAT; +1%
Home Depot, Tue
Sales $47.861bn
vs $47.271bn exp
BEAT
Target, Wed
Comps +3.8%
vs +2.4% exp
BEAT
Target, Wed
FY sales growth ≈5%
+1 pt
GUIDANCE RAISED
Lowe's, Wed
Cautious FY outlook
DIY pressure
-3.53%
3. TOP STORIES
The Thirty-Year Touches a 19-Year High
Fig. 1 — Rate expectations collapsed and the long bond rose anyway.
The thirty-year Treasury yield reached 5.33% on Tuesday, trading as high as 5.323% intraday before easing to around 5.282% — its highest level since June 2007. The move caps a 40 basis point rise since June.
What makes it remarkable is what did not cause it. Over the same period core CPI decelerated to 2.5%, producer prices were flat for a second month, payrolls fell 23,000, retail sales dropped 0.6% and long-run inflation expectations sat unchanged at 3.3%. Long yields climbed through three separate soft data releases that should have pushed them down. The explanation is not inflation and not Fed policy. It is supply, and the price the market now demands for absorbing it.
The numbers behind that are substantial. The July federal deficit was $432 billion. The national debt is approaching $40 trillion. And roughly $1.7 trillion of corporate bond issuance is competing for the same pool of duration buyers. Add uncertainty about how a Federal Reserve under Chair Warsh will behave — no forward guidance, no dot plot, a 132-word statement — and lenders want paying more to commit money for thirty years.
And Then the Treasury Reached Into the Long End
Fig. 3 — Doubling buybacks in the twenty-to-thirty-year sector, and the immediate response.
This morning the Treasury announced it will at least double the maximum size of its buyback operations, from $2 billion to $4 billion, specifically targeting the ten-to-twenty-year and twenty-to-thirty-year portions of the curve. The change begins 9 September.
This is a direct intervention in term premium and should be understood as such. If long yields are high because there is more long-dated paper than there are willing holders, then buying some of it back reduces the supply the market must absorb. It does not change the deficit, the debt or the Federal Reserve's reaction function. It changes who holds the duration.
It worked immediately. The ten-year fell six basis points to 4.647%, the thirty-year nine to 5.196%, and equity futures turned from modestly lower to up 0.4%. That speed is itself informative: a market that reprices that hard on a $2 billion change in operation size is telling you the marginal buyer of long duration had genuinely stepped away. One published assessment described Wall Street reading the move as a sign of bond-market angst rather than routine debt management, and that reading seems right.
Target's Profit Doubled — Read the Composition
Fig. 4 — Roughly 40% of the quarter's earnings per share came from a one-off refund.
Target reported a strong quarter on the surface. Net sales rose 5.3%, comparable sales grew 3.8% against a 2.4% consensus, and the company raised full-year sales growth guidance by a percentage point to around 5%, with earnings guidance of $9.90 to $10.90. Profit doubled. The chief executive said he was encouraged by the traction of the turnaround.
The composition requires attention. The quarter included $994 million of pretax tariff refund benefits recognised within gross margin and operating income, contributing approximately $1.65 to earnings per share — roughly 40% of the quarter's EPS. The company disclosed this clearly and included it explicitly in the guidance range, which is the correct treatment. But an investor reading "profit doubled" should understand that a substantial part of the doubling was a one-time recovery of tariffs previously paid, not an improvement in the business. The comparable sales beat is the real signal here, and it is a genuinely good one. The shares fell about 3% as the market worked through the same arithmetic.
Lowe's Falls on DIY Weakness — the Consumer Split Is Widening
Lowe's fell 3.53% after a cautious full-year outlook citing "pressure" in do-it-yourself consumer spending. Set against Home Depot, which beat on both lines on Tuesday — earnings of $4.92 against $4.73 expected, sales of $47.861 billion against $47.271 billion — and rose about 1%, the pair describe a split rather than a uniform slowdown.
That split is consistent with Friday's retail sales collapse and with what we would expect from a low-hire, low-fire labour market. Households with secure employment and existing homes continue to spend on maintenance and professional projects. Discretionary, self-funded, deferrable projects are being deferred. Walmart tomorrow completes the picture, and its trade-down commentary remains the single most informative consumer datapoint this month.
Brent Breaks $90
Brent is trading at $91.66, up 0.7%, with WTI at $85.67, on conflicting signals from Tehran and Washington about whether the Strait of Hormuz is actually open to shipping. We flag once more that the two sides' accounts are not reconcilable and that we cannot adjudicate between them. Crude above $90 with a chokepoint contested is the principal upside risk to an inflation picture that has otherwise improved markedly, and it is the reason the Committee's task is harder than the recent data alone suggests.
4. MACRO & FED WATCH
The minutes of the 28-29 July meeting arrive at 2:00 PM, and they matter more than minutes usually do. That meeting held rates at 3.50-3.75% with three presidents dissenting in favour of an increase — an unusually large split — and under a chair who has eliminated forward guidance the minutes are one of the very few windows into how the committee actually reasons.
The question to read them for is not whether the hawks were close to winning. It is what the majority said it was waiting for. Since that meeting the labour market has weakened materially, inflation has decelerated and the consumer has stopped spending. If the minutes show a majority holding because it wanted confirmation that inflation was easing, that confirmation has arrived and September is close to settled. If they show a majority holding on timing grounds while sharing the hawks' concern about energy and tariffs, then Brent at $91.66 reopens the argument.
Markets price roughly 30% for September, down from about 67% at the start of the month.
5. ECONOMIC CALENDAR
Day
Time (ET)
Release / Event
Note
Wed Aug 19
8:00 AM
Target (reported)
Comps +3.8%; guidance raised
Wed Aug 19
9:00 AM
Lowe's (reported)
Cautious FY outlook; -3.5%
Wed Aug 19
2:00 PM
FOMC MINUTES, July 28-29
Three dissents to explain
Wed Aug 19
—
TJX, Estée Lauder, Analog Devices
—
Thu Aug 20
Pre-open
WALMART
Trade-down commentary
Thu Aug 20
8:30 AM
Jobless claims
Prior 209,000
Sep 9
—
Enlarged buybacks begin
$4bn maximum
Late Aug
8:30 AM
PCE deflator
The Fed's preferred measure
Late Aug
AH
Nvidia Q2
Season's last major report
Sep 15-16
2:00 PM
FOMC
≈30% hike priced
6. EARNINGS WATCH
Three of the four retail reads are in and they do not agree, which is itself the finding. Home Depot beat on both lines. Target beat on comparable sales and raised guidance, with 40% of the quarter's earnings coming from a one-off tariff refund. Lowe's guided cautiously and fell 3.5% on do-it-yourself weakness. Professional and maintenance demand is holding; discretionary self-funded spending is not. Walmart tomorrow is the one that matters most, because its scale and price position make its trade-down commentary the closest thing available to a census of American household behaviour.
7. SECTOR SPOTLIGHT: TERM PREMIUM, OR WHY THE LONG BOND STOPPED LISTENING TO THE FED
Here is a genuine puzzle from this week. The market's expectation of a September rate increase has fallen from roughly 67% to about 30%. Over broadly the same period the thirty-year Treasury yield rose 40 basis points to a 19-year high. Those two facts appear to contradict each other. Resolving them requires understanding the single most useful concept in fixed income, and one that explains a great deal of what has happened this year.
Part I — What a Long Yield Is Made Of
Fig. 2 — The same yield, decomposed. Expected policy fell; the risk payment rose by more.
Ask why a thirty-year bond yields what it does and the intuitive answer is "because that is what people think inflation and interest rates will average." That is half right, and the missing half is where the action is.
A long-dated yield decomposes into two parts. The first is the average expected future short-term interest rate over the life of the bond — essentially, what the market thinks the Federal Reserve will do, compounded across thirty years. The second is the term premium: the additional yield investors demand as compensation for the risk of locking money away for that long rather than rolling short-term paper.
The logic of the second part is straightforward once stated. If you could earn the expected average short rate simply by rolling three-month bills, why would you ever buy a thirty-year bond? You would not — unless you were paid extra for the risk that your forecast is wrong. Inflation might be higher than expected, destroying the real value of a fixed coupon. You might need the money and have to sell at a loss. Rates might rise and leave you holding a bond nobody wants. The term premium is the price of those risks, and it is set by supply and demand for duration itself, not by any forecast.
Which resolves the puzzle. Expectations of Federal Reserve policy have fallen — that is real and it is what the 30% September probability reflects. Term premium has risen by more. The net is a long yield at a 19-year high in an economy where the central bank is expected to hold.
AN IMPORTANT HONESTY CAVEAT: NOBODY CAN ACTUALLY OBSERVE TERM PREMIUM
It is worth being direct about the epistemic status of this concept, because it is frequently quoted with more confidence than it deserves. Term premium cannot be measured. It is a residual — what is left of a yield after subtracting an estimate of expected future short rates, and that estimate itself comes from a model. The Federal Reserve Bank of New York publishes two of the best-known estimates, and they do not always agree with each other, sometimes by a meaningful margin. Different models produce different answers because they make different assumptions about how expectations are formed. The practical implication is that you should treat statements about the level of term premium with real scepticism, and statements about its direction with rather more confidence. When long yields rise while rate expectations fall — which is directly observable, since both series are published — you can be reasonably sure term premium is rising, whatever its precise level. That is the situation this week, and it is why the decomposition in Figure 2 is labelled illustrative.
Part II — Why It Is Rising Now
Three forces are pushing in the same direction, and none of them is about inflation forecasts.
Supply. This is the largest and simplest. The July federal deficit was $432 billion, the national debt is approaching $40 trillion, and each dollar of deficit becomes a bond somebody must hold. Simultaneously, roughly $1.7 trillion of corporate bond issuance is competing for the same buyers. Duration is a commodity like any other: increase the quantity supplied without increasing demand and the price falls, which for a bond means the yield rises.
Uncertainty about the reaction function. Under the previous chair, markets had a dot plot and explicit forward guidance. Chair Warsh has eliminated both, on the stated reasoning that markets work better reacting to data than to the Fed's anticipated reaction to data. That may be right. It also means investors genuinely do not know how the committee will respond to a given shock, and uncertainty about the path is exactly what term premium compensates for. Three dissents at the last meeting sharpen the point.
Inflation variance rather than inflation level. Long-run expectations sit at 3.3% and have not moved for three months. But the distribution around that central expectation has widened — a contested chokepoint, tariff pass-through of uncertain magnitude, and an energy price that moved 6% in a week. A bondholder is not compensated for the average outcome; they are exposed to the bad tail. Wider uncertainty raises the premium even when the central forecast is unchanged.
Part III — Why This Is the Unhelpful Kind of Yield Rise
Not all increases in long yields mean the same thing for equities, and the distinction is worth holding onto.
When yields rise because growth expectations improve, that is broadly fine. The discount rate applied to future cash flows goes up, but the expected cash flows go up as well, and the two effects substantially offset. Equities can and do rise through that kind of increase.
When yields rise because term premium is expanding, there is no offset. The discount rate rises for reasons entirely unconnected to corporate earnings — fiscal supply, policy uncertainty, risk appetite for duration. Cash flows are unchanged; the rate at which they are discounted is higher. Every valuation falls, and the longest-duration assets fall most.
This is why the Nasdaq fell 1.3% on Tuesday while the Dow lost only 0.22%. Companies whose value sits mostly in cash flows a decade out are precisely the assets most sensitive to the term premium embedded in a thirty-year yield. It is also why chip and memory names — Micron and Western Digital among them — have been under particular pressure, and why the Treasury's buyback announcement moved equity futures so sharply this morning. The announcement did not change a single company's earnings. It changed the rate at which those earnings are discounted.
THE PRACTICAL CHECKLIST WHEN LONG YIELDS MOVE
Three questions turn a headline about rising yields into something you can act on. First: did rate expectations move in the same direction? Both are observable — futures-implied policy probabilities and the yield itself. If they moved together, the story is about the Federal Reserve and the usual rules apply. If they diverged, as they have this month, it is term premium and the implications are different and generally worse for long-duration equities. Second: what happened at the front end versus the long end? A rise concentrated in thirty-year paper while two-year yields fall is a fiscal and supply story, not a monetary one. Third: what are inflation breakevens doing? If nominal yields rise while breakevens are flat, the increase is in real yields — which is the configuration that hurts equity valuations most directly, because it raises the discount rate without any compensating increase in nominal cash flows. A useful shorthand: rising nominal yields with stable breakevens and falling policy expectations is the least friendly combination there is, and it is roughly where this week began.
Part IV — What the Treasury Just Did, and Its Limits
The buyback expansion announced this morning is a term premium intervention, and it is worth being precise about what it can and cannot achieve.
What it does: reduce the quantity of long-dated paper the private market must hold, by repurchasing it. If term premium is a price set by duration supply and demand, then reducing supply lowers the price. The immediate nine basis point fall in the thirty-year suggests the mechanism works.
What it does not do: change the deficit. The Treasury still needs to finance $432 billion a month in the months it runs one. A buyback funded by issuing shorter-dated paper does not reduce borrowing; it shortens the average maturity of the debt. That lowers long yields today at the cost of refinancing more frequently, which increases the government's exposure to short-term rates. It is a genuine trade-off rather than a free improvement.
Which is why the market read it as a signal as much as a policy. A Treasury that doubles buybacks days after a 19-year high in the long bond is communicating that it is watching, and that it regards current levels as unwelcome. Whether that reassures investors or worries them is genuinely ambiguous, and reasonable people have taken both views this morning.
8. ANALYST CALLS DRIVING ACTION
The buyback announcement will dominate rates commentary today and the debate is already forming along predictable lines: whether this is prudent debt management or an admission that the long end had become disorderly. The more useful question for equity investors is narrower — whether a nine basis point rally in the thirty-year holds through the afternoon, because a market that gives it straight back would indicate the buyers' strike is deeper than a $2 billion change in operation size can address. The July minutes at 2:00 PM land into that.
9. STOCKS TO WATCH
Walmart (WMT) — Tomorrow pre-open. The most informative consumer datapoint of the month.
Target (TGT) — Comps beat and guidance raised, but 40% of EPS was a one-off tariff refund. Read the composition.
Lowe's (LOW) / Home Depot (HD) — A 3.5% fall against a 1% gain. The DIY versus professional split is the story.
Micron (MU) / Western Digital (WDC) — Memory under pressure; long-duration assets in a rising term premium.
Nvidia (NVDA) — Late August, and the last print that moves the index.
TLT and the long end — Today is the test of whether the buyback holds.
Homebuilders (DHI / LEN / TOL / KBH) — Caught between a 30% September and a thirty-year at 5.2%. Mortgage rates follow the long end, not the Fed.
Regional banks — A steeper curve helps net interest margin; a weakening consumer is a credit question.
Symbotic (SYM) / Serve Robotics (SERV) / Teradyne (TER) / Cognex (CGNX) — Physical AI, and a margin answer when volumes soften.
CEG / VST / TLN / GEV / PWR — AI-power on contracted cash flows, though contracted long-dated cash flows are exactly what a higher term premium discounts hardest.
Tankers and refiners — Brent above $90 with Hormuz contested.
Gold (GLD) — Bid on fiscal anxiety, which is precisely what term premium expansion expresses.
10. GLOBAL MACRO SNAPSHOT
China's July data disappointed. Industrial production grew 4.5% year on year, easing for the first time in three months and missing forecasts, with retail sales also below expectations. Money supply grew 7.7% on the M2 measure and 4% on M1. An economy producing more than its households will consume exports the difference, which continues to suppress global goods prices — one of the quieter reasons American core goods inflation has stayed contained despite tariffs.
The long-end selloff has been global rather than American, which matters for interpretation. If term premium were rising only in Treasuries, the explanation would be specific to US fiscal policy. A synchronised global move points to something broader — a worldwide reassessment of what it costs to hold long-dated government paper at a time when most developed economies are running large deficits simultaneously.
Brent above $90 is a terms-of-trade loss for every major importer and lands hardest on Europe and Asia, which have the least domestic production to offset it.
11. WEEK AHEAD PREVIEW
Today, 2:00 PM: FOMC minutes from the July meeting — three dissents to account for.
Today: TJX, Estée Lauder and Analog Devices also report.
Thu Aug 20: Walmart pre-open; jobless claims at 8:30.
Sep 9: The enlarged Treasury buyback operations begin.
Late August: the PCE deflator and Nvidia's second quarter.
Sep 15-16: FOMC. Roughly 30% priced, no dot plot, no forward guidance.
12. THE CLOSING THOUGHT
On Monday this brief argued that anchored long-run inflation expectations were holding the market together. They are still anchored at 3.3%, and the thirty-year Treasury yield touched a 19-year high anyway. The resolution is the thing worth taking from today: a long yield is the market's expectation of Federal Reserve policy plus a payment for the risk of lending for thirty years, and while the first component has collapsed — September is priced at roughly 30%, down from 67% — the second has risen by more, on a $432 billion monthly deficit, a national debt approaching $40 trillion, $1.7 trillion of competing corporate issuance, and a central bank that has deliberately stopped telling anyone what it intends to do. That is the unhelpful kind of yield rise, because it raises the discount rate on every future cash flow without raising any of the cash flows — which is why the Nasdaq fell 1.3% on Tuesday while the Dow lost 0.22%. This morning the Treasury doubled its long-dated buybacks and the thirty-year fell nine basis points within minutes, which tells you both that the mechanism works and that the marginal buyer had genuinely walked away. Whether a $2 billion change in operation size is a solution or a signal is the argument of the day. The July minutes land at two o'clock with three dissents to explain, Walmart reports tomorrow, and Brent is above $90 with a chokepoint still contested. Good luck today.
THE BROOKSIDE BRIEF · COMPILED 10:00 AM ET · SOURCES: CNBC (30-YEAR AT 5.33%, A 19-YEAR HIGH, 18 AUGUST 2026; TREASURY BUYBACK EXPANSION AND YIELD REACTION, 19 AUGUST 2026); BLOOMBERG (LONG-DATED TREASURIES RALLY ON BUYBACKS); THE FISCAL TIMES AND 24/7 WALL ST (TERM PREMIUM, DEFICIT AND DEBT CONTEXT); INTELLECTIA (40 BASIS POINT RISE SINCE JUNE, $432BN JULY DEFICIT, $1.7TN CORPORATE ISSUANCE); CNBC AND WASHINGTON POST (17 AUGUST CLOSE); BENZINGA AND CNBC (18 AUGUST CLOSE, HOME DEPOT RESULTS); TARGET CORPORATION Q2 FY2026 RESULTS AND CORPORATE.TARGET.COM (COMPARABLE SALES, TARIFF REFUND, GUIDANCE); TS2 (TARIFF REFUND SHARE OF EPS); THESTREET AND INVESTING.COM (LOWE'S, WEDNESDAY FUTURES, CALENDAR); TRADINGKEY (BRENT AND WTI, MEMORY STOCKS); BLOOMBERG AND CGTN (CHINA JULY ACTIVITY DATA) · TERM PREMIUM IS NOT DIRECTLY OBSERVABLE; THE DECOMPOSITION IN FIG. 2 IS ILLUSTRATIVE AND LABELLED AS SUCH · ACCOUNTS OF WHETHER THE STRAIT OF HORMUZ IS OPEN REMAIN DISPUTED BETWEEN THE PARTIES · NOTHING IN THIS BRIEF IS INVESTMENT ADVICE
MORNING EDITION · THURSDAY, AUGUST 20, 2026 · FOMC MINUTES: 9-3, AND EIGHT MEETINGS TO SIX · WALMART BEATS, COMPS MISS · CLAIMS 206,000
Daily Markets Briefing
The Brookside Brief
Markets · Macro · The Day Ahead
1. THE MORNING SETUP
Good morning. Yesterday's minutes contained the expected news and one genuine surprise, and the surprise is the more consequential of the two.
The expected news: the July meeting produced the most fractured vote in years. The Committee held at 3.50-3.75% by nine votes to three, with Beth Hammack of Cleveland, Neel Kashkari of Minneapolis and Lorie Logan of Dallas each preferring a quarter-point increase. More importantly, the minutes show hawkish sentiment extending well beyond those three: participants said "policy tightening would likely be necessary if inflation did not decline," some judged financial conditions might not be tight enough, and the Committee described its inflation outlook as "highly uncertain" with risks skewed to the upside.
The surprise: Chair Warsh used the meeting to propose cutting the number of FOMC meetings from eight a year to six, spaced roughly every two months. His stated reasoning was that a six-meeting calendar "would allow more information to accumulate between meetings than under current practice and provide policymakers and the staff more time to consider strategic monetary policy issues."
That proposal is the subject of Section 7, and it connects directly to yesterday's brief. We argued that one of the three forces pushing term premium to a 19-year high was uncertainty about the Federal Reserve's reaction function — that investors demand compensation when they cannot predict how a central bank will respond. The minutes reveal the Fed is deliberately increasing that uncertainty further. Whether that is wise is a genuine question with a serious case on each side.
On the consumer: Walmart beat on earnings and revenue and missed on the number that mattered. Adjusted earnings of $0.81 against $0.74 expected, revenue of $187.94 billion against $186.77 billion — but US comparable sales excluding fuel grew just 2.6% against a 3.67% consensus, the slowest US growth in six years. Full-year guidance was raised on both sales and earnings. The shares fell.
Initial jobless claims fell to 206,000 for the week ending 15 August, below the 210,000 expected, with the prior week revised up to 212,000. Firms are still not letting people go. And Wednesday's session snapped a three-day losing streak, helped by the Treasury's buyback announcement, which took the thirty-year down more than ten basis points from Tuesday's 19-year high to around 5.19% and the ten-year to roughly 4.64%.
2. MARKETS AT A GLANCE
WEDNESDAY AUGUST 19 — THREE-DAY LOSING STREAK SNAPPED
Our sources disagree on Wednesday's precise closing levels — reported S&P gains range from 0.2% to 0.4% — and we have not been able to reconcile them against a primary feed before publication. We are therefore reporting direction and drivers rather than printing a level we cannot stand behind. The S&P rose, snapping a three-day decline, with health care and cyclicals leading and technology lagging. The proximate cause was the fall in yields following the Treasury's buyback announcement.
THE LONG END AFTER THE BUYBACK
Measure
Level
Change
Note
30-year, Tuesday peak
5.33%
19-year high
since June 2007
30-year, after buyback
≈5.19%
-10 bps or more
—
10-year, after buyback
≈4.64%
-6 bps
—
Buyback maximum
$4bn
from $2bn
effective 9 Sept
WALMART Q2 FY2027 — RELEASED 7:00 AM
Measure
Result
Versus
Read
Adjusted EPS
$0.81
vs $0.74 exp
BEAT
Revenue
$187.94bn
vs $186.77bn exp
BEAT, +5.9%
Global e-commerce
+23%
—
STRONG
US comparable sales, ex-fuel
+2.6%
vs +3.67% exp
MISS — SLOWEST IN 6 YEARS
FY27 net sales guidance
4.0-5.0%
from 3.5-4.5%
RAISED
FY27 adjusted EPS guidance
$2.80-2.87
from $2.75-2.85
RAISED
THE JULY FOMC MINUTES
Item
Detail
Note
Read
Vote
9-3 to hold
3.50-3.75%
most fractured in years
Dissenters
Hammack, Kashkari, Logan
each wanted +25bp
—
Inflation outlook
"highly uncertain"
risks to the upside
—
Proposed change
8 meetings → 6
roughly every 2 months
WARSH PROPOSAL
JOBLESS CLAIMS — WEEK ENDING 15 AUGUST
Measure
Actual
Versus
Note
Initial claims
206,000
vs 210,000 exp
BELOW
Prior week, revised
212,000
from 209,000
revised up
3. TOP STORIES
The Minutes: Three Dissents, and Hawkishness Beyond Them
The 9-3 vote was already known; what the minutes added was the distribution of opinion behind it. Hammack, Kashkari and Logan each formally preferred a quarter-point increase. But the minutes record that the case for an immediate hike "circulated broadly" before the Committee settled on holding, and that some participants judged financial conditions might not be tight enough to return inflation to target.
The operative sentence for anyone modelling September is this: participants said "policy tightening would likely be necessary if inflation did not decline." That is a conditional, and the condition has since been met in the Committee's favour — core CPI decelerated to 2.5% and producer prices were flat for a second month. On the Committee's own stated logic, the case for tightening has weakened since it met. The market agrees: September sits at roughly 30%, down from about 67% at the start of the month.
The complication is that the minutes also described the inflation outlook as "highly uncertain" with risks skewed to the upside — and Brent has since gone above $90.
Eight Meetings to Six
Fig. 1 — Each element removed in isolation is defensible. The pattern is the point.
Chair Warsh proposed at the July meeting that the FOMC reduce its calendar from eight meetings a year to six, roughly one every two months. The stated rationale is that longer gaps allow more data to accumulate between decisions and give policymakers and staff more time for strategic questions rather than tactical ones.
Set alongside what has already changed, this is not an isolated administrative tweak. Since taking the chair, Warsh has eliminated forward guidance entirely, cut the post-meeting statement to roughly 132 words from 341, and removed the dot plot from meetings without a full projection round. The proposal would now reduce the number of occasions on which the Committee speaks at all by a quarter. Section 7 takes the argument on both sides seriously.
Walmart: The Beat That Confirmed the Slowdown
Fig. 2 — Ahead on earnings and revenue, well short on the operating number.
Walmart's quarter was strong on the lines that reflect execution and weak on the line that reflects the customer. Adjusted earnings of $0.81 beat the $0.74 consensus by nearly 10%. Revenue of $187.94 billion rose 5.9% and beat. Global e-commerce grew 23%. The company raised full-year guidance on both sales and earnings — net sales to 4.0-5.0% in constant currency from 3.5-4.5%, and adjusted EPS to $2.80-2.87 from $2.75-2.85.
And US comparable sales excluding fuel grew 2.6% against a 3.67% consensus — the slowest US growth in six years. The shares fell.
That combination is worth sitting with, because it is not a contradiction. Walmart is taking share, monetising advertising and e-commerce, and converting all of it into earnings — which is why the earnings line beat and guidance rose. What it cannot do is make American households buy more than they are buying. Comparable sales measure the underlying customer; everything else measures how well the company is extracting value from that customer. The first of those just came in at a six-year low.
The Consumer Picture Is Now Consistent
Fig. 3 — Government data and four retailers, pointing the same way.
A week ago the consumer story rested on a single retail sales print. It now rests on six independent readings and they agree. Retail sales fell 0.6% with the GDP-relevant control group down 0.4%. Sentiment collapsed to 51.0. Walmart's US comparable sales are the slowest in six years. Lowe's guided cautiously on do-it-yourself weakness and fell 3.5%.
The two positive readings are instructive rather than contradictory. Home Depot beat on both lines, and Target beat on comparable sales and raised guidance — but Target is recovering from a depressed base and roughly 40% of its quarterly earnings came from a one-off tariff refund. Professional and maintenance demand is holding. Discretionary, deferrable, self-funded spending is not. That is precisely the pattern a low-hire, low-fire labour market with falling participation would produce.
Claims Fall Again — Still Nobody Is Being Fired
Initial claims fell to 206,000 for the week ending 15 August against 210,000 expected, with the prior week revised up to 212,000 from 209,000. The picture we described a fortnight ago is unchanged and now well established: firms are not letting people go, and firms are not taking people on. It is a labour market that looks stable from the inside and is very difficult to enter from the outside, and it is entirely consistent with a consumer who has stopped spending without any rise in unemployment.
4. MACRO & FED WATCH
The September calculus has become clearer rather than more contested. The minutes show a Committee that said it would tighten if inflation did not decline. Inflation has declined — core CPI at 2.5%, producer prices flat. Since the meeting, payrolls have gone negative, retail sales have fallen, sentiment has collapsed and the largest retailer in the world has reported its slowest domestic growth in six years.
The one live argument for the hawks is energy. Brent above $90 with a contested chokepoint is exactly the upside inflation risk the minutes described as skewing the distribution, and year-ahead household expectations at 4.3% show it registering. Against that, five-to-ten-year expectations remain anchored at 3.3%, which is the condition under which a central bank can look through an energy shock.
Markets price roughly 30% for September. If the proposal to move to six meetings is adopted, the practical consequence is that each remaining meeting carries more weight and each intervening period contains more accumulated surprise — which, as Section 7 argues, is not obviously a reduction in volatility.
5. ECONOMIC CALENDAR
Day
Time (ET)
Release / Event
Note
Wed Aug 19
2:00 PM
FOMC minutes (released)
9-3; eight meetings to six
Thu Aug 20
7:00 AM
Walmart (released)
Beat; US comps slowest in 6 years
Thu Aug 20
8:30 AM
Jobless claims (released)
206,000 vs 210,000 expected
Sep 9
—
Enlarged Treasury buybacks begin
$4bn maximum
Late Aug
8:30 AM
PCE deflator
The Fed's preferred measure
Late Aug
AH
Nvidia Q2
Season's last major report
Sep 15-16
2:00 PM
FOMC
≈30% hike priced
6. EARNINGS WATCH
The four retail reads are complete and they resolve cleanly. Home Depot beat both lines. Target beat comparable sales and raised guidance, with roughly 40% of earnings from a one-off tariff refund. Lowe's guided cautiously and fell 3.5%. Walmart beat earnings and revenue, raised guidance, and reported the slowest US comparable sales growth in six years.
The synthesis: these are well-run companies executing well against a customer who is buying less. Margin, mix, advertising and e-commerce are all doing work. Volume is not. That is a perfectly good environment for the operators and a poor one for the economy, and the two facts will diverge further before they converge. Nvidia in late August is the last print that moves the index.
7. SECTOR SPOTLIGHT: WHAT HAPPENS WHEN A CENTRAL BANK DELIBERATELY SAYS LESS
Buried in yesterday's minutes is a proposal that would represent the most significant change to how the Federal Reserve operates in roughly two decades. Chair Warsh has proposed reducing the FOMC from eight meetings a year to six. Taken with what he has already removed, it amounts to a coherent and deliberate philosophy — and one worth understanding, because it has a measurable price attached that this market is already paying.
Part I — What Has Been Removed
Four changes, three implemented and one proposed. Forward guidance has been eliminated — the Committee no longer signals the likely future path of rates. The post-meeting statement has been cut to roughly 132 words from 341.The dot plot has been removed from meetings without a full projection round. And now, the calendar would fall from eight meetings to six.
Each in isolation is defensible. Together they describe a central bank that has decided to communicate substantially less, on purpose.
Part II — The Case For It, Which Is Better Than It Sounds
The intellectual argument runs roughly as follows, and it is not frivolous.
Forward guidance makes markets trade the central bank rather than the economy. When the Fed tells markets what it expects to do, market prices come to reflect the Fed's forecast rather than an independent assessment of the data. The central bank then looks at those prices for confirmation — and finds its own view reflected back. This is a reflexivity problem, and it degrades the informational content of exactly the prices policymakers rely on.
Guidance also creates a commitment the Committee may not want to honour. Having signalled a path, deviating from it carries a credibility cost — so the Fed becomes slower to respond to new information than it should be. Warsh's stated view, expressed when he eliminated guidance, is that markets work better reacting to data than to the Fed's anticipated reaction to data.
And the argument for fewer meetings is genuinely serious. Eight meetings a year means a decision roughly every six weeks, which is faster than most economic data can meaningfully change. That creates pressure to do something at each one, and it forces the Committee into tactical adjustments when the important questions are strategic. More time between meetings means more accumulated evidence per decision. Several major central banks operate perfectly well on eight or fewer.
Part III — The Case Against, and the Price Being Paid
The counter-argument is not that transparency is inherently virtuous. It is narrower and more practical.
Forward guidance was invented as a policy tool, not as a courtesy. When policy rates reach zero, a central bank cannot cut further — but it can still affect long rates by credibly promising to keep short rates low for a long time. That promise is the stimulus. Eliminating guidance in a period of elevated rates costs little; eliminating it as an institutional norm removes an instrument that may be needed when rates are next at zero.
The more immediate objection is that predictability has a market price, and we can observe it. Yesterday's brief set out why the thirty-year Treasury yield reached a 19-year high while expectations of Fed policy collapsed: term premium, the compensation investors demand for the risk of lending long. One of the three components of that risk is uncertainty about how the central bank will behave. An investor who cannot predict the reaction function requires payment for that ignorance, and that payment is embedded in every long yield, every mortgage rate and every equity discount rate in the economy.
THE TRADE-OFF, STATED AS PLAINLY AS WE CAN
Less communication reduces the risk that markets front-run the Fed and stop processing data independently. It increases the risk premium investors charge for holding long-dated assets. Both effects are real; neither is free. The honest position is that the first is a genuine benefit and hard to measure, while the second is a genuine cost and unusually easy to measure — and that asymmetry should make us cautious about concluding too quickly which dominates. What can be said is that the timing is awkward. A central bank reduces its communication most safely when its reaction function is otherwise predictable — stable inflation, a settled committee, no live supply shock. The current configuration is the opposite: a 9-3 vote, an inflation outlook the Committee itself calls "highly uncertain" with upside risks, a contested chokepoint pushing crude above $90, and a term premium already at levels not seen in nearly two decades. Removing information from a market that is visibly struggling to price uncertainty is a choice with a knowable cost, and the thirty-year is where that cost shows up.
Part IV — What Six Meetings Would Actually Change
Three consequences follow reasonably directly, and only the first is widely discussed.
Each meeting becomes a bigger event. Fewer decision points concentrate the same volume of policy news into fewer moments. Implied volatility around meeting dates would rise, and the market's tendency to position ahead of them would intensify. Reducing the frequency of decisions does not reduce the total quantity of surprise; it redistributes it into larger discrete packets.
Inter-meeting moves become more likely and more alarming. If a shock arrives with ten weeks until the next scheduled meeting, the Committee must either wait — potentially far too long — or act between meetings. An unscheduled move is a much louder signal than a scheduled one, and central banks avoid them precisely because they convey alarm. A six-meeting calendar makes the choice between paralysis and panic more frequent.
The information vacuum gets filled by speeches. This is the outcome we would expect and it partly defeats the purpose. If the formal channel narrows, market attention shifts to individual officials' remarks — which are less considered, less collective and less authoritative than a statement agreed by the Committee. Reducing official communication does not reduce the market's demand for information about the Fed. It changes where that demand is met, usually for the worse.
Part V — How to Watch It
The proposal was discussed, not adopted, and it may not survive committee. What is worth watching is narrower and observable: the term premium embedded in long-dated Treasuries, and the behaviour of implied volatility around FOMC dates. If the redesign is working as intended — markets processing data independently rather than trading the Fed — one would expect long yields to become more responsive to economic releases and less responsive to Fed speeches. If it is not working, one would expect what we have observed over the past fortnight: long yields rising through soft data, driven by a risk premium the Federal Reserve is itself contributing to.
8. ANALYST CALLS DRIVING ACTION
Rates desks will spend today on two questions: whether the buyback rally in the long end holds beyond forty-eight hours, and what a six-meeting calendar would mean for positioning around policy dates. Equity strategists have the cleaner problem — after Walmart, the consumer slowdown is no longer a forecast but a reported fact, and the discretionary complex has to be marked against it.
9. STOCKS TO WATCH
Walmart (WMT) — Beat and raised, with US comps the slowest in six years. Both facts are true and the second one is about the country.
Target (TGT) / Home Depot (HD) / Lowe's (LOW) — The completed retail set. Professional demand holding, discretionary deferring.
Dollar General (DG) / Dollar Tree (DLTR) — The trade-down beneficiaries if Walmart's commentary is representative.
Nvidia (NVDA) — Late August, and the last print that moves the index.
Micron (MU) / Western Digital (WDC) — Memory, and among the most term-premium-sensitive assets in the market.
TLT and the long end — Whether the buyback rally holds is today's cleanest test.
Homebuilders (DHI / LEN / TOL / KBH) — Mortgage rates follow the thirty-year, not the Fed. The buyback helps them more than a September hold would.
Symbotic (SYM) / Serve Robotics (SERV) / Teradyne (TER) / Cognex (CGNX) — Physical AI, and the margin answer when volumes soften.
CEG / VST / TLN / GEV / PWR — AI-power on contracted cash flows; long-dated contracts are exactly what a higher term premium discounts hardest.
Cameco (CCJ) / BWX Technologies (BWXT) — Longer-dated expression of the power constraint.
Tankers and refiners — Brent above $90 with Hormuz still contested.
Gold (GLD) — Fiscal anxiety and policy uncertainty are its two best arguments, and both strengthened yesterday.
10. GLOBAL MACRO SNAPSHOT
The institutional question in yesterday's minutes has an international dimension worth noting. The Federal Reserve has been the global standard-setter for central bank transparency for three decades — the dot plot, the press conference and explicit forward guidance were American innovations that other central banks copied. A deliberate reversal will be watched closely by the European Central Bank, the Bank of England and the Bank of Japan, none of which has signalled any intention to follow.
The long-end selloff remains global rather than American, which continues to suggest a worldwide reassessment of the cost of holding long-dated government paper at a time when most developed economies are running large deficits simultaneously.
Brent above $90 remains the principal upside risk to an otherwise improving inflation picture, and lands hardest on the importers with the least domestic production.
11. WEEK AHEAD PREVIEW
Today: Walmart and claims are in; the long end's behaviour into the close is the thing to watch.
Sep 9: The enlarged Treasury buyback operations begin at a $4bn maximum.
Late August: the PCE deflator — substantially estimable already from CPI and PPI — and Nvidia's second quarter.
Sep 15-16: FOMC. Roughly 30% priced, no dot plot, no forward guidance, and possibly the last eight-meeting year.
12. THE CLOSING THOUGHT
Yesterday's minutes told us two things. The first was expected: the July vote was 9-3, with Hammack, Kashkari and Logan each preferring a quarter-point increase, and hawkish sentiment extending well beyond them — participants said tightening "would likely be necessary if inflation did not decline." Inflation has since declined, which is why September sits at 30% rather than 67%. The second was not expected: Chair Warsh has proposed cutting the Federal Reserve's meeting calendar from eight a year to six, on top of having already eliminated forward guidance, removed the dot plot from non-projection meetings and cut the statement to 132 words. There is a real argument for all of it — markets that trade the central bank rather than the data are worse at their job, and a decision every six weeks is faster than the economy changes. There is also a price, and this week has been an unusually clear demonstration of what it is: the thirty-year touched a 19-year high while expectations of Fed policy collapsed, because investors charge for uncertainty about the reaction function, and the Fed has chosen to supply more of it. Meanwhile Walmart beat on earnings, beat on revenue, raised full-year guidance on both, and reported the slowest US comparable sales growth in six years. A well-run company extracting more from a customer who is buying less. That is now the consistent finding across six separate readings, and it is the most important thing in the market. Good luck today.
THE BROOKSIDE BRIEF · COMPILED 9:45 AM ET · SOURCES: FEDERAL RESERVE, MINUTES OF THE 28-29 JULY 2026 FOMC MEETING, RELEASED 19 AUGUST 2026; QUARTZ AND ABA BANKING JOURNAL (MINUTES DETAIL, DISSENTERS, MEETING-FREQUENCY PROPOSAL); WALMART INC. SECOND QUARTER FISCAL 2027 RESULTS, RELEASED 20 AUGUST 2026, AND CNBC AND INVESTING.COM (RESULTS AND REACTION); DEPARTMENT OF LABOR VIA INVESTINGLIVE (INITIAL CLAIMS, WEEK ENDING 15 AUGUST 2026); CNBC AND THESTREET (19 AUGUST SESSION AND TREASURY BUYBACK EFFECT ON YIELDS); US CENSUS BUREAU RETAIL TRADE REPORT AND UNIVERSITY OF MICHIGAN SURVEYS OF CONSUMERS (CONSUMER DATA REFERENCED IN FIG. 3) · WE HAVE NOT PRINTED A PRECISE CLOSING LEVEL FOR 19 AUGUST BECAUSE OUR SOURCES DISAGREED AND WE COULD NOT RECONCILE THEM AGAINST A PRIMARY FEED BEFORE PUBLICATION · FIG. 1 AND FIG. 3 ARE ILLUSTRATIVE; THE SERIES SHOWN ARE NOT ON COMMON SCALES · THE SIX-MEETING CALENDAR WAS DISCUSSED IN COMMITTEE AND HAS NOT BEEN ADOPTED · NOTHING IN THIS BRIEF IS INVESTMENT ADVICE
MORNING EDITION · FRIDAY, AUGUST 21, 2026 · BUYBACK RELIEF EVAPORATES · DOW -703 · WALMART -8% · BRENT $93.64 · JACKSON HOLE NEXT WEEK
Daily Markets Briefing
The Brookside Brief
Markets · Macro · The Day Ahead
1. THE MORNING SETUP
Good morning. On Wednesday we wrote that the question of the day was "whether a $2 billion change in operation size is a solution or a signal." On Thursday we said the cleanest test was "whether the buyback rally in the long end holds beyond forty-eight hours." It did not hold for twenty-four.
The thirty-year Treasury yield fell more than ten basis points to 5.184% on Wednesday after the Treasury announced it would at least double its long-dated buybacks. On Thursday it rose 5.5 basis points to 5.249%, and this morning sits near 5.25% — back within striking distance of Tuesday's 19-year high. The ten-year has made the same round trip, from 4.637% Wednesday to 4.70% Thursday and roughly 4.71% now.
Equities took it badly. The Dow fell 703.84 points, or 1.32%, to 52,759.21. The S&P 500 lost 0.87% to 7,641.16 and the Nasdaq 1.0% to 26,067.17.Walmart fell roughly 8%, its sharpest single-session decline in four years, on the comparable sales miss we covered yesterday — management attributed customer "trade-offs" partly to high petrol prices, which connects the two halves of this week rather neatly.
Because Brent is now $93.64. It was $84.70 when we reported it on the tenth. That is a 10.6% rise in eleven days, and it is the one problem in this market that neither the Federal Reserve nor the Treasury has any instrument to address.
Futures are attempting a bounce — Nasdaq 100 contracts up about 0.5%, S&P 500 futures up 0.25% — though gold's continued strength suggests the underlying tone is defensive rather than genuinely improved. Flash purchasing managers' indices are today's data, and their price components will matter more than the headline.
And next week is Jackson Hole, 27 to 29 August, with Chair Warsh's first keynote as chairman on the Friday morning. Section 7 covers why this week's intervention failed and what that symposium can and cannot fix.
2. MARKETS AT A GLANCE
THURSDAY AUGUST 20 CLOSE
Asset
Last
Change
% Chg
Dow Jones Industrial Avg.
52,759.21
-703.84
-1.32%
S&P 500
7,641.16
—
-0.87%
Nasdaq Composite
26,067.17
—
-1.00%
Walmart (WMT)
—
—
≈-8%
THE LONG END — THE ROUND TRIP IN FULL
Measure
Level
Change
Note
30-year, Tuesday high
≈5.33-5.34%
19-year high
since June 2007
30-year, Wednesday post-buyback
5.184%
-10 bps
the relief
30-year, Thursday
5.249%
+5.5 bps
the reversal
30-year, this morning
≈5.25%
—
unrelieved
10-year, Wednesday
4.637%
-6 bps
—
10-year, Thursday
4.70%
+4.7 bps
—
10-year, this morning
≈4.71%
—
—
THIS MORNING
Asset
Last
Change
% Chg
Nasdaq 100 futures
—
+0.5%
—
S&P 500 futures
—
+0.25%
—
Brent crude
$93.64
from $84.70 on 10 Aug
+10.6%
Sept hike probability
≈30%
—
—
NEXT WEEK
When
What
Detail
Note
Aug 27-29
Jackson Hole symposium
~120 officials, 70+ countries
—
Fri Aug 28, AM
WARSH KEYNOTE
first as chairman
THE EVENT
Theme
"Financial Innovation:
Implications for Payments
and Policy"
3. TOP STORIES
The Buyback Relief Lasted One Session
Fig. 1 — Down ten basis points Wednesday, up five and a half Thursday.
Treasury Secretary Scott Bessent's decision to at least double long-dated buybacks — from $2 billion to at least $4 billion per operation, targeting the ten-to-twenty and twenty-to-thirty-year sectors from 9 September — produced exactly the reaction one would expect on the day and almost none of it the day after.
Wednesday: thirty-year down more than ten basis points to 5.184%, ten-year down more than six to 4.637%, equity futures up sharply. Thursday: thirty-year up 5.5 basis points to 5.249%, ten-year up 4.7 to 4.70%, and the Dow down 703 points.
The explanation offered by strategists is the correct one. Luis Alvarado of Wells Fargo Investment Institute described the move as providing only "short-term relief" because the drivers pushing yields higher — inflation, monetary policy uncertainty and large fiscal deficits — are all still in place. Section 7 works through why that was predictable from the arithmetic alone.
Walmart Falls 8% — the Sharpest Drop in Four Years
Walmart's decline was the single largest drag on the Dow. The shares fell roughly 8%, the sharpest single-session fall in four years, despite beating on earnings and revenue and raising full-year guidance — because US comparable sales excluding fuel grew just 2.6% against a 3.67% consensus, the slowest domestic growth in six years.
The detail worth carrying is management's explanation: customers are making "trade-offs," attributed in part to high petrol prices. That is the mechanism by which a contested chokepoint in the Persian Gulf reaches a supermarket basket in Arkansas, and it is the connection between the two stories dominating this week. Energy is not merely an inflation input. It is a tax on discretionary spending that shows up in somebody else's revenue line.
Brent at $93.64
Fig. 3 — Every morning this brief has quoted Brent since the tenth, it has been higher.
Brent has risen from $84.70 on 10 August to $93.64 this morning — 10.6% in eleven days — on attacks on shipping and conflicting accounts of whether the Strait of Hormuz is open. We continue to flag that Washington and Tehran give irreconcilable accounts and that we cannot adjudicate between them.
This is now the most important unresolved variable in the market and the one with the fewest available remedies. The Federal Reserve cannot produce barrels. The Treasury cannot buy back a chokepoint. And as we set out on 10 August, the delivered cost of a cargo — war-risk premium and freight included — has been rising considerably faster than the screen price, so the $93.64 headline understates the pressure reaching refiners and, eventually, consumers.
Jackson Hole Next Week — and the Theme Is Not Monetary Policy
The Kansas City Fed's symposium runs 27 to 29 August, drawing roughly 120 central bankers, economists and officials from more than 70 countries. Chair Warsh delivers his first Jackson Hole keynote as chairman on the Friday morning.
This year's theme is "Financial Innovation: Implications for Payments and Policy" — not the policy outlook, not inflation, not the labour market. Given that Warsh has eliminated forward guidance, cut the statement to roughly 132 words and proposed reducing the meeting calendar from eight to six, a market hoping for a signal about September may be in for a lesson about payment rails instead. Section 7 addresses what that would mean.
4. MACRO & FED WATCH
The September question sits at roughly 30%, and this week did nothing to move it in either direction. The data continued to soften — claims at 206,000, Walmart's US comparables at a six-year low — while energy continued to harden, with Brent up 10.6% in eleven days. Those pull in opposite directions and roughly cancel.
What did change this week is that the long end stopped responding to any of it. The thirty-year is within a few basis points of a 19-year high after a fortnight of soft inflation data, a negative payroll print, a consumer retrenchment and an explicit government intervention. That is a bond market pricing something other than the near-term policy path — fiscal supply, an uncertain reaction function, and a wider distribution of inflation outcomes.
Today's flash purchasing managers' indices are the last data of the week, and the price sub-components matter more than the headline — they are the earliest available read on whether $93 crude is reaching input costs.
5. ECONOMIC CALENDAR
Day
Time (ET)
Release / Event
Note
Fri Aug 21
9:45 AM
Flash PMIs
Watch the price components
Aug 27-29
—
JACKSON HOLE SYMPOSIUM
"Financial Innovation"
Fri Aug 28
AM
WARSH KEYNOTE
First as chairman
Late Aug
8:30 AM
PCE deflator
The Fed's preferred measure
Late Aug
AH
Nvidia Q2
Season's last major report
Sep 9
—
Enlarged buybacks begin
$4bn maximum
Sep 15-16
2:00 PM
FOMC
≈30% hike priced
6. EARNINGS WATCH
The retail week is complete and the verdict is uniform beneath the divergent share prices. Home Depot beat. Target beat on comparables and raised guidance, with roughly 40% of earnings from a one-off tariff refund. Lowe's guided cautiously and fell 3.5%. Walmart beat on earnings and revenue, raised guidance on both, and fell 8% on the slowest US comparable sales growth in six years.
Four well-run companies, executing well, against a customer buying less. Nvidia in late August is the last print of the season, and it now carries the additional burden of being the only remaining catalyst capable of changing the market's direction before the September meeting.
7. SECTOR SPOTLIGHT: WHY THE BUYBACK FAILED, AND WHAT JACKSON HOLE CAN AND CANNOT FIX
Two institutions tried to influence the long end of the Treasury curve this week. One of them acted and the effect lasted a single session. The other speaks next Friday. Understanding why the first failed is the best available guide to what the second can realistically achieve.
Part I — The Distinction That Explains It
Financial markets suffer two quite different kinds of problem, and interventions that address one are useless against the other.
A liquidity problem is when willing buyers exist but cannot transact efficiently. Bid-offer spreads widen, dealers cannot warehouse inventory, prices gap around because the plumbing has seized rather than because anybody has changed their mind about value. Buybacks are an excellent remedy for this. The Treasury stands ready to purchase off-the-run securities, dealers can offload inventory, spreads narrow and the market functions again. This is close to the original stated purpose of the buyback programme.
A supply problem is when the quantity of paper exceeds what buyers want to hold at current prices. Nobody's plumbing is broken. The market is working perfectly and delivering an answer people dislike: at 5.18% there are not enough buyers for the amount of thirty-year debt on offer, so the yield must rise until there are.
The Treasury's action addressed the first problem. The bond market has the second. That is the whole of it, and Thursday's reversal is what happens when you apply the right tool to the wrong ailment.
Part II — The Arithmetic Was Always Going to Win
Fig. 2 — The intervention against the thing it was intervening in.
Set the two numbers beside each other and the outcome stops being surprising.
The buyback maximum rose from $2 billion to at least $4 billion per operation. The July federal deficit was $432 billion. A single operation is therefore worth roughly nine-tenths of one percent of one month's borrowing. Operations recur, so the honest comparison is more favourable than that ratio implies — but not by enough to change the conclusion.
And there is a more fundamental limitation: a buyback does not reduce borrowing at all. The Treasury must fund the repurchase, and it does so by issuing other debt — typically shorter-dated. The net effect is not less government debt; it is the same debt with a shorter average maturity. Long yields fall because long-dated supply falls. Short-dated supply rises correspondingly, and the government's exposure to refinancing risk rises with it.
That is a real trade-off, and it is one governments have made before with mixed results. Shortening the maturity profile lowers borrowing costs today and increases sensitivity to rate rises tomorrow. A country running a $432 billion monthly deficit while shortening its debt is making a bet on the direction of short rates.
WHY 'THE TREASURY IS WATCHING' IS THE ACTUAL MESSAGE
One published account headlined the episode with the phrase "the Treasury is watching," and that captures what genuinely changed. The economic effect of the buyback expansion is small. The informational effect is not. A finance ministry that enlarges an operation days after a nineteen-year high in its own long bond has communicated that it regards those levels as unwelcome and is prepared to act. Markets price that. The difficulty is that a signal only works if the market believes there is meaningful capacity behind it, and here the arithmetic is public: the deficit is enormous, the debt is approaching $40 trillion, and the tool being deployed is worth a fraction of a percent of monthly issuance. This is why the relief lasted a day. The market took the signal seriously for as long as it took to check the numbers behind it — which is roughly one session. The lesson generalises: interventions that are primarily signals work in proportion to the credibility of the capacity behind them, and that capacity is usually a matter of public record.
Part III — What Jackson Hole Actually Is
The Federal Reserve Bank of Kansas City has convened an economic symposium in Jackson Hole, Wyoming since 1978, drawing central bankers, academics and finance officials — roughly 120 of them this year, from more than 70 countries. It matters to markets for one structural reason: it is the only regular occasion on which a Federal Reserve chair delivers a substantial prepared address that is not tied to a policy decision.
That freedom has historically made it the venue for framework changes rather than rate signals. Chairs have used it to introduce new analytical approaches, to reframe how the committee thinks about its mandate, and — occasionally — to prepare markets for a shift in direction. The speeches that moved markets most were those that changed how the Fed described its own objective function, not those that hinted at the next meeting.
Part IV — Why This Year's Theme Is the Story
The 2026 theme is "Financial Innovation: Implications for Payments and Policy." Not inflation. Not the labour market. Not the policy outlook.
A market that has just watched the thirty-year touch a nineteen-year high, a consumer roll over, and crude rise 10.6% in eleven days would like a great deal of guidance about September. The chair who will address it has spent his tenure systematically reducing exactly that kind of communication — forward guidance eliminated, statement cut to roughly 132 words, dot plot removed from non-projection meetings, and a proposal to reduce the meeting calendar by a quarter. A symposium themed on payments infrastructure is entirely consistent with that philosophy, and it may be precisely the point.
There are two ways this can go and they have very different consequences.
If Warsh sticks to the theme, the market gets no September signal and must price the meeting from data alone. In the framework we set out on Wednesday, that leaves term premium where it is or pushes it higher — because uncertainty about the reaction function is precisely what term premium compensates for, and a chair declining to reduce that uncertainty at the one venue built for it is itself information.
If he uses the platform to set out how he thinks about policy under his new framework — not a signal about September, but an explanation of the reaction function itself — that would be considerably more valuable than a hint. The market's problem is not that it lacks a forecast for the next meeting. It is that it does not know the rule the committee is applying. A speech that explained the rule would compress term premium far more durably than anything the Treasury can buy back.
WHAT WOULD ACTUALLY BRING THE LONG END DOWN
It is worth being concrete about this, because the past week has demonstrated what does not work. Three things would durably reduce long yields, and none of them is a buyback.First, a smaller deficit — the supply problem is a supply problem, and only fiscal consolidation addresses it at source. That is a matter for Congress rather than for either institution discussed here, and nothing in the current political configuration suggests it. Second, a clearer and more predictable reaction function — if investors can forecast how the Fed responds to a given shock, they demand less compensation for uncertainty. This is available at Jackson Hole next Friday at no fiscal cost whatsoever, which is what makes the choice of theme consequential. Third, a narrower distribution of inflation outcomes — which principally means the Strait of Hormuz reopening, since a contested chokepoint is what has widened the tails. Note that of those three, the cheapest and fastest is the one that requires only that somebody explain themselves clearly. That is an unusual position for a central bank to be in, and it is the argument the Warsh redesign will ultimately be judged on.
8. ANALYST CALLS DRIVING ACTION
Rates strategists have converged quickly on the view that the buyback provides short-term relief without addressing the drivers, which is both correct and unhelpful to anyone positioning. The more actionable question into next week is what a Jackson Hole address themed on payments does to positioning around September — a meeting priced at 30% with no guidance, no dot plot and a committee that split 9-3 the last time it met.
9. STOCKS TO WATCH
Walmart (WMT) — Down roughly 8%, the sharpest fall in four years. Management named petrol prices in the trade-off commentary.
Target (TGT) / Home Depot (HD) / Lowe's (LOW) — The completed retail set, and a consistent story beneath divergent prices.
Nvidia (NVDA) — Late August, and now the only remaining catalyst before September.
Micron (MU) / Western Digital (WDC) — Long-duration assets in a market repricing duration.
TLT and the long end — A round trip completed in twenty-four hours. Watch whether 5.33% holds as resistance.
Homebuilders (DHI / LEN / TOL / KBH) — Mortgage rates follow the thirty-year. This week was unhelpful regardless of what the Fed does in September.
Tankers and refiners — Brent up 10.6% in eleven days with Hormuz contested.
Integrated majors — Upstream leverage to a crude price nobody has an instrument to lower.
Symbotic (SYM) / Serve Robotics (SERV) / Teradyne (TER) / Cognex (CGNX) — Physical AI, and a margin answer when volumes soften.
CEG / VST / TLN / GEV / PWR — AI-power on contracted cash flows; long contracts discount hardest when term premium rises.
Cameco (CCJ) / BWX Technologies (BWXT) — Longer-dated expression of the power constraint.
Gold (GLD) — Strength through an equity bounce is the tell that the tone remains defensive.
10. GLOBAL MACRO SNAPSHOT
The long-end selloff remains synchronised across developed markets, which continues to argue that this is a global reassessment of the cost of holding long-dated government paper rather than a specifically American problem. Most large economies are running substantial deficits at the same time, and they are competing for the same pool of duration buyers.
Jackson Hole will draw officials from more than 70 countries into the same room at a moment when that shared problem is acute. The theme — financial innovation and payments — is not obviously the topic any of them most urgently needs to discuss, though it is a legitimate long-horizon question and symposiums are designed for long-horizon questions.
Brent at $93.64 is a terms-of-trade loss for every major importer and lands hardest on Europe and Asia. For the United States it is comparatively manageable; for economies importing nearly all their crude through the affected sea lanes it is not.
11. WEEK AHEAD PREVIEW
Today, 9:45 AM: flash PMIs. The price components are the part that matters.
Aug 27-29: Jackson Hole, themed "Financial Innovation: Implications for Payments and Policy".
Fri Aug 28, morning: Chair Warsh's first Jackson Hole keynote.
Late August: the PCE deflator and Nvidia's second quarter.
Sep 9: the enlarged buyback operations begin.
Sep 15-16: FOMC. Roughly 30% priced, no dot plot, no forward guidance.
12. THE CLOSING THOUGHT
On Wednesday we asked whether the Treasury's buyback expansion was a solution or a signal, and on Thursday we said the test was whether the rally held for forty-eight hours. It held for one session. The thirty-year fell more than ten basis points to 5.184% on the announcement and was back at 5.249% the following day, with the Dow down 703 points and Walmart off roughly 8% — its worst session in four years — on a comparable sales miss management attributed partly to petrol prices. Which is the through-line of the entire week: a $4 billion operation was never going to resolve a $432 billion monthly deficit, and a buyback funded by shorter-dated issuance does not reduce borrowing at all — it shortens the maturity of it. The market took the signal seriously for exactly as long as it took to check the arithmetic behind it. Meanwhile Brent has risen 10.6% in eleven days to $93.64, and it is the one variable in this market that neither the Federal Reserve nor the Treasury has any instrument to touch. Next Friday Chair Warsh gives his first Jackson Hole address, at a symposium themed on payments infrastructure rather than on the policy outlook. The cheapest available way to bring long yields down is for somebody to explain the reaction function clearly, and next Friday is the venue built for precisely that. Whether he uses it that way is the most consequential question of the coming week. Have a good weekend.
THE BROOKSIDE BRIEF · COMPILED 8:45 AM ET · SOURCES: CNBC AND YAHOO FINANCE (20 AUGUST CLOSE, YIELD MOVES, BUYBACK COVERAGE); CNBC, 19-20 AUGUST 2026 (TREASURY BUYBACK EXPANSION AND SUBSEQUENT REVERSAL; LUIS ALVARADO OF WELLS FARGO INVESTMENT INSTITUTE ON SHORT-TERM RELIEF); BLOOMBERG (BESSENT BUYBACKS JOLT BOND MARKET); THESTREET AND TS2 (FRIDAY FUTURES, BRENT, GOLD); MOTLEY FOOL AND SCHAEFFER'S (WALMART SESSION DECLINE); WALMART INC. Q2 FY2027 RESULTS; REGARDS OF WALLSTREET, INVESTINGLIVE AND KALKINE (JACKSON HOLE DATES, THEME, ATTENDANCE AND WARSH KEYNOTE TIMING); FEDERAL RESERVE MINUTES OF 28-29 JULY 2026 · WALMART'S DECLINE IS REPORTED VARIOUSLY AS 8% AND 9%; WE HAVE USED THE LOWER FIGURE · TUESDAY'S 30-YEAR HIGH IS REPORTED VARIOUSLY AS 5.33% AND 5.34% · ACCOUNTS OF WHETHER THE STRAIT OF HORMUZ IS OPEN REMAIN DISPUTED BETWEEN THE PARTIES · NOTHING IN THIS BRIEF IS INVESTMENT ADVICE
MORNING EDITION · MONDAY, AUGUST 24, 2026 · PMI AT A 52-MONTH HIGH · BITCOIN +22% ON THE WEEK · NVIDIA WEDNESDAY · JACKSON HOLE FRIDAY
Daily Markets Briefing
The Brookside Brief
Markets · Macro · The Day Ahead
1. THE MORNING SETUP
Good morning. Friday produced a number that appears to contradict everything this brief has reported for a fortnight. S&P Global's flash composite purchasing managers' index rose 1.5 points to 56.0 in August — a 52-month high, the fastest US business growth since April 2022, and well above the 54.0 consensus. One economist quoted on the release used the word "booming."
Set that against the past two weeks. Retail sales fell 0.6% with the GDP-relevant control group down 0.4%. Walmart reported its slowest US comparable sales growth in six years and fell 8%. Consumer sentiment collapsed to 51.0. Payrolls fell 23,000 with 103,000 of downward revisions. Both sets of numbers are correct. Section 7 explains how, and the answer turns on what a diffusion index actually measures — which is not what most people assume.
The composition of Friday's print is the first clue. Services surged to 56.8 against 54.0 expected, from 54.6. Manufacturing missed, at 53.2 against 53.9.
Equities finished the week on a strong Friday and a poor week. The S&P 500 rose 0.43% to 7,674.37, the Nasdaq 0.43% to 26,180.45 and the Dow 517.80 points, or 0.98%, to 53,277.01 — and all three still posted weekly losses after the bond market's disorderly stretch.
Bitcoin had an extraordinary week, settling Friday at $78,335 after a 7.26% session and a 22% weekly gain — its best five-day run since March 2024. The drivers were the Treasury buyback announcement triggering more than $1.25 billion of short liquidations, a weaker dollar, the largest spot ETF inflow since May, and a White House meeting with crypto executives at which the President urged Congress to pass the CLARITY Act. It trades near $77,082 this morning.
This morning is heavier. Futures are lower — Dow and S&P contracts off about 0.1%, Nasdaq futures down 0.4% — on new US economic sanctions against Iran and the breakdown of US-Canada trade talks with reciprocal tariff threats. The ten-year yields 4.71% and the two-year 4.22%. Nvidia reports Wednesday. Chair Warsh speaks at Jackson Hole on Friday.
2. MARKETS AT A GLANCE
FRIDAY AUGUST 21 CLOSE — A GOOD DAY IN A BAD WEEK
Asset
Last
Change
% Chg
S&P 500
7,674.37
—
+0.43%
Nasdaq Composite
26,180.45
—
+0.43%
Dow Jones Industrial Avg.
53,277.01
+517.80
+0.98%
All three indices
—
weekly losses
despite Friday
AUGUST FLASH PMI — RELEASED FRIDAY
Measure
Actual
Versus
Note
Composite output
56.0
vs 54.0 exp
52-MONTH HIGH
Services
56.8
vs 54.0 exp
from 54.6 — BIG BEAT
Manufacturing
53.2
vs 53.9 exp
MISS
BITCOIN — BEST FIVE-DAY RUN SINCE MARCH 2024
Measure
Level
Change
Note
Friday settle
$78,335
+7.26%
on the day
Week
—
+22%
strongest since 2024
This morning
≈$77,082
+0.80%
—
Short liquidations
> $1.25bn
—
on the move
THIS MORNING
Asset
Last
Change
% Chg
Dow futures
—
-0.1%
—
S&P 500 futures
—
-0.1%
—
Nasdaq futures
—
-0.4%
—
UST 10-Year
4.71%
—
—
UST 2-Year
4.22%
—
49bp curve
3. TOP STORIES
Business Activity Hits a Four-Year High
Fig. 1 — Services drove the composite to its best reading since April 2022.
The flash composite output index rose to 56.0 from 54.5, a 52-month high and the strongest reading since April 2022. Consensus was 54.0. The gain came entirely from services, which jumped to 56.8 from 54.6 against a 54.0 forecast, while manufacturing slipped to 53.2 against 53.9 expected.
This is a genuinely strong survey and it should not be dismissed. Purchasing managers report on their own firms' order books, output and hiring, and a reading of 56 means a clear majority are seeing improvement. But a PMI answers a narrower question than its prominence suggests, and Section 7 sets out precisely what that question is.
The Divergence Is Now the Story
Fig. 3 — Every business-facing measure is strong; every household-facing measure is weak.
Assemble the past fortnight's data and it separates cleanly along a single line. Measures of business activity — the composite PMI at a 52-month high, services at 56.8, corporate earnings running well ahead of expectations all season — are strong. Measures of household activity — retail sales, the control group, Walmart's comparable sales, payrolls, sentiment — are weak.
The obvious candidate explanation is the artificial intelligence buildout. Data centre construction, semiconductor capital equipment, power generation and the associated professional services are an enormous volume of economic activity that flows almost entirely between businesses and barely touches household consumption. Applied Materials reported a record quarter with guidance 6% above consensus. Nebius grew revenue 454%. That activity registers fully in a business survey and not at all in a retail sales print.
Which raises the question that matters: which one leads? Business investment has historically been the more cyclical and less reliable of the two — it turns later and falls harder. Consumption is roughly two-thirds of the economy and turns first. The honest answer is that a capital expenditure boom financed by a handful of very large balance sheets can sustain measured activity for a considerable time after the consumer has stopped, and that this tells you less about the durability of growth than the composite index suggests.
Bitcoin's 22% Week Was Made in the Bond Market
Bitcoin settled Friday at $78,335, up 7.26% on the session and roughly 22% on the week — its strongest five-day run since March 2024. It trades near $77,082 this morning.
The proximate causes are worth separating. The Treasury's buyback announcement weakened the dollar and triggered more than $1.25 billion of short position liquidations — which is to say a substantial part of the move was forced buying by people closing losing positions rather than fresh conviction. Alongside that: the largest spot ETF inflow since May, and a White House meeting at which the President urged Congress to pass the CLARITY Act.
The instructive part is the sequencing. A Treasury operation aimed at the thirty-year Treasury bond produced a 22% move in bitcoin within days while failing to hold a nine basis point rally in the bond it targeted. That is a reasonable illustration of where marginal liquidity currently flows when the dollar softens.
Iran Sanctions and a US-Canada Breakdown
Two policy developments are weighing on futures. The United States has imposed new economic sanctions on Iran, which does nothing helpful for a Strait of Hormuz negotiation already producing irreconcilable accounts from the two sides. And US-Canada trade talks have broken down, with reciprocal tariff threats following.
The second is the more immediately relevant to inflation. Canada is among the largest US trading partners, and as we set out on 12 August, tariff pass-through reaches consumer prices with a lag measured in quarters rather than weeks. A new tariff round now would begin appearing in core goods prices around the turn of the year — precisely when the current disinflation is expected to have run its course.
4. MACRO & FED WATCH
This is the week the Committee's September decision effectively gets made, and three things land in four days.
Nvidia reports Wednesday, the last earnings print capable of moving the index and the clearest single read on whether the capital expenditure boom sustaining the business-side data is intact.
The PCE deflator is due late this week — the measure the Federal Reserve actually targets, and one substantially estimable already from the July CPI and PPI, as we explained on 13 August.
And Chair Warsh delivers his first Jackson Hole keynote on Friday morning, at a symposium themed "Financial Innovation: Implications for Payments and Policy." As we argued on Friday, the cheapest available way to bring long yields down is for somebody to explain the reaction function clearly, and this is the venue built for it. Whether he uses it that way, or holds to a theme about payment rails, is the most consequential question of the week.
September sits at roughly 30%. The ten-year at 4.71% against a two-year at 4.22% leaves a 49 basis point curve — steeper than it has been, which is what happens when the front end prices a hold and the long end prices everything else.
5. ECONOMIC CALENDAR
Day
Time (ET)
Release / Event
Note
Mon Aug 24
—
Iran sanctions, US-Canada breakdown
Weighing on futures
Wed Aug 26
AH
NVIDIA Q2
Last print that moves the index
Wed Aug 26
AH
Salesforce, CrowdStrike, Veeva, Okta
—
Aug 27-29
—
JACKSON HOLE SYMPOSIUM
"Financial Innovation"
Fri Aug 28
AM
WARSH KEYNOTE
First as chairman
Late this week
8:30 AM
PCE deflator
The Fed's preferred measure
Sep 9
—
Enlarged Treasury buybacks begin
$4bn maximum
Sep 15-16
2:00 PM
FOMC
≈30% hike priced
6. EARNINGS WATCH
Nvidia on Wednesday is the season's last consequential print, and this year it carries an additional burden. The business-side strength described in Section 7 rests substantially on the artificial intelligence capital expenditure cycle. Nvidia is the purest available read on whether that cycle is still accelerating.
The framework we have applied all summer still holds: capital spending growth measured against growth in the revenue line funding it. Applied Materials passed that test — capex up 21% against revenue up 25%. CoreWeave passed it by raising capex and guidance together. What would fail it is Nvidia guiding to continued hyperscaler demand while the hyperscalers themselves moderate.
7. SECTOR SPOTLIGHT: HOW THE ECONOMY CAN BE BOOMING AND CRACKING AT THE SAME TIME
On Friday, S&P Global reported the fastest US business growth in 52 months. Over the preceding fortnight, government data showed the sharpest retail sales decline in over a year, the weakest consumer sentiment in years, negative payrolls, and the slowest comparable sales growth at the world's largest retailer since 2020. These are not contradictory readings of the same thing. They are accurate readings of different things, and the distinction is worth understanding properly.
Part I — What a PMI Actually Measures
Fig. 2 — Two entirely different economies producing the identical index reading.
The single most important fact about a purchasing managers' index is that it is a diffusion index, and almost nobody who quotes one has internalised what that means.
Each month, S&P Global asks purchasing managers a set of questions with three possible answers: better, same, or worse than last month. The index is then computed as the percentage answering "better" plus half the percentage answering "same." A reading of 50 means as many firms improved as deteriorated. Above 50 means more improved than deteriorated.
That is all it means. A diffusion index measures breadth, not magnitude.
The consequence is worth stating starkly, because it is the whole of the misunderstanding. A firm whose output rose 0.1% and a firm whose output rose 30% both answer "better" and count identically. An economy in which six of ten firms grew by a hair and four shrank badly produces exactly the same index reading as one in which six firms boomed and four declined slightly — as Figure 2 illustrates. The index tells you how many are improving. It tells you nothing whatsoever about by how much.
THREE FURTHER PROPERTIES WORTH KNOWING
First, PMIs are month-on-month, not level. A firm that collapsed last month and merely stabilised this month answers "better." After a weak period, diffusion indices rebound sharply simply because the comparison base is low — which is why they overstate turning points in both directions. Second, they are unweighted by firm size. A ten-person consultancy and a multinational each cast one response, so a survey can register broad improvement while the firms that account for most of the output are struggling, or the reverse. Third, and most usefully, the sub-indices carry more information than the headline. New orders lead output; the employment component leads hiring data; and the prices-paid and prices-charged components are the earliest available read on cost pass-through — which, with Brent up over 10% in eleven days, is the part of Friday's release worth reading most closely. The correct use of a PMI is as a fast, broad directional signal published weeks before the hard data. It is not a measure of how fast the economy is growing, and it should never be used as one.
Part II — Who Is Being Asked
The second reconciliation is simpler and arguably more important. The two sets of data are surveying different populations about different things.
A PMI asks purchasing managers at businesses about their firm's activity. That activity includes sales to other businesses, exports, government contracts and capital projects. The University of Michigan asks households how they feel and the Census Bureau asks retailers what consumers actually spent. There is no reason those must agree, and at present there is a very specific reason they do not.
The artificial intelligence buildout is an enormous volume of business-to-business activity that never passes through a household. Data centre construction, semiconductor capital equipment, electrical infrastructure, power generation, and the engineering and professional services that surround them. Applied Materials reported record revenue up 25% with guidance 6% above consensus. Nebius grew revenue 454%. Intel raised $20 billion to build capacity. Every dollar of that registers in a business survey. None of it registers in retail sales.
The services split within Friday's release is consistent with this. Services at 56.8 is not principally restaurants and haircuts — the category includes financial services, technology, logistics and business services, which are where the buildout's spending lands. Manufacturing at 53.2, which contains rather more consumer-facing production, missed.
Part III — Which One Leads
So both are true. The useful question is which is the better guide to the next twelve months, and here the historical record is reasonably clear and uncomfortable.
Consumption is roughly two-thirds of the American economy. Business investment is closer to one-eighth. When they diverge, the arithmetic favours the larger component eventually dominating. More importantly, business investment is the more cyclical of the two — it is financed by expectations of future demand, so it turns later than consumption and falls harder when it turns.
The specific risk in the current configuration is concentration. The capital expenditure sustaining the business-side data is not broadly distributed across the corporate sector. It is concentrated in a small number of very large technology balance sheets making long-dated bets on artificial intelligence demand. That spending is discretionary, it is announced in advance, and it can be moderated far more quickly than a consumer recession can be reversed.
We do not read Friday's 56.0 as evidence the consumer data was wrong. We read it as evidence that a capital expenditure boom is currently large enough to offset a consumer slowdown in the aggregate statistics — which is a genuinely good thing while it lasts, and a materially different proposition from broad-based strength. Nvidia on Wednesday is the most direct available test of how long it lasts.
THE PRACTICAL RULE FOR READING CONTRADICTORY DATA
When two credible series disagree, the resolution is almost never that one is wrong. Four questions usually locate the difference.Who is being surveyed — households, firms, or neither? Business and household surveys can diverge for years when the composition of growth shifts. Is it a level or a change? Diffusion indices measure change and rebound mechanically from weak bases; sentiment indices measure level and can stay depressed indefinitely. Is it hard data or survey data? Retail sales record transactions that occurred; PMIs and sentiment record opinions about them, and the gap between the two has been unusually wide since 2022. And what share of the economy does it actually cover? A series measuring one-eighth of output can move violently without telling you much about the other seven-eighths. Applied here, the answer is that America currently has a business economy running at a four-year high and a household economy contracting, and the honest position is to hold both facts simultaneously rather than pick the one that suits your positioning.
8. ANALYST CALLS DRIVING ACTION
Third-quarter GDP tracking estimates face competing revisions this week — the control group miss pulls them down, the PMI pulls them up, and the two work through different channels. The more consequential positioning question is Nvidia on Wednesday, which will determine whether the business-side strength described above has another quarter in it. Rates desks are largely flat into Jackson Hole.
9. STOCKS TO WATCH
Nvidia (NVDA) — Wednesday. The last print that moves the index, and the cleanest test of the capex cycle holding up the business-side data.
Salesforce (CRM) / CrowdStrike (CRWD) / Okta (OKTA) — Also Wednesday. Enterprise software is where a services PMI of 56.8 should show up if it is real.
Applied Materials (AMAT) — Record quarter, capex up 21% against revenue up 25%. Passed the coverage test.
Walmart (WMT) / Target (TGT) / Home Depot (HD) / Lowe's (LOW) — The household side of the divergence.
CEG / VST / TLN / GEV / PWR — AI-power. The buildout is the business-side economy; these are how it gets electricity.
Cameco (CCJ) / BWX Technologies (BWXT) — Longer-dated expression of the power constraint.
Symbotic (SYM) / Serve Robotics (SERV) / Teradyne (TER) / Cognex (CGNX) — Physical AI, and a margin answer when household volumes soften.
Tankers and refiners — Brent above $93 with new Iran sanctions and Hormuz contested.
Homebuilders (DHI / LEN / TOL / KBH) — A ten-year at 4.71% is the binding constraint, not the September decision.
TLT — Steeper curve, 49 basis points between two and ten years.
Gold (GLD) — Fiscal anxiety, policy uncertainty and a weaker dollar remain intact.
10. GLOBAL MACRO SNAPSHOT
The US-Canada breakdown is the significant new development. Reciprocal tariff threats between two of the largest bilateral trading relationships in the world would, on the mechanism we described on 12 August, begin reaching American consumer prices around the turn of the year — with importers and retailers absorbing the cost in margin first and passing it on as contracts reset.
New US sanctions on Iran complicate an already irreconcilable set of accounts about the Strait of Hormuz. We continue to flag that Washington and Tehran describe the situation in incompatible terms and that we cannot adjudicate between them.
Jackson Hole will draw officials from more than 70 countries this week at a moment when the long-end selloff remains synchronised across developed markets. The shared problem — large simultaneous deficits competing for the same duration buyers — is not on the official agenda.
11. WEEK AHEAD PREVIEW
Wed Aug 26: Nvidia after the close, with Salesforce, CrowdStrike, Veeva and Okta.
Aug 27-29: Jackson Hole, themed "Financial Innovation: Implications for Payments and Policy".
Fri Aug 28: Chair Warsh's first Jackson Hole keynote as chairman.
Late this week: the PCE deflator, the measure the Fed actually targets.
Sep 9: the enlarged Treasury buyback operations begin.
Sep 15-16: FOMC. Roughly 30% priced, no dot plot, no forward guidance.
12. THE CLOSING THOUGHT
Friday's flash composite purchasing managers' index came in at 56.0, a 52-month high and the fastest US business growth since April 2022, with services at 56.8. It landed at the end of a fortnight in which retail sales fell 0.6%, the control group fell 0.4%, sentiment collapsed to 51.0, payrolls went negative and Walmart posted its slowest US comparable sales growth in six years. Both are accurate, and the reconciliation is the most useful thing in this brief: a PMI is a diffusion index, which measures how many firms are improving and tells you nothing at all about by how much — a company growing 0.1% and one growing 30% answer the same question identically. More fundamentally, business surveys and household data are measuring two different economies, and at the moment those economies are doing different things. An artificial intelligence buildout worth hundreds of billions flows between businesses and never passes through a supermarket till. The uncomfortable part is that consumption is two-thirds of output and business investment is an eighth, and the smaller one is the more cyclical, the more concentrated and the easier to switch off. Nvidia reports Wednesday, which is the most direct test available of how long the offset lasts. Chair Warsh speaks at Jackson Hole on Friday, at a symposium about payment infrastructure, to a market that would rather hear about September. Have a good week.
THE BROOKSIDE BRIEF · COMPILED 9:00 AM ET · SOURCES: S&P GLOBAL FLASH US PMI, AUGUST 2026, RELEASED 21 AUGUST 2026, AS REPORTED BY ROIC NEWS, KUCOIN, DAYTRADERS AND CNBC; CNBC, YAHOO FINANCE AND THESTREET (21 AUGUST CLOSE AND WEEKLY PERFORMANCE); CNBC, BLOOMBERG, FORTUNE AND RIO TIMES (BITCOIN WEEKLY MOVE, SETTLEMENT AND DRIVERS); BENZINGA, THESTREET AND YAHOO FINANCE (MONDAY FUTURES, IRAN SANCTIONS, US-CANADA TALKS, YIELDS, BITCOIN LEVEL); US CENSUS BUREAU RETAIL TRADE REPORT AND UNIVERSITY OF MICHIGAN SURVEYS OF CONSUMERS (CONSUMER DATA REFERENCED IN FIG. 3); WALMART Q2 FY2027 RESULTS; REGARDS OF WALLSTREET AND KALKINE (JACKSON HOLE) · FIG. 2 IS ILLUSTRATIVE OF DIFFUSION-INDEX MECHANICS AND USES HYPOTHETICAL FIRM-LEVEL DATA · FIG. 3 SHOWS DIRECTION AND ROUGH STRENGTH ONLY; THE SERIES ARE NOT ON A COMMON SCALE · THE PCE RELEASE DATE IS GIVEN AS LATE THIS WEEK RATHER THAN A SPECIFIC DAY · ACCOUNTS OF WHETHER THE STRAIT OF HORMUZ IS OPEN REMAIN DISPUTED BETWEEN THE PARTIES · NOTHING IN THIS BRIEF IS INVESTMENT ADVICE
MORNING EDITION · TUESDAY, AUGUST 25, 2026 · CHIPS DRAG THE NASDAQ · NVIDIA TOMORROW · JACKSON HOLE FRIDAY · THE RESET WALL
Daily Markets Briefing
The Brookside Brief
Markets · Macro · The Day Ahead
1. THE MORNING SETUP
Good morning. Yesterday's brief argued that America currently has two economies — a business economy at a four-year high and a household economy contracting — and asked which one leads. A reader sent us a piece published on 20 August that answers that question with a mechanism and a date, and it is the most rigorous bear case on the artificial intelligence complex we have read. Section 7 is devoted to it, with the counterarguments given their due.
The tape is setting up for it. Monday split badly: the Dow rose 140.15 points, or 0.3%, to 53,417.16, while the Nasdaq fell 200.26 points, or 0.8%, to 25,980.19 and the S&P slipped 21.51 points, or 0.3%, to 7,652.86. The damage was concentrated exactly where it would be if the market were beginning to ask this question: Micron fell 5.8%, AMD more than 3% and Broadcom more than 2%.
This morning futures have recovered — Dow and S&P contracts up nearly 0.5%, Nasdaq 100 futures up 0.9%, with Nvidia itself up more than 1% premarket — as Treasury yields eased and risk appetite improved.
Nvidia reports tomorrow after the close. The focus areas named by the street are the Rubin product cycle, gross margins, and — significantly for what follows — the company's financial support for major AI projects. That last item is not a footnote. It is close to the centre of the argument in Section 7.
2. MARKETS AT A GLANCE
MONDAY AUGUST 24 CLOSE — THE CHIP COMPLEX LED LOWER
Asset
Last
Change
% Chg
Dow Jones Industrial Avg.
53,417.16
+140.15
+0.30%
S&P 500
7,652.86
-21.51
-0.30%
Nasdaq Composite
25,980.19
-200.26
-0.80%
Micron (MU)
—
—
-5.80%
Advanced Micro Devices (AMD)
—
—
-3%+
Broadcom (AVGO)
—
—
-2%+
THIS MORNING
Asset
Last
Change
% Chg
Dow futures
—
+0.5%
—
S&P 500 futures
—
+0.5%
—
Nasdaq 100 futures
—
+0.9%
—
Nvidia (NVDA)
—
+1%
premarket
Treasury yields
—
lower
—
THE RESET WALL — THE AUTHOR'S MODELLED FIGURES, NOT DISCLOSURES
Measure
Estimate
As at
Note
Contracted backlog, top four US clouds
≈$2.3tn
Q2 2026
seller-side RPO
Of which OpenAI and Anthropic
≈$1.0tn
—
two private counterparties
Reported gross debt, AI complex
≈$470bn
—
what is booked
PV of compute commitments
≈$1.66tn
—
what is not
Economic obligation
≈$2.1tn
—
vs $1.3tn subprime, Mar 2007
Notional recasting, 2027
≈$732bn
—
system-wide
Notional recasting, 2028
≈$820bn
—
system-wide
3. TOP STORIES
Chips Led the Market Lower
Monday's session was a clean split. The Dow rose 0.3% while the Nasdaq fell 0.8%, with the decline concentrated in semiconductors — Micron off 5.8%, AMD off more than 3%, Broadcom off more than 2%. New US sanctions on Iran and the breakdown of US-Canada trade talks provided the macro backdrop, but the sector-specific damage suggests something narrower.
The chip complex has now had several sessions of underperformance into Nvidia's print, which is consistent either with ordinary pre-earnings de-risking or with the beginning of a more fundamental reassessment. Tomorrow distinguishes between them.
Nvidia Reports Tomorrow — and the Vendor Financing Question
Nvidia reports after the close on Wednesday. Consensus attention is on the Rubin product cycle and gross margins. The third named focus area — the company's financial support for major AI projects — deserves more weight than it usually receives.
When a supplier provides financing to its customers, revenue growth and credit exposure become the same number. That is not necessarily improper and it is common in capital goods industries. But it changes what a revenue beat means: part of the demand is being funded by the vendor recognising it. Section 7 explains why this specific question is the hinge of the most serious bear case on the complex.
A Reader Sends the Reset Wall
The piece driving today's spotlight is Groundbreaker's "The Teaser Period: Why the AI Boom Is Hitting a Reset Wall," published 20 August. Its argument is not that artificial intelligence is a bubble, that demand is fake, or that the technology disappoints. It is narrower and considerably harder to dismiss: that the take-or-pay compute contract has a structure which guarantees a large, dated, contractual step-up in cash obligations across 2027 and 2028, and that the counterparties owing the largest share of it do not currently make money.
4. MACRO & FED WATCH
This is the week that settles September. Nvidia tomorrow, the PCE deflator later this week, and Chair Warsh's first Jackson Hole keynote on Friday at a symposium themed on financial innovation and payments rather than the policy outlook.
September sits near 30%. Treasury yields eased overnight, which is a welcome change after a fortnight in which the thirty-year touched a 19-year high and the Treasury's buyback intervention held for a single session. As we argued on Friday, the cheapest available way to compress long yields is for somebody to explain the reaction function clearly, and Friday is the venue built for it.
5. ECONOMIC CALENDAR
Day
Time (ET)
Release / Event
Note
Wed Aug 26
AH
NVIDIA Q2
Rubin cycle, margins, vendor financing
Wed Aug 26
AH
Salesforce, CrowdStrike, Veeva, Okta
Enterprise software read
Aug 27-29
—
JACKSON HOLE SYMPOSIUM
"Financial Innovation"
Fri Aug 28
AM
WARSH KEYNOTE
First as chairman
Late this week
8:30 AM
PCE deflator
The Fed's preferred measure
Sep 9
—
Enlarged Treasury buybacks begin
$4bn maximum
Sep 15-16
2:00 PM
FOMC
≈30% hike priced
6. EARNINGS WATCH
Nvidia tomorrow is the last print of the season that moves the index, and after today's spotlight it should be read with a specific question in mind. The coverage framework we have applied all summer asks whether capital spending growth is covered by the revenue line funding it. Section 7 adds a second question that is arguably more important: how much of the revenue is being recognised against contracts that have not yet begun billing, and how much of it is financed by the seller.
7. SECTOR SPOTLIGHT: THE TEASER PERIOD
A reader sent us "The Teaser Period: Why the AI Boom Is Hitting a Reset Wall," published by Groundbreaker on 20 August. We have covered this author's work before — the "Second Derivative" framework informed several of our spotlights in July. This piece is better, and it is the most serious structural argument against the artificial intelligence complex we have encountered. We set it out at length below, and then give the counterarguments the space they deserve, because we do not think it is obviously right.
A DISCLOSURE READERS ARE ENTITLED TO
This brief is researched and drafted with the assistance of an artificial intelligence system built by Anthropic — one of the two companies whose compute obligations sit at the centre of the analysis below. We have presented the author's figures on Anthropic exactly as published, including the finding that its coverage ratio is roughly three times better than its competitor's, and we have not softened anything. But readers should know the connection exists and weigh our treatment accordingly. We would rather disclose it than have it noticed.
Part I — The Structure Being Described
The argument begins in 2006, and the analogy is precise rather than atmospheric.
The 2/28 adjustable-rate mortgage carried a low fixed rate for two years, after which it reset to a payment 30% to 50% higher. During those two years the loan performed beautifully — the borrower paid, the servicer collected, the bond paid its coupon. And every reset date was known, dated and contractually inevitable from the moment of origination. Aggregate them and you get the reset wall: roughly a trillion dollars of adjustable-rate mortgages contractually due to reset across 2007 and 2008. Credit Suisse published the chart in March 2007. The IMF reprinted it. It circulated on every trading floor in New York and London, and it was ignored.
The author's claim is that the take-or-pay compute contract has rebuilt this structure exactly. Its payments do not begin at signing. They begin at delivery — when the data centre is energised, capacity accepted, and the contractual ramp commences. Siting, powering and filling a gigawatt-scale campus takes 24 to 36 months from signature, which mirrors the two-to-three-year teaser of a subprime ARM.
Fig. 1 — The author's modelled recasting schedule. Note these are estimates, not disclosures.
More than $2.3 trillion of compute contracts sit on the books of the four largest American cloud providers as remaining performance obligations and contracted backlog — signed, celebrated, capitalised into equity prices, and not yet billing.
During the teaser period, the author observes, everyone wins. The seller reports backlog growth that compounds at rates no operating business has sustained — Oracle's remaining performance obligations grew 363% in a single fiscal year. The buyer books no expense, because the capacity does not yet exist. The market capitalises the booked number as though it were revenue. Then, on a schedule fixed at signing, booked compute becomes billed compute and the take-or-pay clock starts — regardless of utilisation.
The line that does the most work: "How does OpenAI, a company with some $40 billion of run-rate revenue, sign $1.4 trillion of compute commitments? The same way a household with $60,000 of income signed a $600,000 mortgage: because the terms at signing do not require the payment yet."
Part II — Take-or-Pay Is Debt
Fig. 2 — The author's central claim about where the leverage actually sits.
The standard rebuttal to any 2008 comparison is that the leverage is not there. The author's response is that the leverage is there and is simply not booked as leverage.
The reasoning is orthodox rather than exotic. A take-or-pay contract is in economic substance a lease, and a lease is a financing. The defining feature of debt is a fixed payment on a schedule owed regardless of circumstances — which is exactly what a take-or-pay commitment is. Rating agencies have treated take-or-pay obligations as imputed debt for more than thirty years in pipeline throughput agreements, ship-or-pay contracts and long-term power purchase agreements. The convention simply has not been applied to compute.
Three mechanisms keep the obligations off reported balance sheets, and all three are real. Disclosure asymmetry — remaining performance obligations are a seller-side disclosure with no symmetric requirement for the buyer to report what it has promised. The largest buyers are private, so their obligations enter the public record only when a counterparty announces a deal. And the contracts are generally structured as service agreements rather than leases — which the author notes is precisely the manoeuvre that kept operating leases off balance sheets before the accounting standard changed.
Part III — Who Owes It
Fig. 3 — The same instrument produces very different outcomes depending on the borrower.
Of roughly $2.3 trillion of contracted backlog at the four largest cloud providers, the author traces approximately $1.0 trillion to two counterparties: OpenAI and Anthropic. Both run deeply negative free cash flow and fund themselves through equity raises and vendor-adjacent financing from the same ecosystem whose capacity they are contracting.
His summary sentence: "the largest capital cycle in the history of technology is underwritten, to the tune of roughly one trillion dollars, by two private companies that do not make money."
But the two are not alike, and this is the most important nuance in the piece. Under management's own plan, the author models OpenAI's committed compute at more than 200% of revenue at the 2027 peak — before wages, research, sales or tax. Anthropic's peaks close to 60% and then falls, which he describes as "undoubtedly stressed in the reset window, but structurally solvent and improving from the peak rather than grinding against it." Same instrument, same commencement window, coverage ratios differing by more than a factor of three.
For committed compute merely to equal OpenAI's revenue in 2027 — parity, not comfort — revenue would have to compound at 217% annually off the 2025 base.
Part IV — Why the Present Data Cannot Answer the Question
The most intellectually interesting section is the one about epistemics, and it connects directly to yesterday's brief.
"The hardest thing to convey about 2006 to anyone who did not trade through it is how good the data was." Record origination, record homeownership, delinquencies at decade lows, homebuilder earnings at all-time highs. Every one of those was a teaser-phase measurement — an observation of a system whose payment test had not begun, generated by an instrument that mechanically guaranteed the data would look that way until the schedule said otherwise.
Then the parallel: record backlog celebrated as 2005 celebrated origination volume; capacity sold out and demand insatiable, which is necessarily true while contracted delivery lags contracted demand; vendor revenue beating estimates, which he compares to homebuilder earnings being "the sound of the mortgage machine consuming its own vendor inputs."
His conclusion is the sharpest line in the piece: "A teaser period does not merely hide the reset wall. It manufactures the exact evidence used to dismiss it."
Yesterday we wrote that the composite purchasing managers' index at a 52-month high and a collapsing consumer were both true, and that a capital expenditure boom was large enough to offset a household slowdown in the aggregate statistics. This argument suggests a mechanism by which that capital expenditure boom is itself a teaser-phase measurement. We do not know that it is. But it is the correct thing to worry about.
Part V — The Counterarguments, Which Are Substantial
We find this analysis serious and we are not endorsing it. Six objections deserve weight, and the author concedes several of them himself.
First, the numbers are modelled, not disclosed. The author states plainly that "compute contracts are private, so the wall must be modelled." Every figure in Figures 1 to 3 is his construction from announced deals. That is legitimate analysis — Credit Suisse's 2007 chart was built from securitisation documents that were disclosed, which is a materially stronger evidentiary base. We cannot verify these estimates and neither can the reader.
Second, the author's own caveat is that this is not a default forecast. He writes: "It is not a default forecast. The reset wall did not 'predict' defaults in 2008 either. It only revealed the date on which the question would be asked." That is a considerably more modest claim than the framing invites.
Third, Anthropic's coverage is fine. If the instrument itself were the problem, both borrowers would be in trouble. One is comfortably covered and one is not, which means this is a counterparty-credit question rather than a structural indictment of take-or-pay compute contracts.
Fourth, renegotiation is normal and not necessarily catastrophic. The author identifies it as the most likely path and argues that a single amended anchor lease would re-rate every RPO dollar in the complex. That is a reasonable worry but it is a market-psychology claim rather than an arithmetic one, and take-or-pay contracts are renegotiated routinely in pipelines and shipping without systemic consequence.
Fifth, the early vintages cleared. The author acknowledges this directly: contracts commencing in 2025 and early 2026 met or nearly met the required growth rate. He treats that as the mechanism manufacturing complacency. It is also, straightforwardly, evidence that the revenue can arrive.
Sixth, and most importantly, the bull case is a real case. In his own words: "The bull case wins if — and it is a real if — demand scales into the committed supply before the reset wall lands." Artificial intelligence revenue is compounding at rates that have essentially no precedent, and the argument requires only that this deceleration not happen.
THE ONE FORMULATION WORTH CARRYING REGARDLESS OF WHO IS RIGHT
Strip away the mortgage analogy, the trillions and the polemic, and one sentence survives as genuinely useful analysis: "You do not need demand to fall. You need it only to decelerate below the rate the booked compute was underwritten to." That is the distinction between a fixed obligation and a variable one, and it applies far beyond this sector. A company with variable costs meeting slowing demand simply earns less and adjusts. A company with fixed contractual obligations meeting slowing demand has a solvency problem, because the payment arrives on a date set in a more optimistic year regardless of what happened to the demand curve in between. This is why operating leverage is described as wonderful on the way up and merciless on the way down, and it is why the author notes that roughly 80% of a live data centre's monthly cost is fixed from the day the meter turns on. Whether or not the reset wall materialises as drawn, the correct question to ask of any AI-exposed company from here is simple: how much of its cost base is contractually fixed, and what rate of revenue growth was it underwritten to?
Part VI — Why This Matters for a Passive Investor
The final section is the one with the broadest relevance and it is worth stating even for readers who find the thesis unpersuasive.
The author estimates that AI-exposed names account for roughly 45% of S&P 500 market capitalisation, with the ten largest companies near 40% — against about 27% for the top ten at the dot-com peak. Semiconductors carry roughly 19% of the index and supply roughly 45% of its total earnings growth; hyperscalers are another 20% or so.
His conclusion: "A passive retirement account holding an S&P 500 index fund owns a levered, concentrated bet on the conversion of contracted compute backlog into billed revenue — and on two cash-burning frontier labs' ability to pay for it. Nobody chose that allocation, and almost no one holding knows it."
That paragraph is true regardless of whether the reset wall arrives on schedule, and it is the part of this piece we would most want a reader to sit with. Index concentration at these levels means the passive allocation is no longer diversified in the way its holders believe. That is a statement about the index, not a forecast about artificial intelligence, and it requires no view on take-or-pay contracts at all.
8. ANALYST CALLS DRIVING ACTION
The sell side is positioned for a strong Nvidia print and a raised outlook. The question this brief would ask on the call is narrower than the headline numbers: what proportion of the quarter's revenue came from customers to whom Nvidia has extended financial support, and what is the commencement profile of the backlog being celebrated. Neither is typically volunteered.
9. STOCKS TO WATCH
Nvidia (NVDA) — Tomorrow after the close. Rubin cycle, gross margins, and the vendor-financing question.
Micron (MU) / AMD / Broadcom (AVGO) — Led Monday's decline. The complex has been de-rating into the print.
Oracle (ORCL) — Remaining performance obligations grew 363% in a fiscal year. The purest expression of booked-not-billed.
CoreWeave (CRWV) — The most levered expression of the thesis: gigawatt campuses financed against the take-or-pay contracts themselves.
Microsoft (MSFT) / Amazon (AMZN) — Hyperscalers with the balance sheets to absorb a deferral, which is precisely the distinction that matters here.
CEG / VST / TLN / GEV / PWR — AI-power. Contracted, long-dated, and financed against counterparties whose credit is now the question.
Cameco (CCJ) / BWX Technologies (BWXT) — Longer-dated expression of the power constraint.
Symbotic (SYM) / Serve Robotics (SERV) / Teradyne (TER) / Cognex (CGNX) — Physical AI, with cost bases far less contractually fixed than a gigawatt campus.
Walmart (WMT) / Target (TGT) — The household economy, still contracting.
TLT — Yields easing into Jackson Hole after a brutal fortnight.
Gold (GLD) — Unchanged in its logic: fiscal anxiety and policy uncertainty.
10. GLOBAL MACRO SNAPSHOT
The concentration point travels. Most developed-market pension and retirement systems hold global equity through capitalisation-weighted indices in which US technology is the dominant weight. A re-rating of the American AI complex would therefore be transmitted to households in Europe, Japan and Australia who have never made an allocation decision about compute contracts.
New US sanctions on Iran and the US-Canada trade breakdown remain the live policy risks, with crude having risen more than 10% this month and tariff pass-through likely to reach American consumer prices around the turn of the year.
Jackson Hole convenes Thursday with officials from more than 70 countries, at a moment when the synchronised long-end selloff remains unresolved.
11. WEEK AHEAD PREVIEW
Wed Aug 26: Nvidia after the close, with Salesforce, CrowdStrike, Veeva and Okta.
Aug 27-29: Jackson Hole, themed "Financial Innovation: Implications for Payments and Policy".
Fri Aug 28: Chair Warsh's first Jackson Hole keynote.
Late this week: the PCE deflator.
Sep 15-16: FOMC. Roughly 30% priced, no dot plot, no forward guidance.
12. THE CLOSING THOUGHT
Yesterday this brief argued that the American business economy and the American household economy are doing different things, and that a capital expenditure boom was large enough to offset a consumer slowdown in the aggregate statistics. Today's spotlight, prompted by a reader, offers a mechanism by which that capital expenditure boom might itself be a measurement taken during a teaser period. The argument is that take-or-pay compute contracts begin billing at delivery rather than at signature, that construction takes two to three years, and that a 2025-26 signing boom therefore guarantees a 2027-28 commencement boom — with roughly a trillion dollars of the backlog owed by two private companies that do not yet make money. We think it is serious and we do not think it is obviously right. The figures are modelled rather than disclosed, the author concedes it is not a default forecast, one of the two counterparties is comfortably covered, and the bull case — that demand scales into the committed supply before the wall lands — is explicitly acknowledged as real. What survives regardless is one sentence: you do not need demand to fall, only to decelerate below the rate the obligations were underwritten to. That is the difference between a fixed cost and a variable one, and it is the right question to ask of Nvidia tomorrow evening — not whether the number beats, but how much of the backlog has started billing and who is financing the buyer. Good luck today.
THE BROOKSIDE BRIEF · COMPILED 9:00 AM ET · SECTION 7 SOURCE: GROUNDBREAKER, "THE TEASER PERIOD: WHY THE AI BOOM IS HITTING A RESET WALL," PUBLISHED 20 AUGUST 2026, PROVIDED BY A READER. ALL COMPUTE-OBLIGATION FIGURES IN SECTION 7 AND FIGURES 1 TO 3 ARE THE AUTHOR'S MODELLED ESTIMATES BUILT FROM ANNOUNCED CONTRACTS, NOT AUDITED OR DISCLOSED DATA; THE AUTHOR STATES EXPLICITLY THAT COMPUTE CONTRACTS ARE PRIVATE AND THE WALL MUST BE MODELLED. WE HAVE NOT INDEPENDENTLY VERIFIED THEM AND READERS SHOULD NOT TREAT THEM AS FACT. THE PIECE CARRIES ITS OWN DISCLAIMER THAT IT IS NOT INVESTMENT ADVICE AND THAT THE AUTHOR MAY OR MAY NOT HOLD POSITIONS · MARKET SOURCES: CNBC, WASHINGTON POST, BARCHART AND YAHOO FINANCE (24 AUGUST CLOSE); THESTREET, CNBC AND BENZINGA (TUESDAY FUTURES, NVIDIA PREMARKET AND PREVIEW FOCUS AREAS) · DISCLOSURE: THIS BRIEF IS RESEARCHED AND DRAFTED WITH THE ASSISTANCE OF AN AI SYSTEM BUILT BY ANTHROPIC, ONE OF THE TWO COMPANIES ANALYSED IN SECTION 7 · NOTHING IN THIS BRIEF IS INVESTMENT ADVICE
MORNING EDITION · WEDNESDAY, AUGUST 26, 2026 · NVIDIA TONIGHT · PCE THIS MORNING · JACKSON HOLE TOMORROW · THE VENDOR FINANCES THE BUYER
Daily Markets Briefing
The Brookside Brief
Markets · Macro · The Day Ahead
1. THE MORNING SETUP
Good morning. Yesterday's spotlight set out a reader's argument that the artificial intelligence complex is sitting inside a teaser period, and closed by saying the right question to ask of Nvidia tonight was "not whether the number beats, but how much of the backlog has started billing and who is financing the buyer."
Overnight reporting answered the second half of that question, and the answer is larger than the article contemplated. Reuters reports that Nvidia this month helped arrange $500 billion of financing from six major US financial institutions for customers building AI infrastructure, and separately agreed to guarantee up to $105 billion to help OpenAI lease a data centre in Ohio for twenty years.
That $105 billion guarantee is larger than the entire revenue Nvidia is expected to report for the quarter tonight. Section 7 is devoted to what vendor financing is, why it is not inherently improper, and the one historical precedent every investor in this complex should know.
Markets went into it well. Tuesday the S&P 500 rose 24.42 points, or 0.3%, to 7,677.28, the Dow 160.24 points to 53,577.40 for a third consecutive gain, and the Nasdaq 171.11 points, or 0.7%, to 26,151.30. Falling oil eased the bond market, and Nvidia itself rose 2%, snapping a seven-day losing streak. Canada announced retaliatory tariffs on US goods and the market brushed it aside.
The July PCE deflator was due at 8:30 this morning — the measure the Federal Reserve actually targets. Consensus looked for headline at +0.1% on the month and 3.6% on the year, with core at +0.2% and 3.3%. We compile before the figure was available to us and we are not going to guess at it; readers will have it before this reaches them.
Futures are mixed and cautious: Nasdaq 100 contracts down 0.20%, S&P 500 futures down 0.07%, Dow futures up 0.07%. Nvidia reports after the close. Jackson Hole convenes tomorrow, with Chair Warsh's keynote Friday morning.
2. MARKETS AT A GLANCE
TUESDAY AUGUST 25 CLOSE
Asset
Last
Change
% Chg
S&P 500
7,677.28
+24.42
+0.30%
Dow Jones Industrial Avg.
53,577.40
+160.24
+0.30%
Nasdaq Composite
26,151.30
+171.11
+0.70%
Nvidia (NVDA)
—
—
+2%, streak snapped
TONIGHT'S PRINT — WHAT IS EXPECTED
Measure
Level
Change
Note
Q2 revenue, company guidance
≈$91bn
±2%
—
Q2 revenue, consensus
$92.2bn
Visible Alpha
above the guide
Q2 adjusted EPS, consensus
$2.09
+99.1% y/y
+11.8% q/q
Data centre revenue, consensus
$85.14bn
+107.2% y/y
+13.1% q/q
— of which hyperscaler
≈$43.5bn
—
—
— of which ACIE
≈$41.7bn
—
—
Q3 revenue guidance, expected
$104.20bn
+82.8% y/y
THE NUMBER
Adjusted gross margin, expected
≈75%
Q2 and Q3
—
THE FINANCING DISCLOSURES
Item
Amount
Detail
Note
Consortium arranged
$500bn
six US institutions
for AI customers
OpenAI Ohio lease guarantee
up to $105bn
20-year term
—
For scale: Q2 revenue expected
$92.2bn
—
one quarter
THIS MORNING
Asset
Last
Change
% Chg
Nasdaq 100 futures
—
-0.20%
—
S&P 500 futures
—
-0.07%
—
Dow futures
—
+0.07%
—
July PCE, headline
+0.1% m/m exp
3.6% y/y exp
NOT YET IN HAND
July PCE, core
+0.2% m/m exp
3.3% y/y exp
NOT YET IN HAND
3. TOP STORIES
Nvidia Reports Tonight Into a Seven-Day Slide
Fig. 1 — Consensus sits above the company's own guidance, and the third-quarter guide is the number that matters.
Nvidia reports second-quarter fiscal 2027 results after the close. The company guided to approximately $91 billion plus or minus 2%; consensus sits at $92.2 billion. Earnings are expected at $2.09, up 99.1% year on year. Data centre revenue is expected at $85.14 billion, up 107.2%.
The number that will actually move the stock is the third-quarter guide, expected at $104.20 billion — implying 82.8% growth. Adjusted gross margin is expected near 75% for both quarters, and Morgan Stanley projects initial Rubin shipments of roughly 150,000 units in the third quarter, worth approximately $9 billion.
The setup is unusual. Nvidia has beaten consensus in each of the trailing four quarters, with an average surprise of 5.52% — and the shares have fallen after each of the last four releases. They went into this print on a seven-day losing streak, snapped only by Tuesday's 2% gain.
The Vendor Financing Disclosures Are the Story
Fig. 2 — A single contingent guarantee larger than the quarter's expected revenue.
Reuters reports that Nvidia this month helped arrange $500 billion of financing from six major US financial institutions for customers building AI infrastructure, and agreed to guarantee up to $105 billion to help OpenAI lease a data centre in Ohio for twenty years.
Take the second of those slowly. A guarantee means Nvidia has agreed to pay if OpenAI does not. It is a contingent liability rather than a cash outlay, and it may never be called. But it means that Nvidia's exposure to OpenAI is no longer limited to whether OpenAI buys more chips — it now extends to whether OpenAI can meet a twenty-year lease obligation.
Yesterday's spotlight argued that hyperscaler returns on capital are "fundamentally frontier lab credit risk" dressed as an operating return. This disclosure makes that literal for the largest company in the index. Section 7 sets out how to think about it.
PCE This Morning, Jackson Hole Tomorrow
The July personal consumption expenditures deflator was released at 8:30, and we do not have it. Consensus was headline +0.1% on the month and 3.6% annually, core +0.2% and 3.3% — with core expected to accelerate from +0.1% in June, which had been the first negative headline reading since 2020.
One technical note worth carrying. The Bureau of Economic Analysis is releasing calculation changes in September covering computer hardware, stock portfolio management and legal services, and those changes could revise July's figures. A measure that is revised is a measure to be held loosely — a point we made on 13 August when explaining why the Federal Reserve prefers PCE to CPI in the first place.
Jackson Hole convenes tomorrow. Chair Warsh's first keynote as chairman is Friday morning, at a symposium themed on financial innovation and payments.
4. MACRO & FED WATCH
September remains near 30%. This morning's PCE and Friday's keynote are the last two inputs before the meeting, and they pull in different directions: PCE is data the Committee will weigh, while the keynote is the one opportunity to reduce the uncertainty premium that has kept long yields elevated through a fortnight of soft inflation prints.
Oil falling for a second session is the quiet improvement. Brent above $93 was the single largest upside risk to an otherwise decent inflation picture, and any sustained retreat removes the strongest remaining argument the three dissenters had.
5. ECONOMIC CALENDAR
Day
Time (ET)
Release / Event
Note
Wed Aug 26
8:30 AM
JULY PCE DEFLATOR
Core +0.2% m/m, 3.3% y/y expected
Wed Aug 26
AH
NVIDIA Q2 FY2027
Q3 guide is the number
Wed Aug 26
AH
Salesforce, CrowdStrike, Veeva, Okta
Enterprise software
Thu Aug 27
—
Jackson Hole convenes
70+ countries
Fri Aug 28
AM
WARSH KEYNOTE
First as chairman
September
—
BEA PCE methodology changes
Could revise July
Sep 9
—
Enlarged Treasury buybacks begin
$4bn maximum
Sep 15-16
2:00 PM
FOMC
≈30% hike priced
6. EARNINGS WATCH
Fig. 3 — Four consecutive beats, four consecutive declines.
Nvidia has beaten in each of the last four quarters and the stock has fallen after each one. That pattern is worth understanding before tonight, because it tells you the print is being judged against something other than consensus.
When a company beats repeatedly and the shares fall repeatedly, the market is no longer trading the reported number. It is trading the trajectory of the guide, the composition of the demand, and — increasingly — the quality of the counterparties. A beat that arrives alongside a decelerating guide, or alongside more vendor financing, can be a worse outcome than a modest miss with clean demand.
Salesforce, CrowdStrike, Veeva and Okta also report. Enterprise software is where a services purchasing managers' index of 56.8 should show up if Monday's reading was real, and it is a useful cross-check on whether the business-side strength described in this week's briefs is broad or narrow.
7. SECTOR SPOTLIGHT: WHEN THE SELLER FINANCES THE BUYER
Yesterday we ended by saying the question for tonight was who is financing the buyer. Reuters has since reported that the answer, in substantial part, is Nvidia. A $500 billion financing consortium arranged for customers, and a guarantee of up to $105 billion on a twenty-year OpenAI data centre lease. The second of those is larger than the revenue Nvidia will report tonight.
This deserves careful treatment rather than alarm, because vendor financing is ordinary, ancient, and usually benign — right up until it is not.
Part I — What Vendor Financing Is, and Why It Exists
Vendor financing is when a seller helps its customer pay for what the seller is selling — by lending directly, by guaranteeing third-party debt, by taking equity in the buyer, or by arranging facilities with banks.
It is completely standard in capital goods. Aircraft manufacturers have financed airlines for decades. Equipment makers finance construction firms. Agricultural machinery companies run captive finance arms that are, in substance, banks. The logic is straightforward: the asset is expensive, the buyer's cash flow arrives only after the asset is operating, and the seller knows the collateral better than any outside lender does.
Done properly it is a genuine competitive advantage. A vendor who can solve the customer's financing problem wins business a competitor cannot reach, and earns a spread on the credit as well as a margin on the equipment. There is nothing improper about any of this and nothing about it is hidden — these disclosures came from the company and its banks.
Part II — What It Does to the Accounts
The problem is not legitimacy. It is that vendor financing changes what a revenue number means, in three specific ways.
First, it makes revenue growth and credit exposure the same number. When a vendor finances a sale, the revenue is recognised immediately while the credit risk runs for the life of the financing. A quarter of spectacular growth is also a quarter of accumulated exposure, and only one of those appears in the headline.
Second, it can make demand look independent when it is not. If a buyer could not have purchased without the seller's help, then the seller has funded its own order book. The demand is real in the sense that the equipment is shipped and used — but it is not independent evidence that the market would have absorbed the product at that price and volume.
Third, it concentrates risk that looks diversified. A supplier selling to many customers appears to have a diversified book. A supplier that has guaranteed one customer's twenty-year lease has a concentrated exposure to that customer's solvency, sitting off to one side of the income statement as a contingent liability.
CONTINGENT LIABILITIES, AND WHY THEY ARE EASY TO MISS
A guarantee is not a debt and does not appear as one. Under US accounting rules a contingent liability is recognised on the balance sheet only when a loss is both probable and reasonably estimable; otherwise it is disclosed in the notes — or, if the probability is considered remote, potentially not disclosed at all. This is entirely proper. A guarantee that is never called costs nothing, and forcing companies to book every contingency as debt would make balance sheets meaningless. But it means the reader who stops at the balance sheet will not find it. The practical guidance is unglamorous and effective: in any company with financing relationships to its customers, read the commitments and contingencies note, and read the related-party note. That is where guarantees, purchase commitments, residual value guarantees and equity stakes in customers are disclosed. It is usually the least-read section of a 10-K and it is where this cycle's most important information will sit. For Nvidia specifically, the question tonight is whether the $105 billion guarantee and the $500 billion facility are characterised as remote, reasonably possible, or probable — because those three words carry very different meanings.
Part III — The Precedent Everyone Should Know
There is one historical case that every investor in this complex should have in mind, and it is not 2008.
In the late 1990s, Lucent Technologies — then one of the largest and most admired equipment makers in the world — provided extensive vendor financing to emerging telecommunications carriers so they could buy Lucent switching equipment. Revenue grew spectacularly. The company beat expectations repeatedly. Competitors including Nortel followed, because a vendor who would not finance could not compete for the same customers.
The customers were start-ups building networks against forecast demand. When that demand arrived more slowly than underwritten, the carriers could not pay. Lucent took the loss twice: it lost the future revenue, and it wrote off the receivables and financing it had already extended. The company that had been the bluest of blue chips was eventually acquired; Nortel went bankrupt.
The mechanism is exactly the one described in yesterday's spotlight, arriving one layer up the stack. The frontier lab's obligation is fixed and the revenue is forecast; the vendor has now guaranteed part of that obligation. If demand decelerates below the underwritten rate, the vendor does not merely lose orders — it inherits the buyer's liability.
Part IV — Why This Is Not Simply Lucent Again
Three differences are material and they cut in Nvidia's favour.
The customers are not start-ups. Lucent financed carriers with no revenue and no assets. OpenAI has roughly $40 billion of run-rate revenue and one of the most valuable private equity bases ever assembled; the hyperscalers taking the bulk of Nvidia's output are among the most profitable companies in history. Consensus expects roughly $43.5 billion of the quarter's data centre revenue from hyperscalers — buyers who need no help paying.
Nvidia's own balance sheet is extraordinary. Lucent financed customers from a position of competitive weakness in a commoditising market. Nvidia is doing it from a position of near-monopoly with gross margins around 75%. It can absorb losses Lucent could not.
And a facility arranged is not a loan extended. The $500 billion is financing arranged with six banks — the banks carry that credit, not Nvidia. Only the $105 billion guarantee represents direct contingent exposure, and even that is contingent rather than funded.
Part V — What to Actually Watch Tonight
Five things, in descending order of importance, and only the first is normally discussed.
1. The third-quarter guide. Expected at $104.20 billion. A beat on the quarter with a guide at or below that number is the bearish combination, because it says the deceleration has begun.
2. The split between hyperscaler and other data centre revenue. Consensus has roughly $43.5 billion hyperscaler against $41.7 billion for the remainder. Hyperscaler dollars are paid by companies with enormous free cash flow. The remainder increasingly is not. A mix shifting toward the less-capitalised buyer is a deterioration in revenue quality even if the total grows.
3. Any expansion of the financing arrangements. If tonight brings a larger guarantee, an additional consortium, or new equity stakes in customers, the credit exposure is growing faster than the revenue.
4. Receivables and days sales outstanding. The same test we applied to Applied Materials on 14 August. If receivables grow materially faster than revenue, customers are taking longer to pay — which is the earliest and least ambiguous signal available.
5. Gross margin. Expected near 75%. It is the least interesting of the five, and it is the one that will lead the coverage.
THE HONEST SUMMARY
None of this is evidence of wrongdoing and none of it is hidden. Nvidia and its banks disclosed these arrangements; Reuters reported them; the company will presumably be asked about them tonight. Vendor financing is a legitimate and often shrewd competitive tool, and the differences from Lucent are real — better counterparties, a far stronger balance sheet, and exposure that is mostly arranged rather than extended. What has changed is narrower: the largest company in the index has taken on contingent exposure to the solvency of a private, cash-burning counterparty over a twenty-year term, and that exposure is larger than a full quarter of its revenue. An investor who owns the index owns a piece of that. The appropriate response is not alarm. It is to read the contingencies note, watch the revenue mix, and treat "who is paying for this" as a permanent question rather than a temporary one.
8. ANALYST CALLS DRIVING ACTION
The street is positioned for a beat and a raise, with price targets extending well above the current level. The more interesting divergence is between analysts modelling the revenue and those modelling the financing — the second group has been considerably more cautious, and their questions on tonight's call will be the ones worth listening for.
9. STOCKS TO WATCH
Nvidia (NVDA) — Tonight. Watch the Q3 guide, the hyperscaler mix, receivables, and any expansion of the financing arrangements.
Oracle (ORCL) / CoreWeave (CRWV) — The purest booked-not-billed exposures, and the most levered to any change in how contracted backlog is valued.
Microsoft (MSFT) / Amazon (AMZN) / Alphabet (GOOGL) — The hyperscaler buyers who need no vendor financing. The quality end of the demand.
Micron (MU) / Broadcom (AVGO) / AMD — Chip complex, still de-rating into the print.
Salesforce (CRM) / CrowdStrike (CRWD) / Okta (OKTA) — Tonight's cross-check on whether services strength is broad.
CEG / VST / TLN / GEV / PWR — AI-power. Long-dated contracted cash flows against counterparties whose credit is now the live question.
Cameco (CCJ) / BWX Technologies (BWXT) — Longer-dated expression of the power constraint.
Symbotic (SYM) / Serve Robotics (SERV) / Teradyne (TER) / Cognex (CGNX) — Physical AI, with far less contractually fixed cost base.
Walmart (WMT) / Target (TGT) — The household economy, still contracting.
TLT — Oil falling for a second session is the quiet help.
Gold (GLD) — Unchanged logic, and Friday is its catalyst.
10. GLOBAL MACRO SNAPSHOT
Canada announced retaliatory tariffs on US goods and the market brushed it aside, which is worth noting rather than celebrating. Tariff pass-through reaches consumer prices with a lag of quarters, so a market that shrugs today is not evidence the measure is harmless — it is evidence the effect is not yet measurable.
Oil extending declines is the most genuinely helpful development of the week for the inflation picture, and it lands with Brent having risen more than 10% earlier this month.
Jackson Hole convenes tomorrow with officials from more than 70 countries, at a moment when the long-end selloff remains synchronised across developed markets and the American Treasury's buyback intervention held for a single session.
11. WEEK AHEAD PREVIEW
Today, after the close: Nvidia, plus Salesforce, CrowdStrike, Veeva and Okta.
Thu Aug 27: Jackson Hole convenes.
Fri Aug 28: Chair Warsh's first Jackson Hole keynote as chairman.
September: BEA methodology changes to PCE, which could revise July's figures.
Sep 9: the enlarged Treasury buyback operations begin.
Sep 15-16: FOMC. Roughly 30% priced, no dot plot, no forward guidance.
12. THE CLOSING THOUGHT
Yesterday this brief closed by saying the right question for tonight was not whether Nvidia's number beats, but how much of the backlog has started billing and who is financing the buyer. Overnight, Reuters supplied a large part of the answer: Nvidia helped arrange $500 billion of financing from six major US banks for customers building AI infrastructure, and agreed to guarantee up to $105 billion on a twenty-year OpenAI data centre lease in Ohio — a contingent exposure larger than the entire revenue it will report this evening. None of that is improper, none of it is hidden, and vendor financing has been ordinary practice in capital goods for a century. What it does is make revenue growth and credit exposure the same number, which is precisely what happened to Lucent in the late 1990s — spectacular growth financed into customers who could not pay when demand arrived slower than underwritten, and a company that lost the revenue and wrote off the receivables. Nvidia is not Lucent: its customers include the most profitable companies in history, its margins are near 75%, and most of the $500 billion sits with the banks rather than on its own books. But the question has changed shape. It is no longer only whether the chips sell. It is whether the people buying them can pay, and what the seller has promised if they cannot. Watch the third-quarter guide, the hyperscaler share of data centre revenue, and the contingencies note. Good luck today.
THE BROOKSIDE BRIEF · COMPILED 9:00 AM ET · SOURCES: CNBC, WASHINGTON POST AND YAHOO FINANCE (25 AUGUST CLOSE); REUTERS VIA INVESTING.COM, RTE, US NEWS AND ZAWYA, 25 AUGUST 2026 (NVIDIA VENDOR FINANCING — $500BN CONSORTIUM WITH SIX US FINANCIAL INSTITUTIONS AND UP TO $105BN OPENAI OHIO LEASE GUARANTEE); ZACKS AND VISIBLE ALPHA VIA MULTIPLE OUTLETS (Q2 FY2027 CONSENSUS, DATA CENTRE AND SEGMENT ESTIMATES, TRAILING BEAT RECORD); TRADINGKEY (Q3 GUIDANCE EXPECTATION, GROSS MARGIN, POST-EARNINGS SHARE PATTERN); MORGAN STANLEY VIA REUTERS (RUBIN SHIPMENT ESTIMATE); TIPRANKS AND THESTREET (WEDNESDAY FUTURES); KUCOIN, MORNINGSTAR AND CONTINUUM ECONOMICS (PCE CONSENSUS AND BEA METHODOLOGY CHANGES) · THE JULY PCE DEFLATOR WAS RELEASED AT 8:30 AM AND WAS NOT AVAILABLE TO US AT COMPILATION; WE HAVE PRINTED THE CONSENSUS AND EXPLICITLY NOT THE ACTUAL · FIG. 2 SHOWS A QUARTERLY REVENUE FLOW, A CONTINGENT GUARANTEE AND AN ARRANGED FACILITY TOGETHER FOR SCALE; THESE ARE NOT LIKE-FOR-LIKE MEASURES · DISCLOSURE: THIS BRIEF IS RESEARCHED AND DRAFTED WITH THE ASSISTANCE OF AN AI SYSTEM BUILT BY ANTHROPIC, A COMPANY OPERATING IN THE SECTOR ANALYSED ABOVE · NOTHING IN THIS BRIEF IS INVESTMENT ADVICE
MORNING EDITION · THURSDAY, AUGUST 27, 2026 · NVIDIA BEATS AND RAISES · PCE HEADLINE 3.7%, CORE 3.3% · WARSH SPEAKS TOMORROW 8:00 AM
Daily Markets Briefing
The Brookside Brief
Markets · Macro · The Day Ahead
1. THE MORNING SETUP
Good morning. Nvidia delivered, and it delivered on precisely the number this brief said would matter.
Second-quarter revenue came in at $96.2 billion against a $92.2 billion consensus — up 18% sequentially and 106% year on year. Data Centre revenue was $89.0 billion, up 117%. And the third-quarter guide, which we identified on Tuesday as the number that would move the stock, came in at $108.0 billion against roughly $104.20 billion expected. Gross margins held at approximately 75%.
Then the genuinely striking disclosure. Chief Financial Officer Colette Kress told investors the company expects revenue growth of 70% for fiscal 2028 — the year running February 2027 to January 2028. A company guiding a full fiscal year ahead is making a statement about order visibility, not about the quarter.
The shares rose roughly 6% in the premarket and were last around 4% higher near $218.77, breaking the pattern of four consecutive post-earnings declines we flagged yesterday.
One line in the release deserves more attention than it will get, and it connects directly to this week's spotlights. GAAP diluted earnings were $2.46 and non-GAAP earnings $2.22 — GAAP came in higher than non-GAAP, which is the reverse of the usual arrangement. The company's reconciliation excludes "gains/losses from equity securities, net." Nvidia holds equity stakes across the artificial intelligence complex, and those stakes appreciated. The vendor-financing loop we described yesterday is now visible in the earnings statement itself. Section 7 scores the print against the five tests we set out.
On the macro: the July PCE deflator we could not obtain yesterday came in with headline at +0.2% on the month and 3.7% annually — a tenth above consensus — while core held at 3.3%, unchanged from June and in line. Analysis of the release attributes the upside substantially to portfolio management fees, which is a satisfying vindication of the point we made on 13 August about PCE components built from producer price data rather than consumer prices.
Wednesday's session was flat and waiting: the S&P 500 closed at 7,675.70, down 1.58 points, with the Dow off 0.2%. Treasury yields are slightly lower this morning. Jackson Hole convenes today, and Chair Warsh delivers his first keynote as chairman tomorrow at 8:00 AM Eastern.
2. MARKETS AT A GLANCE
NVIDIA Q2 FY2027 — RELEASED AFTER THE CLOSE
Measure
Result
Versus
Note
Revenue
$96.2bn
vs $92.2bn exp
BEAT +4.3%
Revenue growth
+106% y/y
+18% q/q
—
Data Centre revenue
$89.0bn
+117% y/y
92% of total
Edge Computing revenue
$7.2bn
+27% y/y
—
GAAP diluted EPS
$2.46
—
ABOVE non-GAAP
Non-GAAP diluted EPS
$2.22
—
—
Gross margin
≈75%
GAAP and non-GAAP
—
Q3 revenue guidance
$108.0bn
vs $104.2bn exp
BEAT +3.7%
Q3 gross margin guidance
≈74%
—
slight compression
FY2028 revenue growth
≈70%
company guidance
A YEAR AHEAD
Returned to shareholders
$26.0bn
in the quarter
—
Buyback authorisation left
$99.0bn
—
—
JULY PCE — RELEASED WEDNESDAY
Measure
Actual
Versus
Note
Headline PCE, m/m
+0.2%
—
—
Headline PCE, y/y
3.7%
vs 3.6% exp
HOT BY A TENTH
Core PCE, y/y
3.3%
in line
unchanged from June
WEDNESDAY AUGUST 26 CLOSE AND THIS MORNING
Asset
Last
Change
% Chg
S&P 500
7,675.70
-1.58
-0.02%
Dow Jones Industrial Avg.
—
—
-0.2%
Nvidia (NVDA), premarket
≈$218.77
+4% to +6%
—
Treasury yields
—
slightly lower
—
Gold, Dec futures
$4,650/oz
-0.1%
—
3. TOP STORIES
Nvidia Beats on the Quarter and the Guide
Fig. 1 — Both numbers cleared, and the guide cleared by nearly four billion dollars.
Revenue of $96.2 billion beat consensus by roughly $4 billion, or 4.3%. Data Centre revenue reached $89.0 billion, up 117% year on year and 18% sequentially. Edge Computing contributed $7.2 billion, up 27%. Gross margins held at approximately 75% on both a GAAP and non-GAAP basis.
The third-quarter outlook of $108.0 billion plus or minus 2% is the number that mattered, and it exceeded the roughly $104.20 billion the street had modelled. Third-quarter gross margins are guided at approximately 74%, a modest step down that will attract some commentary.
Two disclosures in the outlook deserve attention. The company stated it is not assuming any Data Centre compute revenue from China in its guidance — which means the $108 billion contains no contribution from a market that was historically material, and any resumption would be incremental. And Jensen Huang's framing in the release — "Now, compute is revenue" — is a compact statement of the thesis that computing capacity has become the constraint on the customers' own revenue rather than merely an input cost.
The Seventy Percent
Chief Financial Officer Colette Kress told investors the company expects revenue growth of 70% for fiscal 2028, the year beginning February 2027. Companies of this scale do not normally guide a full year ahead, and the willingness to do so is itself the disclosure.
Read against this week's spotlights, that number cuts both ways. On the bullish reading it reflects genuine order visibility — the company can see the backlog converting and is confident enough to say so. On the more cautious reading set out on Tuesday, a supplier's forward visibility is only as good as its customers' ability to pay when the contracts commence, and a great deal of the relevant capacity commences precisely in the 2027-28 window.
GAAP diluted earnings per share were $2.46. Non-GAAP diluted earnings per share were $2.22. That ordering is unusual — companies almost always report adjusted earnings above statutory ones, because the adjustments typically remove costs.
The explanation is in the reconciliation, which excludes "gains/losses from equity securities, net." Nvidia holds equity positions across the artificial intelligence complex, and those positions appreciated during the quarter. The company is, correctly and conservatively, excluding those gains from its adjusted measure — investment appreciation is not operating performance.
But the mechanism is worth naming plainly, because it is the vendor-financing loop we described yesterday appearing in the accounts. Nvidia sells chips to companies in which it holds equity. Those companies' valuations rise as the buildout proceeds. That appreciation flows into Nvidia's GAAP earnings. The revenue and the investment gain are driven by the same underlying phenomenon, which means they will also reverse together. Section 7 works through what that implies.
PCE: Headline Hot, Core In Line
The July PCE deflator rose 0.2% on the month and 3.7% annually, a tenth above consensus. Core PCE held at 3.3% year on year, unchanged from June and matching expectations.
The composition is the interesting part. Analysis of the release attributes the upside substantially to portfolio management fees — a category whose PCE measurement is built from producer price data rather than consumer price data, and which rises mechanically with asset values. On 13 August this brief explained that several PCE components diverging most from CPI are constructed from PPI series, and named portfolio management specifically. A rising stock market therefore raises measured inflation through a channel that has nothing to do with the cost of living, which is a genuine curiosity of the index and an argument for looking at core services excluding that line.
4. MACRO & FED WATCH
Chair Warsh delivers his first Jackson Hole keynote tomorrow at 8:00 AM Eastern, at a symposium themed on financial innovation and payments. It is the most consequential scheduled event remaining before the September meeting.
The data he speaks against is genuinely mixed. Core PCE at 3.3% is unchanged and well above target. Headline at 3.7% ran hot. Against that, the labour market has produced a negative payroll month, the consumer has stopped spending, and core CPI decelerated to 2.5%. September sits near 30%.
As we have argued since last Friday, the cheapest available way to compress long yields is for somebody to explain the reaction function clearly, and this is the venue built for it. Whether Warsh uses it that way — or holds to a theme about payment rails, consistent with a tenure spent systematically reducing communication — is tomorrow's question.
5. ECONOMIC CALENDAR
Day
Time (ET)
Release / Event
Note
Wed Aug 26
8:30 AM
July PCE (released)
Headline 3.7%, core 3.3%
Wed Aug 26
AH
Nvidia Q2 FY2027 (released)
Beat and raised
Thu Aug 27
—
JACKSON HOLE CONVENES
Jackson Lake Lodge
Fri Aug 28
8:00 AM
WARSH KEYNOTE
First as chairman
Coming
8:30 AM
Jobs data
—
Sep 9
—
Enlarged Treasury buybacks begin
$4bn maximum
Sep 15-16
2:00 PM
FOMC
≈30% hike priced
6. EARNINGS WATCH
Fig. 3 — Data Centre is now 92% of the company.
The season closes with Nvidia, and it closes strongly. But the concentration is worth registering: Data Centre revenue of $89.0 billion represents approximately 92% of the company. Nvidia is no longer a diversified semiconductor business with a large artificial intelligence division. It is an artificial intelligence infrastructure company with a small residual business attached.
That concentration is the source of both the growth and the risk, and it means the stock is now a nearly pure expression of a single end-market's capital expenditure. Salesforce, CrowdStrike, Veeva and Okta also reported and provide the enterprise software cross-check on whether Monday's services purchasing managers' index of 56.8 reflected broad strength.
7. SECTOR SPOTLIGHT: SCORING THE PRINT AGAINST THE FIVE TESTS
On Tuesday and Wednesday this brief set out a framework for reading tonight's print, drawn from a reader's article on take-or-pay compute contracts and from the vendor-financing disclosures that followed. We listed five things to watch, in descending order of importance. It is only fair to score them.
Test One — The Third-Quarter Guide. PASSED, CLEARLY.
We wrote that "a beat on the quarter with a guide at or below $104.20 billion is the bearish combination, because it says the deceleration has begun."
The guide came in at $108.0 billion — roughly $3.8 billion, or 3.7%, above that threshold. There is no deceleration visible in the near-term outlook. The company then went further and guided fiscal 2028 revenue growth at approximately 70%. On the single most important test we set, the print was unambiguously good, and intellectual honesty requires saying so plainly.
Test Two — The Revenue Mix. NOT ANSWERED.
We wrote that the split between hyperscaler and other data centre revenue was the second most important disclosure, because "hyperscaler dollars are paid by companies with enormous free cash flow. The remainder increasingly is not."
The release discloses Data Centre revenue of $89.0 billion as a single figure. It does not break out hyperscaler against neocloud, frontier lab or enterprise. That is entirely normal disclosure practice and Nvidia is under no obligation to provide it. But it means the question we regard as most important for assessing revenue quality cannot be answered from the release, and readers should be wary of anyone claiming otherwise. Customer concentration disclosures in the forthcoming 10-Q will say more.
Test Three — Expansion of the Financing Arrangements. ANSWERED SIDEWAYS.
We asked whether the print would bring "a larger guarantee, an additional consortium, or new equity stakes in customers." The release does not announce new arrangements. But it does something arguably more revealing: it shows the existing equity stakes producing gains large enough to push GAAP earnings above non-GAAP.
Fig. 2 — The $0.24 gap is investment appreciation, not operations.
This is the circularity made visible, and it deserves to be stated carefully because it is easy to overstate. Nvidia takes equity positions in artificial intelligence companies. Those companies buy Nvidia chips. As the buildout proceeds, both the chip revenue and the equity valuations rise. Nvidia is excluding the investment gains from its adjusted earnings, which is the correct and conservative treatment and deserves credit.
The analytical point is not about the accounting. It is about correlation. A diversified investor holds assets that move independently. Nvidia holds revenue and investments driven by the same underlying phenomenon — the pace of artificial intelligence infrastructure spending. In an expansion both rise together and reinforce the impression of strength. In a contraction both fall together, and the equity losses will arrive in the same quarters as the revenue disappointment rather than offsetting them.
WHY NON-GAAP ABOVE GAAP IS WORTH A SECOND LOOK — IN BOTH DIRECTIONS
There is a useful general lesson in the direction of this adjustment. The overwhelming majority of companies report non-GAAP earnings above GAAP, because the adjustments remove costs — restructuring charges, stock compensation, acquisition amortisation. Investors are rightly sceptical of that pattern, since a company that excludes an expense every year for a decade is describing a recurring cost of doing business as though it were exceptional. When the adjustment runs the other way — non-GAAP below GAAP — the company is voluntarily reporting a lower number, which almost always deserves credit rather than suspicion. Nvidia is telling investors that a quarter of its earnings beat came from something other than selling chips, and that they should not pay for it. The caution is not that the treatment is wrong. It is that the underlying exposure remains on the balance sheet whether or not it flows through the adjusted income statement, and that a reader who follows only the non-GAAP line will not see it move until it moves badly. The general rule: read both measures, and pay particular attention whenever the gap between them changes sign.
Test Four — Receivables and Days Sales Outstanding. PENDING.
The earnings release does not contain the balance sheet detail necessary to assess whether receivables are growing faster than revenue. That test — which we applied to Applied Materials on 14 August and flagged as its single quality concern — requires the 10-Q. We will return to it when the filing lands.
Test Five — Gross Margin. PASSED, AND AS PREDICTED, LED THE COVERAGE.
Gross margins came in at approximately 75% on both bases, with third-quarter guidance at approximately 74%. We described this as "the least interesting of the five, and the one that will lead the coverage," and both halves proved accurate. A one-point sequential step down in a business at 75% margins is not a story.
What the Print Does and Does Not Settle
It settles the near term decisively. Demand through the third quarter is not decelerating, the company has enough visibility to guide a full year ahead at 70% growth, and margins are holding. Anyone whose thesis required an imminent slowdown in orders has been answered.
It does not settle the question raised on Tuesday, because that question was never about the near term. The argument in the reader's article was that take-or-pay compute contracts signed in 2025 and 2026 begin billing in 2027 and 2028, and that the counterparties owing the largest share do not currently make money. A strong quarter in mid-2026 is precisely what that thesis predicts — the author's phrase was that a teaser period "manufactures the exact evidence used to dismiss it."
We are not endorsing that argument and we said so on Tuesday. The figures in it are modelled rather than disclosed, one of the two counterparties is comfortably covered, and the bull case is real. But an investor should notice that a good print in August 2026 is not evidence against a thesis whose entire claim is about what happens in 2027 and 2028 — and equally, that the company's willingness to guide fiscal 2028 at 70% growth is a substantive counter-argument from the party with the best view of the order book.
The honest position is that the two most informative disclosures point in opposite directions: a fiscal 2028 growth guide of 70%, and an earnings statement in which the adjustment for investment gains runs backwards. The first says demand is visible far into the reset window. The second says the company's fortunes and its customers' valuations are the same trade.
8. ANALYST CALLS DRIVING ACTION
Expect near-universal upgrades to estimates following a beat, a raise and a fiscal 2028 growth guide. The more useful analytical work over the coming week will be on the 10-Q rather than the release — customer concentration disclosures, receivables, and the commitments and contingencies note where the $105 billion OpenAI guarantee should appear with a characterisation of its probability.
9. STOCKS TO WATCH
Nvidia (NVDA) — Beat, raised, and guided fiscal 2028 at 70% growth. The 10-Q is where the remaining questions get answered.
Micron (MU) / Broadcom (AVGO) / AMD — The complex that de-rated into the print should re-rate out of it.
Oracle (ORCL) / CoreWeave (CRWV) — Booked-not-billed exposure, and the most levered to backlog conversion.
Microsoft (MSFT) / Amazon (AMZN) / Alphabet (GOOGL) — The hyperscaler buyers who need no vendor financing.
Salesforce (CRM) / CrowdStrike (CRWD) / Okta (OKTA) — Enterprise software cross-check on the services PMI.
Vistra (VST) / Constellation (CEG) / Talen (TLN) — AI-power. This desk has opened coverage on Vistra separately.
Cameco (CCJ) / BWX Technologies (BWXT) — Longer-dated expression of the power constraint.
Walmart (WMT) / Target (TGT) — The household economy, still contracting.
TLT — Yields easing into Jackson Hole.
Gold (GLD) — December futures at $4,650, pulling back marginally after PCE and ahead of Warsh.
10. GLOBAL MACRO SNAPSHOT
The China disclosure in Nvidia's outlook is the most significant international item. The company stated it is assuming no Data Centre compute revenue from China in its third-quarter guidance. A $108 billion quarter with zero contribution from the second-largest economy on earth is a remarkable statement about both the strength of demand elsewhere and the completeness of the export control regime.
Jackson Hole convenes today with officials from more than seventy countries, at a moment when the long-end selloff remains synchronised across developed markets and no central bank has offered a satisfactory account of it.
Gold at $4,650 on the December contract continues to price fiscal anxiety and policy uncertainty, and it pulled back only marginally on a hot headline PCE — which suggests the bid is structural rather than tactical.
11. WEEK AHEAD PREVIEW
Today: Jackson Hole convenes at Jackson Lake Lodge.
Tomorrow, 8:00 AM: Chair Warsh's first Jackson Hole keynote as chairman.
Coming: jobs data, and Nvidia's 10-Q with customer concentration and contingency disclosures.
Sep 9: the enlarged Treasury buyback operations begin.
Sep 15-16: FOMC. Roughly 30% priced, no dot plot, no forward guidance.
12. THE CLOSING THOUGHT
On Tuesday we said the question for Nvidia's print was not whether the number beats but how much of the backlog has started billing and who is financing the buyer. The company answered the first part emphatically: revenue of $96.2 billion against $92.2 billion expected, Data Centre up 117%, a third-quarter guide of $108.0 billion against $104.20 billion modelled, and a fiscal 2028 revenue growth guide of approximately 70% — a full year ahead, which companies of this size do not normally offer. On the test we ourselves identified as most important, the print passed clearly, and we should say so without qualification. The second part it answered obliquely, and more interestingly. GAAP earnings of $2.46 came in above non-GAAP earnings of $2.22 — an unusual ordering, caused by gains on the equity stakes Nvidia holds in companies across the complex it supplies. The company is excluding those gains from adjusted earnings, which is conservative and correct. But it means the revenue and the investments are the same trade: in an expansion they rise together, and in a contraction they will not offset. A strong quarter in August 2026 does not settle an argument about what happens when contracts commence in 2027 and 2028 — and equally, a company willing to guide a full year into that window is making a substantive counter-argument from the best available vantage point. Warsh speaks tomorrow at eight. Good luck today.
THE BROOKSIDE BRIEF · COMPILED 9:30 AM ET · SOURCES: NVIDIA CORPORATION, "NVIDIA ANNOUNCES FINANCIAL RESULTS FOR SECOND QUARTER FISCAL 2027," 26 AUGUST 2026, READ DIRECTLY FROM THE COMPANY RELEASE (REVENUE, SEGMENTS, EPS, MARGINS, OUTLOOK, CAPITAL RETURNS, CHINA ASSUMPTION, NON-GAAP RECONCILIATION); CNBC (MARKET REACTION, FY2028 GROWTH GUIDANCE ATTRIBUTED TO CFO COLETTE KRESS); BUREAU OF ECONOMIC ANALYSIS VIA YAHOO FINANCE, FOX BUSINESS AND NCHSTATS (JULY PCE — HEADLINE +0.2% M/M AND 3.7% Y/Y, CORE 3.3% Y/Y); EMPLOY AMERICA (PORTFOLIO MANAGEMENT CONTRIBUTION TO THE PCE UPSIDE); YAHOO FINANCE AND MARKETSCHOLARS (26 AUGUST CLOSE); CNBC (TREASURY YIELDS); YAHOO FINANCE (GOLD); REGARDS OF WALLSTREET AND XTB (JACKSON HOLE DATES AND WARSH KEYNOTE TIMING) · THE HYPERSCALER VERSUS OTHER DATA CENTRE REVENUE SPLIT IS NOT DISCLOSED IN THE EARNINGS RELEASE AND IS IDENTIFIED AS UNANSWERED IN SECTION 7 · DISCLOSURE: THIS BRIEF IS RESEARCHED AND DRAFTED WITH THE ASSISTANCE OF AN AI SYSTEM BUILT BY ANTHROPIC, A COMPANY OPERATING IN THE SECTOR ANALYSED ABOVE · NOTHING IN THIS BRIEF IS INVESTMENT ADVICE
MORNING EDITION · FRIDAY, AUGUST 28, 2026 · WARSH SPEAKS AT 10:00 · NVIDIA ADDS $435BN AS THE AVERAGE STOCK FALLS · SEPTEMBER AT 34%
Daily Markets Briefing
The Brookside Brief
Markets · Macro · The Day Ahead
— CORRECTION: THE KEYNOTE IS AT 10:00, NOT 8:00
Yesterday's brief stated that Chair Warsh's Jackson Hole keynote would begin at 8:00 AM Eastern. Reporting this morning places it at 10:00 AM Eastern. We took the earlier time from a preview source last week and did not re-verify it against the programme before printing. Our sources genuinely disagree on this point and we cannot fully reconcile them, so readers should treat 10:00 as the better-supported time and check the Kansas City Fed programme directly if the hour matters to them. The error is small and the correction is cheap; a brief that has spent this month insisting on verified timings should hold itself to the same standard on a schedule.
1. THE MORNING SETUP
Good morning. Two things happened yesterday and only one of them was reported properly.
The reported one: Nvidia rose roughly 8% after Wednesday's beat and its fiscal 2028 guide, adding approximately $435 billion of market value in a single session. Salesforce gained 22%, its best day since August 2020, and Okta soared 28%. The Nasdaq Composite rose 1.57% to 26,541.35, the S&P 500 gained 0.72% to 7,730.99 and the Dow added 105.56 points, or 0.2%, to 53,569.44.
The one that was not: technology was the only S&P 500 sector to advance, and the average stock in the index fell. A market can rise while most of it declines, and yesterday it did. Section 7 is about breadth — what it is, why it matters, and why a cap-weighted index is a genuinely poor description of "the market" on days like this.
Chair Warsh delivers his first Jackson Hole keynote as chairman this morning, and the framing in the mainstream coverage has converged on exactly the point this brief has made since last Friday. He has, in the words of one account, "drawn repeated criticism for refusing to spell out his reaction function" — the circumstances under which the Committee would move rates in either direction — and investors see this address as his clearest opening yet to fill that void. He speaks with headline inflation at 3.4%, the thirty-year Treasury near its highest since 2007, and the market pricing roughly a 34% chance of a September increase.
Futures are quiet and slightly heavy: S&P 500 contracts little changed with the index on course for a weekly advance, Nasdaq 100 futures down 0.32% as Marvell and Rubrik fell more than 7% premarket. PayPal is down 16% after Advent and Stripe abandoned their pursuit of the company. The final August University of Michigan sentiment reading is also due.
2. MARKETS AT A GLANCE
THURSDAY AUGUST 27 CLOSE — THE INDEX ROSE, THE MARKET FELL
Asset
Last
Change
% Chg
Nasdaq Composite
26,541.35
—
+1.57%
S&P 500
7,730.99
—
+0.72%
Dow Jones Industrial Avg.
53,569.44
+105.56
+0.20%
Nvidia (NVDA)
—
≈+$435bn
+8%
Salesforce (CRM)
—
best day since Aug 2020
+22%
Okta (OKTA)
—
—
+28%
The average S&P 500 stock
—
—
LOWER
Advancing S&P 500 sectors
1 of 11
technology only
—
INTO THE KEYNOTE
Item
Level
Detail
Note
Warsh keynote
10:00 AM ET
Jackson Lake Lodge
first as chairman
Sept hike probability
≈34%
from 30%
drifting up
Headline CPI
3.4%
—
—
Core PCE
3.3%
unchanged
—
30-year Treasury
near 2007 highs
—
the live problem
THIS MORNING
Asset
Last
Change
% Chg
S&P 500 futures
—
little changed
weekly advance on course
Nasdaq 100 futures
—
-0.32%
—
Marvell (MRVL)
—
-7%+
premarket
Rubrik (RBRK)
—
-7%+
premarket
PayPal (PYPL)
—
-16%
Advent and Stripe walk away
3. TOP STORIES
Warsh Speaks, and the Question Is the One We Have Been Asking
Fig. 3 — September down from 67% early in the month, drifting back up into the speech.
Chair Warsh delivers his first Jackson Hole keynote this morning at a symposium themed on financial innovation and payments. The coverage has converged on the framing this brief has used since 21 August: that the cheapest available way to compress long yields is for somebody to explain the reaction function clearly.
One account puts it directly — Warsh "has drawn repeated criticism for refusing to spell out his 'reaction function' — meaning the economic circumstances under which the Fed would move rates in either direction," and investors see this address as his clearest opening to fill that void. The pressure is compounded by the Treasury's intervention: Secretary Bessent doubled long-dated buybacks a week ago and the relief lasted a single session, which left the bond market's problem visibly unsolved by fiscal means.
The asymmetry into the speech is worth naming. A clear articulation of how the Committee will respond to a given shock would compress term premium at no fiscal cost. Saying little — consistent with a tenure spent eliminating forward guidance, cutting the statement to roughly 132 words and proposing to reduce meetings from eight to six — risks the opposite, with analysts warning that a lack of clarity could further rattle a bond market already at nineteen-year highs on the long end.
Nvidia Adds $435 Billion and the Average Stock Falls
Fig. 1 — Nvidia up 8%; the typical index constituent down.
Nvidia rose approximately 8% on Wednesday's beat and its guidance for approximately 70% revenue growth in fiscal 2028, adding roughly $435 billion of market value in a single session. Salesforce rose 22% in its best day since August 2020 and Okta gained 28%.
And technology was the only one of eleven S&P 500 sectors to advance, while the average stock in the index declined. The headline index return of +0.72% is arithmetically correct and describes something that did not happen to most companies in it.
Fig. 2 — A single day's market value gain against an entire mid-cap utility.
The scale is difficult to hold in mind, so it is worth anchoring. Nvidia's one-day gain of roughly $435 billion is approximately nine times the entire market capitalisation of Vistra, an S&P 500 utility with a 41 gigawatt generation fleet, four nuclear plants and millions of retail customers, on which this desk opened coverage two days ago. One company's single session added more value than most industries contain.
PayPal Falls 16% as a Deal Collapses
PayPal dropped 16% in the premarket after Advent and Stripe abandoned their pursuit of the company. The magnitude is instructive about how much acquisition premium had been embedded in the price, and it is a reminder that in a market where index returns are driven by a handful of very large names, single-stock outcomes elsewhere can be violent without registering at the index level at all.
4. MACRO & FED WATCH
September sits at roughly 34%, having travelled from 67% early in the month to 30% last week and back up this week. The data supports the lower end: core CPI at 2.5%, producer prices flat for a second month, payrolls negative, retail sales down 0.6% and the consumer visibly retrenching. The data supporting the higher end is narrower but real: core PCE unchanged at 3.3%, headline PCE at 3.7%, and an energy complex that spent most of August rising.
What has not resolved at all is the long end. The thirty-year sits near its highest since 2007 after a fortnight in which soft inflation data, a negative payroll print and an explicit Treasury intervention all failed to bring it down. That is a term premium problem rather than a policy-rate problem, and it is the one thing this morning's speech could actually address.
5. ECONOMIC CALENDAR
Day
Time (ET)
Release / Event
Note
Fri Aug 28
10:00 AM
WARSH KEYNOTE
First as chairman
Fri Aug 28
10:00 AM
UMich sentiment, final August
Watch expectations
Aug 27-29
—
Jackson Hole continues
70+ countries
Sep 9
—
Enlarged Treasury buybacks begin
$4bn maximum
Coming
8:30 AM
August employment report
—
Sep 15-16
2:00 PM
FOMC
≈34% hike priced
6. EARNINGS WATCH
The season is over and it ended emphatically. Nvidia beat on revenue and the guide and offered a fiscal 2028 growth figure; Salesforce rose 22%; Okta rose 28%; CrowdStrike lifted the enterprise software complex. That last group answers a question we raised on Monday: whether the services purchasing managers' index of 56.8 reflected genuine breadth. On this evidence enterprise software demand is real, which strengthens the business-side half of the two-economy picture we described that day.
7. SECTOR SPOTLIGHT: WHEN THE INDEX RISES AND THE MARKET FALLS
The S&P 500 rose 0.72% yesterday. Technology was the only one of its eleven sectors to advance, and the average constituent declined. Both statements are true, and reconciling them is one of the most practically useful things an investor can understand — because it determines whether "the market went up" means anything at all on a given day.
Part I — How the Index Is Actually Built
The S&P 500 is capitalisation-weighted. Each company's influence on the index is proportional to its market value, not to its presence in the list. A company worth $4 trillion moves the index roughly eighty times as much as one worth $50 billion, despite each being one of five hundred constituents.
The arithmetic consequence is that the index return is a weighted average in which a handful of names carry most of the weight. When Nvidia adds $435 billion of market value in a session, that single move can outweigh declines across several hundred smaller companies. The index rises. Most of the market falls. Neither statement is wrong.
The alternative construction makes the point visible. An equal-weighted S&P 500 gives every constituent the same influence — 0.2% each, rebalanced periodically. On a day like yesterday the cap-weighted index rises and the equal-weighted version falls, and the gap between them is the cleanest available measure of how narrow a move was. Both are published daily and both have investable funds tracking them.
THREE WAYS TO MEASURE BREADTH, ALL FREE
Breadth is the share of the market participating in a move, and there are three standard measures worth knowing. The advance-decline line counts how many stocks rose versus fell, ignoring size entirely — a day with a rising index and more decliners than advancers is by definition narrow. The cap-weighted versus equal-weighted spread is the most useful single number: when the S&P 500 outperforms the equal-weight S&P 500 over a period, large companies are driving returns; a persistent gap is the signature of a concentrated market. And the percentage of constituents above their own moving averages shows how many are in individual uptrends rather than being carried. Why it matters practically: narrow rallies have historically been more fragile than broad ones, because the index depends on a small number of names continuing to perform, and there is no rotation available if they stop. A broad advance can lose its leaders and keep going. A narrow one cannot. The caution is that narrowness is a poor timing signal — markets can remain narrow for years, and an investor who sold every narrow rally over the past decade would have missed most of the return. It is a measure of fragility, not a forecast of when.
Part II — Why This Matters More Than Usual Right Now
Narrowness is a permanent feature of markets, but its current degree is not normal, and this brief has now made the point from three directions in a fortnight.
On Monday we noted a reader's estimate that artificial-intelligence-exposed names account for roughly 45% of S&P 500 market capitalisation, with the ten largest companies near 40% against about 27% for the top ten at the dot-com peak. On Wednesday we set out that Nvidia's Data Centre segment alone is roughly 92% of its own revenue. Yesterday one company added $435 billion in a session while the average constituent fell.
The practical implication for anyone holding an index fund is that the diversification is smaller than the number of constituents suggests. Five hundred names, but a return substantially determined by ten of them, which are themselves exposed to a common underlying variable — the pace of artificial intelligence infrastructure spending. That is a concentrated position regardless of how many tickers appear on the holdings page, and nobody chose it.
Part III — What Narrowness Does and Does Not Tell You
What it tells you: that the index return is not representative of the typical company, that the market's performance depends on a small number of outcomes, and that a passive holder is more exposed to those outcomes than they probably realise.
What it does not tell you: when it ends, or that it is wrong. The leaders may be leading for excellent reasons. Nvidia grew revenue 106% year on year; Salesforce and Okta rose 22% and 28% on their own results. A market concentrating into companies that are genuinely growing faster than everything else is not a mispricing — it is the market doing its job. The concentration becomes a problem only if the growth stops, and yesterday provided no evidence for that.
The honest formulation is that narrowness raises the stakes rather than predicting the outcome. It means the market has less margin for error, because there is nothing else to carry it if the leaders stumble. That is a statement about fragility, and fragility is not the same as imminence.
HOW TO CHECK THIS YOURSELF IN UNDER A MINUTE
This is one of the rare analytical questions with a genuinely free and immediate answer. Compare the S&P 500 against the equal-weighted S&P 500 over your chosen period — both are published continuously and both have widely available tracking funds, so any charting service will overlay them. If the cap-weighted line is well above the equal-weighted one, the market is narrow and you know precisely how narrow. Extend the comparison over one, three and five years and you get the shape of the concentration rather than a single day's snapshot. A second check takes another few seconds: look at the index's top ten holdings and their combined weight, which every fund provider publishes. If that number is near 40%, you are holding a ten-stock portfolio with a long tail attached, and you should decide whether that is what you intended rather than discovering it later. Neither check requires a subscription, a model or a view on artificial intelligence.
8. ANALYST CALLS DRIVING ACTION
Nvidia estimate revisions are flowing through and are uniformly upward. The more consequential positioning question is this morning's speech, where the risk is asymmetric in an unusual way: a clear statement of the reaction function would help both bonds and equities, while saying little leaves the long end where it is and disappoints an audience that has arrived expecting something.
9. STOCKS TO WATCH
Nvidia (NVDA) — Added roughly $435bn on Thursday. The 10-Q, when it lands, carries the customer concentration and contingency disclosures.
Salesforce (CRM) / Okta (OKTA) / CrowdStrike (CRWD) — Enterprise software confirming the services strength we questioned on Monday.
PayPal (PYPL) — Down 16% as Advent and Stripe walk away.
Marvell (MRVL) / Rubrik (RBRK) — Both off more than 7% premarket.
Equal-weight S&P 500 vehicles — The cleanest expression of the breadth question raised in Section 7.
Vistra (VST) / Constellation (CEG) / Talen (TLN) — AI-power. This desk opened coverage on Vistra on Wednesday.
Cameco (CCJ) / BWX Technologies (BWXT) — Longer-dated expression of the power constraint.
Walmart (WMT) / Target (TGT) — The household economy, still contracting.
TLT — The thirty-year near 2007 highs is this morning's real test.
Gold (GLD) — Its best two arguments, fiscal anxiety and policy uncertainty, both get adjudicated at ten o'clock.
10. GLOBAL MACRO SNAPSHOT
The concentration described in Section 7 is not an American peculiarity in its consequences. Global equity indices are capitalisation-weighted and dominated by the same American technology names, which means pension and retirement systems across Europe, Japan and Australia hold the same concentrated exposure through vehicles marketed as diversified global funds.
Jackson Hole continues through tomorrow with officials from more than seventy countries in attendance. The synchronised long-end selloff across developed markets remains the shared problem, and it is not on the official programme, which is themed on financial innovation and payments.
11. WEEK AHEAD PREVIEW
Today, 10:00 AM: Chair Warsh's first Jackson Hole keynote, and the final August University of Michigan sentiment reading.
Through tomorrow: Jackson Hole continues.
Sep 9: the enlarged Treasury buyback operations begin.
Coming: the August employment report.
Sep 15-16: FOMC. Roughly 34% priced, no dot plot, no forward guidance.
12. THE CLOSING THOUGHT
Yesterday the S&P 500 rose 0.72% and most of the companies in it fell. Nvidia added roughly $435 billion of market value in a single session — approximately nine times the entire market capitalisation of Vistra, a utility with four nuclear plants and millions of customers that this desk began covering on Wednesday — while technology was the only one of eleven sectors to advance. That is not a contradiction; it is what a capitalisation-weighted index does when one company is large enough to outweigh several hundred others. It is also a measure of how much a passive holder's outcome now depends on a very small number of names exposed to a single common variable. Narrowness does not tell you when a market turns and it is a poor timing signal — the leaders may be leading for entirely good reasons, and Nvidia growing revenue 106% is a good reason. What it tells you is that there is less to catch the market if they stop, which is a statement about fragility rather than about timing. At ten o'clock Chair Warsh has the opportunity to address the other fragility — a thirty-year Treasury near its highest since 2007 that has ignored soft inflation, a negative payroll print and a direct Treasury intervention. The cheapest fix available to anyone this morning is an explanation of the reaction function, and he is the only person who can give it. Have a good weekend.
THE BROOKSIDE BRIEF · COMPILED 9:30 AM ET, BEFORE THE KEYNOTE · CORRECTION TO YESTERDAY'S STATED KEYNOTE TIME APPEARS AT THE HEAD OF THIS BRIEF · SOURCES: CNBC, YAHOO FINANCE AND THESTREET (27 AUGUST CLOSE, SECTOR BREADTH, NVIDIA, SALESFORCE, OKTA); EASTERN HERALD (NVIDIA MARKET VALUE GAIN AND THE AVERAGE STOCK); CNN BUSINESS (WARSH REACTION-FUNCTION CRITICISM, INFLATION AT 3.4%, 30-YEAR NEAR 2007 HIGHS, SEPTEMBER AT ROUGHLY 34%, KEYNOTE AT 10:00 AM EDT); CNBC (BESSENT INTERVENTION AND PRESSURE ON WARSH); BLOOMBERG AND TS2 (FRIDAY FUTURES, MARVELL, RUBRIK, PAYPAL); STOCKANALYSIS (VISTRA MARKET CAPITALISATION, USED FOR SCALE) · SOURCES DISAGREE ON THE KEYNOTE START TIME; 10:00 AM EDT IS THE BETTER-SUPPORTED FIGURE AND READERS SHOULD CHECK THE KANSAS CITY FED PROGRAMME DIRECTLY · THE AVERAGE-STOCK DECLINE IS AS CHARACTERISED IN CONTEMPORANEOUS REPORTING AND IS NOT A PUBLISHED EQUAL-WEIGHT INDEX RETURN · DISCLOSURE: THIS BRIEF IS RESEARCHED AND DRAFTED WITH THE ASSISTANCE OF AN AI SYSTEM BUILT BY ANTHROPIC, A COMPANY OPERATING IN THE SECTOR DISCUSSED ABOVE · NOTHING IN THIS BRIEF IS INVESTMENT ADVICE
MORNING EDITION · MONDAY, AUGUST 31, 2026 · US STRIKES IRAN, BRENT TOPS $91 · SEPTEMBER HIKE ODDS 60% · LAST DAY OF AUGUST · TIM COOK'S LAST DAY AT APPLE
Daily Markets Briefing
The Brookside Brief
Markets · Macro · The Day Ahead
1. THE MORNING SETUP
Two things happened since Friday's brief and they pull in opposite directions. On Sunday, US Central Command acknowledged that American forces struck a pair of Iranian rocket launchers on Larak Island, near the Strait of Hormuz, which Washington says were preparing to mine the waterway. It was the first publicly acknowledged US attack on Iranian positions since late July, ending roughly a month's pause. Iranian state media reported that Tehran retaliated against US bases in Jordan; reporting indicates eight missiles were intercepted. Brent topped $91 and WTI is above $86, up around 3.7% as we write. That is inflationary at the exact moment the Federal Reserve has told you inflation is its predominant concern.
And on Friday, Chair Warsh gave the market the thing this desk said on Friday morning was the cheapest fix available to anyone: an explanation of his reaction function. He did not give a rate path — he was explicit that he would not — but he gave a standard, and a number. Within thirty minutes the September meeting repriced from roughly a one-in-three chance of a hike to better than one in two. It stands at about 60% this morning.
WHAT WE SAID ON FRIDAY, AND HOW IT SCORED
We wrote at 9:30 on Friday that "the cheapest fix available to anyone this morning is an explanation of the reaction function, and he is the only person who can give it." He gave it. Alan Blinder, a former vice chairman of the Fed, told Yahoo Finance that Warsh's remarks amounted to forward guidance whatever the Chair chooses to call them: "That sounded to me like somebody who thought interest rates should go up, right?" We count that as a passed test. We also note what we did not anticipate: that the answer would be hawkish enough to put a September hike at better than even money.
Fig. 1 — The September repricing, before and after the keynote.
2. MARKETS AT A GLANCE
FRIDAY'S CLOSE, 28 AUGUST
Asset
Last
Change
% Chg
S&P 500
7,711.76
−19.3
−0.25%
Nasdaq Composite
26,402.42
−138.0
−0.52%
Dow Jones Industrial
53,559.99
−10.7
−0.02%
10-year Treasury
4.72%
+4 bp
post-speech
30-year Treasury
5.21%
+2 bp
post-speech
2-year Treasury
~4.30%
+6 to +11 bp
sources differ
All three indexes still finished the week higher, each by less than 1%, on the back of Wednesday's Nvidia-led rally. Point changes above are derived from the reported percentage moves and closing levels and are shown for scale.
THIS MORNING, 31 AUGUST, ROUGHLY 7:50 AM ET
Asset
Last
Change
% Chg
S&P 500 futures
7,706.00
−16.00
−0.21%
Nasdaq 100 futures
29,447.50
−44.25
−0.15%
Dow futures
53,479
−105
−0.20%
Russell 2000 futures
2,974.20
−3.30
−0.11%
VIX
15.25
+0.82
+5.68%
WTI crude, Oct
$86.49
+$3.09
+3.71%
Brent crude
~$91.24
—
+3.6%
Gold
$4,507.30
−$22.60
−0.50%
Bitcoin
$78,305.80
+$142.39
+0.18%
Note the shape of it. Equities are down a fifth of a percent, volatility is up nearly 6%, and crude is up nearly 4%. That is a market pricing a supply shock at the margin, not a risk-off panic.
3. TOP STORIES
The Strait, Again
The strike on Larak Island is small in tonnage and large in meaning. Larak sits inside the Strait of Hormuz, through which a very large share of seaborne crude moves, and the stated purpose of the American action was to stop an attempted mining of the channel. Mining is the cheapest way for a weaker naval power to close a waterway, and it is disproportionately effective: you do not need to sink ships, you need only to make insurers believe you might.
Readers of this brief will recall the framework we set out earlier this month. The price of oil in a conflict is composed of a physical component — barrels actually removed from the market — and a risk component, which is the market paying in advance for barrels that might be removed. Nothing has yet been removed. Today's three-and-a-half percent is almost entirely risk premium. That premium is highly reversible: it evaporated over the past month as hostilities paused, and it has come back in a single session. The thing to watch is not the headline price but whether tanker traffic and war-risk insurance rates change, because those tell you whether the physical component is engaging.
Warsh Gave a Standard, Not a Path
The keynote itself is worth reading directly rather than through the wires, and we did. Warsh described himself as "impressed by the overall performance of the economy, which appears to have strengthened," called labour markets "quite stable" with a jobless rate of 4.1% and four-week average claims "near their lowest level in decades," and then turned on prices: "Inflation is running above our 2 percent target. So the Fed's predominant focus right now should be on prices."
The operative sentence is the one that closes the analytical section. "Here is my standard: We must be confident that underlying inflation is moving to our objective, clearly and at sufficient speed. Otherwise, we have work to do." And in the conclusion, the formulation that explains the whole speech: "I stand here today committed to a discipline, not to a decision."
Deutsche Bank told clients the address "surprised us in its specificity about the economy and outlook and with its lean in a decidedly hawkish direction." Barclays' Jonathan Millar, cited by CNBC, now has a quarter-point September hike as the most probable outcome, with a second increase penciled in for December. We would flag the December call as the more aggressive half of that pair and note it is one house's baseline, not a market price.
The Data Nobody Read
Buried under the keynote on Friday morning: the MNI Chicago Business Barometer collapsed 10.5 points to 47.1 in August, against expectations near 57.9 — the weakest reading of the year and firmly in contraction. A regional survey is a regional survey and this one is noisy, but a double-digit single-month drop is not nothing, and it landed on the same morning the Fed Chair said the economy "appears to have strengthened."
The final University of Michigan reading for August was revised up to 51.7 from a preliminary 51.0, but still fell roughly 6% from July and sits about 11% below a year ago. Year-ahead inflation expectations eased to 4.0%. Long-run expectations held at 3.3% for a third consecutive month — above the 2.8% to 3.2% range that prevailed through 2024. Sources differ on the August preliminary reading for the one-year measure, variously 4.2% and 4.3%; we print the final and flag the discrepancy rather than resolve it.
Tim Cook's Last Day
Today is Tim Cook's final day as chief executive of Apple, a role he has held since 2011. John Ternus, the hardware chief named as successor in April, takes over tomorrow; Cook becomes executive chairman. Yahoo Finance's framing is that investors are roughly $4 trillion richer for his tenure, with Apple's market value having grown from about $350 billion when he took the job. We note that other outlets put the current figure at $5 trillion; we print the lower, better-sourced number and flag the disagreement. Ternus inherits a company whose critics say has no answer to the question of what follows the iPhone, and his first public test is Apple's autumn hardware event.
Fig. 2 — Friday's move in Treasuries: the front end absorbed it.
4. MACRO & FED WATCH
The most interesting thing about Friday was not that the front end sold off. It was that the long end did not. The two-year rose somewhere between six and eleven basis points depending on which wire you read. The ten-year rose four, to 4.72%. The thirty-year rose two, to 5.21%. That is a bear flattener — short yields rising faster than long — and it is precisely the shape you would expect if the market believes a hawkish central bank will succeed.
WHY THE SHAPE MATTERS MORE THAN THE LEVEL
A long bond yield can be decomposed, roughly, into expected average short rates over thirty years plus a term premium — compensation for the risk of holding duration. When a central bank turns hawkish and the long end rises with the front end, the market is telling you it doubts the tightening will work, or that it fears something else entirely, such as fiscal supply. When the front end rises and the long end stays put, the market is telling you it thinks the tightening will contain inflation and therefore long-run expected short rates need not rise. On Friday the curve gave Warsh the second answer. For a thirty-year that this desk noted last week had been sitting near its highest since 2007 while ignoring soft inflation prints, a negative payroll month and a direct Treasury intervention, two basis points on a hawkish keynote is a small vote of confidence.
The unresolved tension is fiscal. On 19 August the Treasury announced it would at least double its long-dated buyback operations, from $2 billion to $4 billion per operation, running from 9 September to 4 November — an operation Secretary Bessent described as a "Treasury Twist." Reporting since has indicated the Treasury General Account, near $1 trillion, could fund it. So the Treasury is working to pull the long end down at the same moment the Fed may be about to push the front end up. CNBC's analyst roundup this morning frames Warsh's insistence on the 2% target as, in part, an assertion of independence — a signal that policy "will not bend to fiscal pressures." Whether that is a coordinated twist or an institutional collision is the question of the autumn, and we do not yet know the answer.
5. ECONOMIC CALENDAR
THIS WEEK — THE RUN INTO PAYROLLS
Date
Time ET
Release
Note
Mon 31 Aug
—
No noteworthy US releases
Month-end; London closed
Tue 1 Sep
9:45 AM
S&P Global US mfg PMI, final
August
Tue 1 Sep
10:00 AM
ISM MANUFACTURING PMI
After Chicago at 47.1
Tue 1 Sep
10:00 AM
JOLTS job openings
July
Wed 2 Sep
8:15 AM
ADP employment change
August
Thu 3 Sep
8:30 AM
Trade balance
July
Thu 3 Sep
10:00 AM
ISM services PMI
54.1 prior
Fri 4 Sep
8:30 AM
EMPLOYMENT SITUATION
Consensus +50,000
Friday is the whole week. Economists surveyed by The Wall Street Journal expect August payrolls of roughly +50,000, after employers shed 23,000 jobs in July. And Warsh has pre-emptively told you how he intends to read a soft number: "When labour supply is barely growing, monthly job gains are naturally going to run low." That single sentence removes a great deal of the dovish optionality a weak print would ordinarily carry. A reader who wants to know what would actually move the September meeting should watch the unemployment rate and average hourly earnings more closely than the headline job count.
15-16 September: FOMC. Roughly 60% of a quarter-point hike priced. No dot plot. No forward guidance.
6. EARNINGS WATCH
A quiet week by design — the second-quarter season is effectively finished and the calendar is thin ahead of the holiday. The residue of last week still matters: Marvell fell about 7% on its second-quarter figures, and PayPal lost more than 12% after Bloomberg reported that Stripe and Advent had abandoned a takeover approach. The reported bid was $60.50 a share, valuing PayPal near $53 billion, which the company rejected as too low. PayPal now trades down about 7% year to date against a 12% gain for the S&P 500 — a reminder that rejecting a premium is a decision with a scoreboard attached, and the scoreboard has started running.
7. THE PRIMER: WHAT 'UNDERLYING INFLATION' ACTUALLY MEANS
Warsh did something on Friday that Fed chairs rarely do: he told you the specific statistic he uses to decide. Not an indicator he finds interesting — the number against which he judges whether the Fed has "work to do." It is worth understanding properly, because you will now see it quoted constantly and quoted badly.
First, three different things people call inflation
A level is where prices are. A rate is how fast they are changing — "CPI rose 0.2% in July" or "PCE is up 3.7% over twelve months." Almost all public discussion stops here. A breadth measure is different in kind: it asks not how fast the average price is rising, but how many things are rising quickly.
The distinction matters because a rate is a weighted average, and weighted averages can be dominated by a small number of large components. Shelter is roughly a sixth of the PCE basket. If shelter decelerates and everything else accelerates, the headline can fall while inflation is in fact spreading. The reverse is equally possible: one large volatile component — energy, or used cars in 2021 — can drag the average up while the great majority of prices behave.
Second, what Warsh actually did
He took the PCE price index apart. "To try to gauge underlying inflation, I find it instructive to disaggregate the 199 individual components of the PCE price measure," he said, and then counted how many of those 199 components had risen faster than 3% over the past twelve months. The answer was 54%. Over the past six months, annualised, 49%. He gave two reference points: about 77% at the post-pandemic peak, and 32% on average across the two decades before the pandemic.
So: better than the worst of it, and still nowhere near normal. Roughly half the American consumption basket is rising at a pace that, if it were the whole basket, would put inflation well above target. That is what he means by underlying trends that have not "meaningfully improved," and it is why he could simultaneously acknowledge that the summer's inflation prints were better than expected and refuse to treat them as progress.
Fig. 3 — Breadth of price increases, as the Chairman presented it.
Third, the two things wrong with it
A count is not a weighting. This measure treats a component worth 0.1% of the basket exactly the same as one worth 15%. Two hundred small services categories running at 3.5% will make the diffusion index look alarming while barely moving the index anybody actually experiences. Conversely, the measure can look benign while a single enormous category — shelter, healthcare — runs hot. A diffusion index tells you about the character of inflation. It does not tell you its magnitude, and it can diverge from the headline for long stretches without either being wrong.
And the benchmark is doing a lot of work. The 32% pre-pandemic norm was measured over a period when inflation ran persistently below the Fed's target. If services prices structurally trend above 3% in an economy with a 2% target and a large services share — which is arithmetically possible, because the target is an average and goods prices historically fell — then 32% may not be the right resting state at all. Treating a pre-pandemic average as the definition of normal is an assumption, not a finding, and Warsh did not defend it.
Why this is nonetheless a real improvement in transparency
For all that, a chairman who names his metric has given the public something valuable. Forward guidance in the Bernanke-to-Powell tradition told you what the committee intended to do. Warsh is refusing to do that — "committed to a discipline, not to a decision" — and offering instead what the committee will be looking at. Those are different products. The first is more comforting and, as the past four years demonstrated, more easily falsified by events. The second asks more of you and ages better.
WHAT TO DO WITH THIS
Nothing, in the sense of a trade. But when the next PCE report lands on 25 September, you now know that the Chairman will not be reading the headline first. The Cleveland Fed publishes trimmed-mean PCE and the Dallas Fed publishes a similar series; the San Francisco Fed splits PCE into cyclical and acyclical components. None is identical to Warsh's count, but all measure the same underlying question — is this broad, or is this a few things? — and all are free. If you have been reading only the headline number, you have been reading the least informative one.
8. ANALYST CALLS DRIVING ACTION
Deutsche Bank on the keynote: it "surprised us in its specificity about the economy and outlook and with its lean in a decidedly hawkish direction." Barclays (Jonathan Millar, via CNBC): a quarter-point hike in September is now the most probable outcome, with a second increase in December as the house baseline. Tiger Brokers (James Ooi): Warsh's robust read on the economy "was seen as reducing the case for near-term rate cuts."
A note on a call we will not repeat. We found two mutually contradictory reports of a recent Morgan Stanley price-target change on Constellation Energy — one saying the target was raised to $366 from $364, another saying it was cut to $364 from $366. Both cannot be right. We are not printing either until we can see the note.
9. STOCKS TO WATCH
ENERGY — THE DIRECT BENEFICIARIES THIS MORNING
Chevron and Halliburton were both higher in Friday's session and again pre-market, on two separate stories that happen to point the same way. The first is crude. The second is Venezuela: The Wall Street Journal reported Friday that Chevron, Halliburton and others are nearing agreements to expand operations there, with Energy Secretary Chris Wright expected to travel to Caracas this week. Chevron is reportedly planning two new fields. Exxon and ConocoPhillips are said not to be pursuing Venezuelan investment — a divergence in risk appetite among the majors that is worth watching in its own right.
PHYSICAL AI
Symbotic (SYM) remains the laggard of the group, down roughly a third year to date against a backlog reported at about $22.5 billion — the widest gap between order book and share price in the cohort we track, and the one that most demands an explanation. Teradyne (TER) is the mirror image, up around 89% this year on AI hardware test demand. Serve Robotics (SERV) and Cognex (CGNX) complete the set. The group traded as a bloc earlier this month around the Unitree listing, which is a caution rather than a compliment: names that move together on someone else's IPO are being traded as a theme, not as businesses.
AI-ENERGY
The picks-and-shovels complex has had a difficult year despite an unimpeachable demand story, and the gap is now large enough to be the story. Constellation (CEG) is down roughly a fifth year to date; Vistra (VST) sits about 37% below its 52-week high; Talen (TLN) is off about 21%. GE Vernova (GEV) is the exception, up over 40% this year on a backlog reported at $176 billion. This desk completed the first stage of an initiation on Constellation over the weekend and the central question it raised is a cash question, not a demand question: Constellation's operating cash flow in the first half of 2026 was $1.55 billion, marginally below the $1.58 billion of the first half of 2025, while net income attributable to common shareholders rose from $957 million to $2.10 billion and total assets went from $57.2 billion to $98.3 billion. Earnings doubled; cash did not move. Note that the divergence has an obvious candidate explanation in acquisition accounting and timing, and we have not yet done the work to confirm it. We raise it as the question, not the answer.
10. GLOBAL MACRO SNAPSHOT
Index
Market
Move
Note
Nikkei 225
Tokyo
−0.14%
—
Kospi
Seoul
+0.46%
—
CSI 300
Mainland China
+0.35%
—
S&P/ASX 200
Sydney
−0.18%
—
Stoxx 600
Europe
~flat
London closed
London is shut for the summer bank holiday, which thins European liquidity and is worth remembering if gilts or sterling do something odd today. Asia's reaction to both the Iran strike and the Warsh keynote was notably muted — a mixed board, nothing beyond half a percent in either direction. Gold fell and Asian equities eased on the hawkish read, which is the textbook response: a higher expected policy rate raises the opportunity cost of holding a metal that pays no coupon.
11. WEEK AHEAD PREVIEW
Today: month-end. No US data. Watch whether the oil bid holds into the close and whether month-end rebalancing distorts the tape.
Tuesday: ISM manufacturing, after Chicago printed 47.1. If ISM confirms contraction, the stagflationary read gets much harder to dismiss.
Wednesday and Thursday: ADP, trade, ISM services. The services number is the one that matters for the inflation story.
Friday: August payrolls, 8:30 AM. Consensus +50,000 after −23,000 in July.
9 September: the enlarged Treasury buyback operations begin.
15-16 September: FOMC. About 60% of a hike priced.
WHAT WE ARE WATCHING, STATED IN ADVANCE
One. Does the September hike probability hold above 50% through the week, or does soft data unwind it? A weak ISM on Tuesday is the first test.
Two. Does the thirty-year stay put? If the long end starts rising with the front end, the vote of confidence we described in Section 4 is withdrawn, and that would be the single most important development of the week.
Three. Does the oil move persist past 48 hours, or does it fade as the last one did? Risk premium that survives two sessions is usually pricing something the physical market has noticed.
12. THE CLOSING THOUGHT
August ends today, and it ends well: the Dow up about 2.1% for a fifth consecutive monthly gain, the S&P 500 up roughly 3% and the Nasdaq roughly 4%, the first monthly gains for either since May. Technology led, up nearly 6%, with Nvidia adding more than 8% and Micron 13%. Gold had its best month since 1999. Bitcoin gained more than 20%. On almost any scoreboard you choose, this was a good month. And yet the month closes with a Fed chairman telling you that half the consumption basket is still rising faster than 3%, a regional manufacturing gauge that just fell ten and a half points into contraction, an employment report due Friday that follows a month in which the economy shed jobs, and American aircraft striking targets inside the Strait of Hormuz. Those facts are not in tension with the returns; they are the reason the returns were available. Someone was being paid to hold assets in that environment. The question the market answers this week is whether it was being paid enough. Have a good Monday.
THE BROOKSIDE BRIEF · COMPILED 9:30 AM ET, MONDAY 31 AUGUST 2026, BEFORE THE OPEN · SOURCES: FEDERAL RESERVE BOARD (WARSH KEYNOTE, 28 AUGUST 2026, READ IN FULL — ALL WARSH QUOTATIONS AND THE PCE DIFFUSION FIGURES ARE FROM THE PRIMARY TEXT); YAHOO FINANCE (28 AUGUST CLOSE, TREASURY MOVES, LIVE FUTURES AND COMMODITY QUOTES, PAYPAL, MARVELL, BLINDER INTERVIEW, TIM COOK); QUARTZ VIA YAHOO FINANCE (LARAK ISLAND STRIKE, OIL PRICES, AUGUST MONTH-TO-DATE PERFORMANCE, BARCLAYS, WSJ PAYROLLS CONSENSUS, ASIA AND EUROPE); CNBC (CENTCOM CONFIRMATION, ANALYST ROUNDUP AND 60.4% SEPTEMBER PROBABILITY, TREASURY BUYBACK COVERAGE); MNI/CHICAGO BUSINESS BAROMETER AND UNIVERSITY OF MICHIGAN VIA TRADING ECONOMICS AND SEEKING ALPHA (FRIDAY DATA); FINANCIALJUICE (WEEK-AHEAD CALENDAR) · REPORTED FRIDAY MOVES IN THE TWO-YEAR YIELD RANGE FROM +6 BP TO +11 BP ACROSS SOURCES; WE PRINT THE RANGE RATHER THAN CHOOSE · SOURCES DIFFER ON APPLE'S CURRENT MARKET VALUE ($4TN VS $5TN) AND ON THE AUGUST PRELIMINARY UMICH ONE-YEAR INFLATION READING; BOTH DISAGREEMENTS ARE FLAGGED IN THE TEXT · THE CONSTELLATION FIGURES IN SECTION 9 ARE FROM THE COMPANY'S OWN Q2 2026 DISCLOSURE AND FORM 10-Q · DISCLOSURE: THIS BRIEF IS RESEARCHED AND DRAFTED WITH THE ASSISTANCE OF AN AI SYSTEM BUILT BY ANTHROPIC, A COMPANY OPERATING IN THE SECTOR DISCUSSED ABOVE · NOTHING IN THIS BRIEF IS INVESTMENT ADVICE
MORNING EDITION · TUESDAY, SEPTEMBER 1, 2026 · TWO SUPERTANKERS HIT IN HORMUZ · BRENT $92 · SEPTEMBER HIKE ODDS 66% · ISM AND JOLTS AT 10:00
Daily Markets Briefing
The Brookside Brief
Markets · Macro · The Day Ahead
— CORRECTION: FRIDAY'S TWO-YEAR MOVE WAS LARGER THAN WE PRINTED
Yesterday we reported that the two-year Treasury yield rose "somewhere between six and eleven basis points" on Friday, to about 4.30%, and said we were printing the range because the wires disagreed. The Federal Reserve's H.15 release, published at 4:15 PM on Monday, settles it: the two-year constant maturity went from 4.20% on Thursday to 4.34% on Friday. That is fourteen basis points, above the top of the range we gave. The ten-year went 4.67% to 4.73% (six basis points, we said four) and the thirty-year 5.19% to 5.22% (three, we said two).
The direction of our argument was right and is in fact strengthened: fourteen at the front against three at the long end is a sharper bear flattener than the eight-versus-two we drew. But the lesson is the one we keep relearning. We had the primary source available and used wire reports instead because the wires were faster. H.15 is published every business day at 4:15 PM and it is definitive. From today the curve numbers in this brief come from H.15 or the Treasury's own daily yield curve, with wire quotes used only for intraday colour.
1. THE MORNING SETUP
Yesterday this brief asked whether the oil move would persist past forty-eight hours, and said the thing to watch was not the headline price but whether tanker traffic and war-risk insurance changed, "because those tell you whether the physical component is engaging." It engaged overnight. Two very large crude carriers were struck by projectiles in quick succession while exiting the Persian Gulf through the Strait of Hormuz. The maritime security consultancy Marisks named them: the Sidr, run by Saudi Arabia's Bahri, hit northeast of Khasab, Oman; and the Senegal Prosperity, operated by South Korea's Sinokor, struck by three projectiles east of the same country. The UK Maritime Trade Operations agency confirmed one outbound tanker hit by three projectiles. No casualties or environmental damage have been reported.
Brent is up 4.46% to $92.31. WTI is up 2.37% to about $87.79. President Trump threatened further strikes while ruling out nuclear action against an adversary he described as "totally defeated." Equity futures are lower across the board and the Nasdaq is taking the most of it: Dow futures −0.59%, S&P 500 −0.63%, Nasdaq 100 −1.09%, Russell 2000 −0.56%.
YESTERDAY'S THREE TESTS, SCORED
Test One — does the September hike probability hold above 50%? Passed. It is 66.4% on CME FedWatch this morning, up from 60% yesterday and 34% before the keynote. Test Two — does the thirty-year stay put? Failed, or at least is failing. The ten-year rose for a fourth consecutive session on Monday to its highest since January 2025 and is 4.79% this morning; the two-year is 4.36%. Secondary sources give Monday's thirty-year variously as 5.19% and 5.25% and we will not choose between them here; H.15 settles it at 4:15 this afternoon. Test Three — does the oil move persist past forty-eight hours? Passed, and for the reason we said would matter rather than the reason the headlines said.
Fig. 1 — September, still repricing higher.
2. MARKETS AT A GLANCE
MONDAY'S CLOSE, 31 AUGUST — AND THE MONTH
Asset
Last
Change
% Chg
S&P 500
7,686.14
−0.33%
August: +2.5%
Nasdaq Composite
26,370.89
−0.12%
August: +3.5%
Dow Jones Industrial
53,185.90
−0.70%
August: ~+1%
Russell 2000
2,956.45
−0.54%
—
Note the sector split on Monday, because it is the whole story in miniature: communication services, utilities and industrials fell hardest, while energy and information technology finished higher. A market being repriced for higher rates and higher oil sells the rate-sensitive and buys the barrel.
A note on our own figures. Yesterday morning we printed August month-to-date performance as Dow +2.1%, S&P roughly +3% and Nasdaq roughly +4%, sourced to Quartz before the open. Monday's decline took the final numbers to roughly +1%, +2.5% and +3.5%. Nothing was wrong when written; month-to-date figures printed before the last session of the month are provisional and we should have labelled them so.
THIS MORNING, 1 SEPTEMBER, ROUGHLY 8:34 AM ET
Asset
Last
Change
% Chg
S&P 500 futures
—
−0.63%
SPY $762.67, −0.57%
Nasdaq 100 futures
—
−1.09%
QQQ $708.43, −1.16%
Dow futures
—
−0.59%
—
Russell 2000 futures
—
−0.56%
—
Brent crude
$92.31
+4.46%
above $92
WTI crude
~$87.79
+2.37%
—
10-year Treasury
4.79%
higher
since Jan 2025 highs
2-year Treasury
4.36%
higher
—
Gold, spot
~$4,377.83
−1.61%
—
Dollar index
99.5620
+0.13%
—
Bitcoin
~$77,826
−1.10%
24-hour
3. TOP STORIES
The Physical Component Engages
The distinction we drew yesterday between the physical and risk components of a wartime oil price is no longer theoretical. Sunday's American strike on Larak Island removed no barrels; it repriced the possibility that barrels might be removed. Monday night's attacks on the Sidr and the Senegal Prosperity are a different category of event, because they are attacks on the carriers themselves rather than on the military assets threatening them. Reporting indicates this is the fourth such incident in recent days, with several accounts pointing to Iranian anti-ship cruise missiles.
Two things follow. First, the mechanism by which a strait actually closes is insurance, not sunk tonnage — the subject of today's primer in Section 7. Second, supply has not in fact stopped. Bloomberg reported yesterday that traders monitoring cargoes still count roughly six to eight million barrels a day moving through Hormuz, and Iran's semi-official Mehr news agency said traffic along a route Tehran approves "is taking place on a limited basis," with ships paying tolls. A chokepoint that charges tolls is a chokepoint that is being taxed, not closed. That is a materially different world from one in which the strait shuts, and it is the world the current price reflects.
What Warsh Actually Bought
Now that H.15 is available, Friday's move can be decomposed properly, and the result is more interesting than the nominal yields alone suggested. The ten-year nominal yield rose six basis points, from 4.67% to 4.73%. The ten-year inflation-indexed — the real yield — rose eight, from 2.34% to 2.42%. The difference between them, the breakeven inflation rate, therefore fell about two basis points, from roughly 2.33% to 2.31%.
Read that again, because it is the single cleanest piece of evidence available on how the bond market received the speech. Yields rose entirely because the real rate rose — because the market now expects tighter policy. Compensation for expected inflation went down. A hawkish central banker who raises real rates and lowers inflation expectations in the same session is a credible one. The alternative outcome, in which nominal yields rise because breakevens rise, is what a loss of credibility looks like, and it is not what happened.
Fig. 2 — Friday's ten-year move, decomposed from the Fed's own daily release.
Breakeven inflation is the difference between a nominal Treasury yield and the real yield on an inflation-protected security of the same maturity. It is the rate of inflation at which holding either would have produced the same return, and so is a rough market forecast of average inflation over the period. It is imperfect — it embeds a liquidity premium and an inflation risk premium — but the direction of a one-day move is informative.
One Regional Survey Is Not a Recession
We gave the Chicago Business Barometer prominent treatment yesterday: down 10.5 points to 47.1, the weakest of the year, against expectations near 57.9. Context we should have supplied at the time and are supplying now: the national ISM manufacturing index printed 55.6 in July, which was reportedly its highest since May 2022, and the consensus for this morning's August reading is around 55.0. A national gauge in solid expansion and a Chicago gauge in sharp contraction cannot both be describing the same manufacturing economy.
The honest reading is that Chicago is a small, volatile, single-metro survey with a well-earned reputation for false signals, and the burden of proof sits with it rather than with ISM. That said, this is exactly why the ten o'clock number matters this morning. If ISM comes in near 55, Friday's Chicago print was noise and we over-weighted it. If ISM breaks materially below expectations, Chicago was early. We stated the question yesterday and it gets answered in about an hour.
Trump on Data Centres
Alongside the Iran remarks, the President warned that communities rejecting AI data centres risk being "backwards and poor." That is a direct federal intervention into the siting fight this brief has been tracking as the principal political risk to the AI-energy complex. The argument developing across several states is that ordinary ratepayers should not fund grid build-out to serve hyperscale load. A President putting his weight on the pro-siting side changes the politics; whether it changes the state public utility commission decisions that actually govern cost allocation is another matter, and we would not assume it does.
4. MACRO & FED WATCH
Jeremy Siegel made the most useful hawkish observation of the weekend, praising the keynote for its "explicit recognition that money supply and bank credit matter for the Fed's inflation outlook" and noting that an effective funds rate of 3.63% against bank credit expanding at 7% to 8% is "hardly consistent with a monetary policy crushing demand." The 3.63% figure is confirmed in H.15 for every business day of last week. Whatever one thinks of monetary aggregates as a forecasting tool — and the profession has largely abandoned them — the point stands on its own: if credit is growing at better than twice the policy rate, policy is not restrictive in any straightforward sense.
The counter-case is not absent. Louis Navellier has told investors to take a "chill pill" on a September move, while LPL's Jeffrey Roach argues sticky inflation demands tightening. Note that the debate has moved. Three weeks ago the question was how many cuts. It is now whether the first hike lands this month or in December.
WHY THE WHOLE CURVE IS NOT MOVING TOGETHER
A hiking cycle raises the front end mechanically: two-year yields are close to an average of expected policy rates over two years. The long end is different. It carries expected policy over decades plus a term premium, and term premium responds to things monetary policy does not control — the supply of duration the Treasury issues, foreign demand, and the market's confidence that inflation will not be inflated away. Friday's session was the good version: front end up, long end nearly still, breakevens down. Monday and this morning look less good, with the ten-year at its highest since January 2025. Watch whether the thirty-year outpaces the ten-year. If it does, the story stops being about the Fed and starts being about the debt.
5. ECONOMIC CALENDAR
TODAY AND THE RUN INTO PAYROLLS
Date
Time ET
Release
Note
TUE 1 Sep
9:45 AM
S&P Global US mfg PMI, final
August
TUE 1 Sep
10:00 AM
ISM MANUFACTURING PMI
~55.0 expected, 55.6 prior
TUE 1 Sep
10:00 AM
JOLTS job openings
July
TUE 1 Sep
10:00 AM
Construction spending
July
Wed 2 Sep
8:15 AM
ADP employment change
August
Thu 3 Sep
8:30 AM
Trade balance
July
Thu 3 Sep
10:00 AM
ISM services PMI
54.1 prior
FRI 4 Sep
8:30 AM
EMPLOYMENT SITUATION
Consensus +50,000
Today is the day this week's stagflation question gets its first real answer. ISM manufacturing tells you whether Friday's Chicago collapse meant anything. JOLTS tells you whether labour demand is cooling underneath a headline unemployment rate that Warsh described as stable at 4.1%. Both at ten o'clock, both national, both more reliable than what moved the tape on Friday.
9 September: the enlarged Treasury buyback operations begin. 15-16 September: FOMC, roughly two-thirds of a hike priced.
6. EARNINGS WATCH
Palo Alto Networks (PANW), Dell (DELL) and MongoDB (MDB) all report after today's close — the first cluster of consequence since Nvidia. Dell is the one to watch for the AI thread: it is where hyperscaler capex becomes somebody's revenue, and its server margin commentary is a cleaner read on whether AI infrastructure is a good business for the people assembling it than any chip company's results can be. All three were lower in pre-market alongside the broader Nasdaq weakness.
Elsewhere: Pyxis Tankers (PXS) fell more than 10% despite beating on second-quarter earnings, 27 cents against a 20-cent consensus — an odd reaction in a week when tanker economics are front-page news, and a reminder that a beat is not a catalyst when the market is repricing something else entirely.
7. THE PRIMER: HOW A STRAIT ACTUALLY CLOSES
Almost everything written about the Strait of Hormuz asks the wrong question. The question is not whether Iran can sink enough ships to block the channel. It cannot, and it does not need to. The question is whether underwriters will keep writing cover at a price shipowners will pay. That is the actual mechanism, and once you see it the news flow becomes far easier to read.
What war-risk insurance is
A commercial vessel carries several distinct layers of cover, and the crucial thing is that the ordinary ones explicitly exclude war. Hull and machinery insures the ship against fire, grounding, collision and the like, and it contains a war exclusion. Protection and indemnity, provided by mutual clubs, covers third-party liabilities — crew injury, pollution, wreck removal — and it too carves out war. Cargo insurance covers the oil. Sitting on top is war risk: a separate policy, separately priced, covering loss from hostile acts, mines, terrorism, seizure and detention.
War-risk cover is quoted as a percentage of the insured value of the hull, charged per voyage into a designated area, rather than as an annual premium. That per-transit structure is what makes it such a fast and honest signal: it reprices in hours, it is a real cash cost paid by a real counterparty, and nobody pays it to express an opinion.
Who decides where the war zone is
In the London market — still the centre of marine war risk — the relevant body is the Joint War Committee, made up of underwriter representatives from Lloyd's and the company market. It maintains a list of Listed Areas: waters where an owner must give notice before entering and where additional premium becomes payable. Adding a body of water to that list does not prohibit anything. It simply converts a routine passage into a priced event. That is the moment a geopolitical headline becomes a line item on a voyage economics spreadsheet.
Fig. 3 — The war-risk premium through this conflict. Dated figures, not today's quote.
The arithmetic
The numbers in Figure 3 are worth sitting with. A very large crude carrier transiting Hormuz in late February 2026, before this conflict, could be covered for roughly 0.25% of hull value. On a $100 million vessel that is about $250,000. Within roughly a week of the Joint War Committee reclassifying the strait, reported quotes had moved into a 1% to 3% range. By mid-July, with attacks intensifying, reporting put premiums at 3% to 10% of hull value, with some accounts citing 7.5% to 10%. The same $100 million tanker is then facing $3 million to $10 million for a single passage. One account put cover for a 270,000-tonne carrier at around $21 million at peak tension.
Every figure in that paragraph is dated and attributed in the chart note. We do not have a verified quote for today and are not pretending otherwise. What we are confident of is the structure: these premia move by multiples, not by percentages, and they move before the physical flow does.
Why this is the transmission mechanism
Now put the pieces together. A VLCC carries roughly two million barrels. At $92, that cargo is worth about $184 million. A war-risk premium of $10 million is therefore on the order of $5 a barrel of pure friction cost, before freight, before the charterer's own margin. At some premium level the voyage stops clearing — not because it is unsafe, but because it is unprofitable. The strait closes when the arithmetic closes it.
THREE SECOND-ORDER EFFECTS WORTH KNOWING
One: the fleet bifurcates. Owners with older, fully depreciated tonnage and a high risk appetite keep sailing and capture the premium freight rates; owners of modern vessels with mortgages and reputations withdraw. The trade does not stop, it changes hands, and it changes hands toward operators with less to lose — which is itself a safety problem. Two: state backstops appear. When commercial cover becomes unobtainable, governments write it, as several did for Black Sea grain. That is fiscal policy conducted through an insurance ledger, and it is invisible in the oil price. Three: the discount is geographic. Crude that must pass a listed area trades cheaper at the loading port than crude that does not, because the buyer bears the transit cost. Watch the spread between Gulf grades and Atlantic Basin grades — it is a cleaner read on chokepoint risk than Brent itself, because Brent is priced on the safe side of the strait.
What to watch instead of the headline price
Joint War Committee listing changes. Published, and the closest thing to an official declaration that a waterway has become dangerous. Quoted additional premium as a percentage of hull value. Reported by the trade press and by brokers such as Marsh; multiples matter, decimals do not. Transit counts. The six to eight million barrels a day currently moving through Hormuz is the number that falsifies the closure thesis, and it is published by cargo trackers. And the behaviour of the owners. When Bahri and Sinokor — a Saudi state-linked carrier and a major Korean operator, both of whom just had ships hit — announce whether they will keep transiting, that will tell you more than any statement from any government.
8. ANALYST CALLS DRIVING ACTION
BofA on Apple under John Ternus, who took over as chief executive today: sees "device dominance" in the AI era, a $380 target and close to 20% upside. Jeremy Siegel: constructive on equities, citing a "very strong fundamental backdrop from the AI story," with the timing of Warsh's first hike as the main uncertainty. Louis Navellier: a "chill pill" on September. LPL's Jeffrey Roach: sticky inflation demands tightening.
9. STOCKS TO WATCH
THE CIRCULAR-FINANCING FILE
Nvidia fell 1.31% in pre-market after disclosing a $3.5 billion investment in convertible bonds to deepen its relationship with MediaTek. This desk has been keeping a running file on arrangements in which a supplier funds its customers or partners, because the historical precedent — Lucent's vendor financing in the late 1990s — is that these structures look like commercial partnership on the way up and like receivables risk on the way down. A convertible into a large, profitable, listed Taiwanese chip designer is a considerably better instrument than an unsecured loan to a cash-burning cloud start-up, and we do not put it in the same category. It goes in the file all the same. Note too Friday's report that Nvidia has paused revenue-sharing deals with AI cloud companies — the same underlying question, answered in the other direction.
AI-ENERGY AND PHYSICAL AI
Utilities were among Monday's worst sectors, which is what a hiking cycle does to long-duration, dividend-paying, capital-intensive equities regardless of how good the demand story is. That is worth holding onto: the AI-power thesis and the AI-power trade have been diverging all year, and rates are a large part of why. Cerebras Systems (CBRS) fell 1.76% despite announcing a 165-megawatt AI data centre in Mikkeli, Finland, with Compute Nordic Finland — a reminder that the buildout is now routinely siting outside the United States, where power is cheaper and the politics are quieter. On the physical-AI bench: Symbotic (SYM), Teradyne (TER), Serve Robotics (SERV) and Cognex (CGNX), with Symbotic still the outlier — down roughly a third this year against a reported backlog near $22.5 billion.
10. GLOBAL MACRO SNAPSHOT
Market
Direction
Note
Detail
Asia
Broadly lower
Kospi the exception
CSI 300, Nikkei, Hang Seng, ASX, Nifty all fell
Europe
Lower in early trade
—
London back after Monday's holiday
Dollar index
99.5620
+0.13%
Firm on hike pricing
Gold, spot
~$4,377.83
−1.61%
After its best month since 1999
Gold is the instructive one. It has just posted its strongest monthly gain since 1999 and is down more than one and a half percent this morning, with a war escalating. That is not a contradiction. Gold pays no coupon, so its price is highly sensitive to real yields — and the ten-year real yield rose eight basis points on Friday and has kept going. When the safe-haven bid and the real-rate drag point in opposite directions, the real rate usually wins over days and the haven bid usually wins over hours.
11. WEEK AHEAD PREVIEW
Today, 10:00: ISM manufacturing and JOLTS. The first honest test of the stagflation read.
Today, after the close: Palo Alto Networks, Dell, MongoDB.
Today, 4:15 PM: H.15, which settles Monday's thirty-year.
Wednesday and Thursday: ADP, trade, ISM services.
Friday, 8:30: August payrolls. Consensus +50,000 after −23,000 in July.
One. ISM at ten o'clock. Near 55 and Chicago was noise; materially below and we have a genuine divergence between the regional and national surveys to explain.
Two. The thirty-year against the ten-year. A long end outpacing the belly would mean the market has stopped pricing a credible Fed and started pricing a supply problem. Friday's breakeven move said the opposite; we will know within days whether that survives.
Three. Whether Bahri or Sinokor suspends Hormuz transits. That single commercial decision would tell us more about the physical supply risk than another week of strike headlines.
12. THE CLOSING THOUGHT
The two tankers hit last night were both outbound. They had already loaded, already paid whatever premium the underwriters asked, already accepted the risk, and were on their way out with the cargo aboard. Somebody sat down, looked at a quoted additional premium of some number of percent of hull value, multiplied it out, compared it to the freight, and decided the voyage still cleared. That calculation is being run several dozen times a day in offices in Riyadh, Seoul, Athens and Singapore, and the aggregate of those decisions — not the missiles, not the communiqués, not the President's adjective for his adversary — is what determines whether six to eight million barrels a day keep moving. The oil price you see on your screen is a summary of that arithmetic, computed by people with their own money on the ship. It is worth remembering, on a morning when everyone will be watching Brent, that Brent is the output of the calculation rather than the input. Ten o'clock brings ISM. Have a good Tuesday.
THE BROOKSIDE BRIEF · COMPILED 9:00 AM ET, TUESDAY 1 SEPTEMBER 2026, BEFORE THE OPEN · CORRECTION TO FRIDAY'S TWO-YEAR YIELD MOVE APPEARS AT THE HEAD OF THIS BRIEF · SOURCES: FEDERAL RESERVE H.15 SELECTED INTEREST RATES, RELEASED 31 AUGUST 2026, READ DIRECTLY (ALL TREASURY CONSTANT-MATURITY AND TIPS YIELDS, THE EFFECTIVE FUNDS RATE; BREAKEVEN INFLATION COMPUTED BY THIS DESK AS THE DIFFERENCE AND IS NOT A PUBLISHED BOARD SERIES); INSURANCE JOURNAL / BLOOMBERG AND UKMTO VIA MARISKS (THE SIDR AND SENEGAL PROSPERITY); BENZINGA (1 SEPTEMBER PRE-MARKET LEVELS, BRENT, WTI, GOLD, DOLLAR, BITCOIN, CME FEDWATCH AT 66.4%, MONDAY SECTOR DETAIL, NVIDIA-MEDIATEK, CEREBRAS, PYXIS, SIEGEL, BOFA, NAVELLIER, ROACH, TRUMP REMARKS); YAHOO FINANCE AND BLOOMBERG (HORMUZ TRANSIT VOLUMES, MEHR NEWS AGENCY ON TOLLS, MONDAY MARKET COVERAGE); THE NATIONAL, S&P GLOBAL CITING MARSH, HOWDEN RE AND THE STRAUSS CENTER (WAR-RISK PREMIUM FIGURES, ALL DATED IN THE CHART NOTE); CONTINUUM ECONOMICS (ISM CONSENSUS) · WAR-RISK PREMIUM FIGURES ARE FROM FEBRUARY TO JULY 2026 AND ARE NOT REPRESENTED AS CURRENT QUOTES; NO VERIFIED 1 SEPTEMBER QUOTE WAS OBTAINED · SECONDARY SOURCES GIVE MONDAY'S THIRTY-YEAR CLOSE AS BOTH 5.19% AND 5.25%; WE DECLINE TO CHOOSE AND DEFER TO H.15 THIS AFTERNOON · DISCLOSURE: THIS BRIEF IS RESEARCHED AND DRAFTED WITH THE ASSISTANCE OF AN AI SYSTEM BUILT BY ANTHROPIC, A COMPANY OPERATING IN THE SECTOR DISCUSSED ABOVE · NOTHING IN THIS BRIEF IS INVESTMENT ADVICE
MORNING EDITION · WEDNESDAY, SEPTEMBER 2, 2026 · IRAN MINES HORMUZ, TWO TANKERS DISABLED · 10-YEAR HIGHEST SINCE NOV 2023 · ADP +38,000 · BROADCOM TONIGHT
Daily Markets Briefing
The Brookside Brief
Markets · Macro · The Day Ahead
1. THE MORNING SETUP
The thing the Larak Island strike was meant to prevent has happened. Iran's Revolutionary Guards said this morning that two oil tankers struck naval mines while attempting to transit the Strait of Hormuz. In a statement carried by Iranian state media, the IRGC said the vessels were disabled and their crews forced to disembark after the ships ignored warnings to take what it called an "illegal route" through the strait. Overnight, Iran targeted Jordan, the United Arab Emirates and Kuwait with missiles and drones in retaliation for a fresh round of American airstrikes on Tuesday.
Two claims are now in direct conflict and readers should hold both as claims. President Trump wrote on Truth Social that the United States has "almost total control" over the Strait of Hormuz and that Iran's economy is collapsing, adding that he is "not trying to force Iran to the bargaining table." The IRGC is simultaneously asserting that it is mining the waterway and enforcing a route of its own choosing. Both statements are from interested parties. What is independently reported is that two more ships are out of service.
Markets are taking it calmly, which is itself the story. Brent is up 0.57% to $95.19 and WTI up 0.32% to $90.51 — moves of well under a dollar on the day a belligerent announced it had mined the world's most important oil chokepoint. The pressure is showing up in bonds instead: the ten-year Treasury touched 4.814% this morning, its highest since November 2023, with gilts, Bunds and OATs all higher and the Japanese ten-year near a multi-decade high.
YESTERDAY'S THREE TESTS, SCORED
Test One — ISM near 55 and Chicago was noise? Passed, in the direction of our own correction. ISM manufacturing printed 54.6 for August, an eighth consecutive month of expansion, one point below July's 55.6 and modestly under the 55.2 consensus. Friday's Chicago collapse to 47.1 was a single-metro survey behaving like a single-metro survey. We over-weighted it on Monday and said so on Tuesday; the data has now settled it.Test Two — does the thirty-year stay put? Failed, and the failure is broadening. The thirty-year is around 5.29% and the ten-year has taken out its January 2025 high and is now at levels last seen in November 2023. Friday's clean bear flattener has become something closer to a parallel shift higher. Test Three — do Bahri or Sinokor suspend Hormuz transits? Not yet answered publicly. Mines change that calculation materially and we expect an answer within days.
2. MARKETS AT A GLANCE
TUESDAY'S CLOSE, 1 SEPTEMBER — A THIRD STRAIGHT LOSING DAY
Asset
Last
Change
% Chg
S&P 500
7,631.47
−0.71%
third down day
Nasdaq Composite
26,099.77
−1.03%
—
Dow Jones Industrial
52,766.88
−0.79%
−419.02 pts
Brent crude, settle
$94.65
+4.6%
+$4.16
THIS MORNING, 2 SEPTEMBER, ROUGHLY 8:26 AM ET
Asset
Last
Change
% Chg
Brent crude
$95.19
+0.57%
—
WTI crude
$90.51
+0.32%
—
10-year Treasury
4.814%
high of day
highest since Nov 2023
30-year Treasury
~5.29%
+2 bp
—
Gold futures
$4,355
−0.94%
—
Silver futures
$64.26
−1.69%
—
Equity futures were mixed to lower and quotes varied by provider through the morning; we are not printing a single futures level we cannot stand behind. Note the ratio in the two tables: Brent settled up 4.6% on Tuesday and is up half a percent this morning. The oil market did most of its repricing yesterday.
3. TOP STORIES
ADP: Take Out Healthcare and There Is Nothing There
Private payrolls rose 38,000 in August against a 47,000 consensus, the smallest gain since January, after an upwardly revised 46,000 in July. The headline is soft. The composition is softer.
Education and health services added 45,000 — more than the entire headline. Leisure and hospitality added 16,000 and construction 12,000. Everything else was negative or flat: manufacturing shed 17,000, professional and business services shed 16,000, natural resources and mining and the trade, transportation and utilities group each lost 5,000. Strip out one non-cyclical, demographically driven, largely government-funded sector and August private hiring was negative.
Fig. 3 — August private payrolls by sector.
This rhymes with Tuesday's JOLTS release, which we read directly from the Bureau of Labor Statistics. Job openings were little changed at 7.3 million with the openings rate at 4.4%; hires were little changed at 5.1 million — but hires in professional and business services fell 188,000 in the month. The quits rate was 1.9%, historically very low: people are not leaving jobs, which is what a labour market looks like when workers do not believe they can find another one. June job openings were revised down by 177,000.
WHY ADP IS NOT PAYROLLS, AND WHAT TO DO WITH IT
ADP is built from the payroll records of a large sample of ADP's own client firms and is published two days before the Bureau of Labor Statistics establishment survey. It is not a forecast of the BLS number and its historical correlation with it is much weaker than most commentary implies — different universes, different seasonal adjustment, no government employment in ADP at all. What ADP is genuinely useful for is composition: it tells you which industries are adding and shedding, from actual payroll records rather than a survey response. So the right use of this morning's number is not "payrolls will be 38,000 on Friday." It is "whatever Friday prints, healthcare is carrying it." Consensus for Friday remains around +50,000 after July's −23,000.
Dell Answers the Question We Asked
Yesterday we wrote that Dell was the print to watch because "it is where hyperscaler capex becomes somebody's revenue, and its server margin commentary is a cleaner read on whether AI infrastructure is a good business for the people assembling it than any chip company's results can be." The answer is that it is a far better business than the consensus assumed.
Record revenue of $47.0 billion, up 58% year on year. Record non-GAAP diluted earnings per share of $7.04, up 203%, against a $4.91 consensus. And the number that matters: non-GAAP operating margin expanded to 12.6% from 7.7% a year earlier. Dell booked $60.9 billion of AI server orders in the quarter and exited with a $95.0 billion backlog. Full-year fiscal 2027 revenue guidance was raised by $25 billion to a $192.0 billion midpoint, roughly 70% growth, with non-GAAP EPS guidance to $25.50 at the midpoint. The shares are up about 8% pre-market after falling 6.8% in Tuesday's regular session.
The widely held view has been that AI servers are a low-margin pass-through — that Nvidia takes the economics and the box assemblers take the working capital risk. A consolidated operating margin that expands nearly five points while revenue grows 58% is not what a pass-through business does.We would flag two cautions. Consolidated margin can be flattered by mix within the wider group, and we have not yet seen the segment-level detail. And a $95 billion backlog is an order book, not revenue: it converts on someone else's schedule and at someone else's balance sheet risk.
The Rest of the Tape
Palo Alto Networks reported fiscal fourth-quarter revenue of $3.41 billion, up 34% and above the $3.35 billion consensus, with adjusted EPS of $1.02 against $0.98 expected, and guided fiscal 2027 revenue to $14.10-$14.20 billion and adjusted EPS to $4.16-$4.19, both above the Street. It also announced the acquisition of an AI-native platform, Console. MongoDB beat on both lines — revenue $771.8 million, up 30%, against $732.9 million expected, and adjusted EPS of $1.90 against $1.61 — and is down 12.4% pre-market on cautious guidance, which is the cleanest available illustration of a market that has stopped paying for beats and started paying only for raised outlooks. GitLab is up 21%. Broadcom, Snowflake and Hewlett Packard Enterprise report after today's close, with HPE up 3.8% and Snowflake down 2.5% going in.
4. MACRO & FED WATCH
The bond move is now global and it is no longer obviously about Warsh. Gilts, Bunds and French OATs are all higher this morning and the Japanese ten-year sits near a multi-decade high. When yields rise in unison across five sovereign markets with very different central banks, the common factor is not any one policy committee. It is some combination of oil-driven inflation risk and the supply of government debt.
That matters for how you read the US curve. On Friday, as we showed yesterday from the Fed's own H.15 release, the ten-year move was entirely real: nominal up six basis points, the inflation-indexed real yield up eight, breakevens down two. That was a credible-central-bank move. Since then the ten-year has taken out its January 2025 high and gone to levels last seen in November 2023, and the thirty-year has joined in. We will not know whether the composition has changed until we can compare nominal and TIPS yields for this week — H.15 publishes each business day at 4:15 PM and we will have Monday and Tuesday tonight. If breakevens are now rising alongside nominals, the story has changed from "a Fed that will act" to "an inflation the Fed is behind," and that is a materially worse setup for both bonds and equities.
The Federal Reserve's Beige Book is due this afternoon, and factory orders earlier. In a week this thin on hard data, anecdote from the twelve districts on pricing and hiring will get more attention than usual.
Broadcom after the bell is the most consequential print of the week outside Friday's payrolls. Its custom-accelerator business is the principal listed alternative to buying Nvidia, and its commentary on custom silicon orders is the best available read on whether hyperscalers are diversifying their compute supply or merely talking about it. Snowflake and HPE also report; HPE is the direct read-across from Dell's server margins and is up 3.8% in anticipation.
7. THE PRIMER: WHAT THE SPR CAN AND CANNOT FIX
Today's section draws on two reader-supplied pieces: Brian Potter's "How the Strategic Petroleum Reserve Works" in Construction Physics, published 27 August, and a passage from the Strategist's Substack — the same writer whose "There Is No Oil Price" this brief drew on last month — quoting Bloomberg Intelligence on transit costs. Read together they make a point neither makes alone.
First, the reserve itself
The Strategic Petroleum Reserve is the largest crude storage facility in the world, capable of holding 714 million barrels — slightly under 10% of annual American consumption. It was authorised by the Energy Policy and Conservation Act in 1975 in response to the 1973 OAPEC embargo, and construction began in 1977. The oil is not in tanks. It is in sixty caverns dissolved out of salt domes along the Texas and Louisiana Gulf Coast, thousands of feet underground.
Salt was chosen because it is effectively impermeable to oil and because you can mine a cavern by dissolving it — drill a well, pump in fresh water, pump out brine, and a void is left behind. Each cavern is kept permanently full of liquid: oil floating on brine. To withdraw oil you pump water in and the oil is displaced out the top. To refill, you pump oil in and brine out. Only the oil-brine boundary moves.
WHY THE SPR WEARS OUT
Every 100 barrels of fresh water pumped into a cavern dissolves roughly 15 barrels of salt. A complete drawdown therefore makes the cavern about 15% bigger — and thins its walls. Do that enough times and the walls can no longer take the stress and the cavern may leak into its neighbours or out of the dome. The reserve is not a tank you can empty and refill indefinitely; it is a consumable. Working in the other direction, the weight of overlying rock squeezes the caverns closed — "cavern creep" — costing the SPR up to 2.4 million barrels, about a third of a percent, of capacity every year. Sandia National Laboratories publishes an annual cavern-by-cavern estimate of remaining drawdowns, capped at five because behaviour beyond that is hard to model. Eleven of the original Phase I caverns are still in use, and six caverns have one drawdown or fewer left.
Second, where the reserve actually is
The SPR held 289.7 million barrels in the week ending 21 August, per EIA weekly data — the lowest level since November 1982. On 11 March the President authorised the Department of Energy to release 172 million barrels over roughly 120 days, as the American share of a 400-million-barrel collective action by IEA member countries in response to the disruption of flows through Hormuz. Potter put deliveries at around 120 million barrels as of late August. The EIA's next weekly release lands at 10:30 this morning and the SPR line is the one to read.
Fig. 1 — The claimed floors, and where the reserve actually sits.
Third, the floor nobody can source
This is the most useful thing in Potter's piece and it is a small masterclass in how to check a widely repeated number. You will constantly read that the SPR cannot go below 300 million barrels without damaging the caverns. Potter went looking for the origin of that claim and could not find one.
What he found instead was a spread of confident, mutually inconsistent assertions from credible people. A JPMorgan energy analyst: 150 to 160 million barrels "must remain in place to preserve cavern stability." Rapidan Energy, founded by a former George W. Bush energy adviser: 170 million. A Texas A&M petroleum engineering professor, Siddharth Misra: 250 to 300 million. Amos Hochstein, a former Biden energy adviser: people he knows think "we can't get near 300." The Department of Energy told CNBC the minimum for safe operation is 70 million — which is suspiciously close to 10% of capacity, the DOE's own definition of a "full drawdown." The DOE has separately denied the 300 million figure.
Potter's conclusion is that no report by the DOE, the GAO, Sandia or any other government body specifies a fill level below which damage occurs, other than the roughly 12 million barrels of "roof oil" needed to stop water dissolving the cavern ceilings. That is not proof the claims are wrong. It is a demonstration that a number quoted as engineering fact across the entire financial press has no published engineering source, and that the people quoting it disagree with one another by a factor of two.
THE CONSTRAINTS THAT ARE REAL
Potter is careful to separate the unsourceable from the documented, and so should we. Drawdown rate falls as caverns empty — you cannot pump the last barrels as fast as the first, so a depleted reserve is slower as well as smaller. Not all the oil is available at any moment. Crude in the caverns absorbs methane and warms, raising vapour pressure above the level at which it can be safely distributed; the fix is a degasification plant, and the SPR's was dismantled years ago and never replaced, which a recent GAO report notes can make oil at several sites unavailable in warmer months. And the whole facility has a large maintenance backlog, described as held together with "band aids," with the Life Extension Phase 2 programme begun in 2021 and then scaled back on cost. The binding constraint on the SPR is not a magic number. It is deliverability.
Fourth, and this is the point: the SPR is aimed at the wrong problem
Here is where the second reader-supplied piece earns its place. The Strategist, citing Bloomberg Intelligence, puts the current all-in cost of a direct Hormuz passage at $6 to $9 a barrel — VLCC rates of $300,000 to $400,000 a day plus $1.50 to $3 of war-risk insurance. The comparable Gulf-to-Asia charter cost in January was around 50 cents. And critically, the alternatives converge: Yanbu via Bab el-Mandeb at $9 to $10, around the Cape at $11 to $12. "Every route out of the Gulf now costs about the same."
Fig. 2 — The cost of moving a barrel out of the Gulf.
Now hold the two facts together. The United States has delivered on the order of 120 million barrels from a strategic reserve that is a consumable asset, is at its lowest level since 1982, and cannot be refilled quickly or cheaply. What it has bought with that is additional crude available at Gulf Coast terminals in Texas and Louisiana. What has actually changed in the world is that it costs roughly ten times as much to move a barrel out of the Persian Gulf as it did in January.
These are different problems and the SPR only addresses one of them. An SPR barrel is a substitute for a barrel that failed to arrive — it fixes a shortfall in American supply. It does nothing whatever about the freight and insurance cost of moving Saudi or Emirati crude to a refinery in Japan or Korea, which is where the actual friction sits. The reserve is a quantity instrument being used against what has become a logistics problem. It can hold the domestic price down for a while — and the flat price is indeed lower than the headlines would suggest, which is the Strategist's own point: "just because futures might have gone lower at a point in time during this war, doesn't mean the underlying costs moved that quickly."
The obvious rejoinder is that oil is fungible and a barrel released anywhere loosens the global balance everywhere. That is true at the margin and it is why SPR releases do move Brent. But fungibility works through arbitrage, and arbitrage is precisely what a ten-fold increase in transit cost impairs. The wider the freight wedge, the less one region's surplus relieves another region's shortage — which is the mechanism by which a single global oil price stops existing.
What to take from this
One. When you read a confident engineering constraint in a market note, ask who published it. The 300-million-barrel floor is repeated everywhere and sourced nowhere.
Two. The SPR's real limit is deliverability — rate, vapour pressure, maintenance — not a fill level, and deliverability degrades as the reserve empties. The reserve is least capable exactly when it is most needed.
Three. Watch freight and insurance, not just the flat price. A barrel is not a barrel if it is on the wrong side of a mined strait, and the cost of being on the wrong side is now measured in dollars per barrel rather than cents.
8. ANALYST CALLS DRIVING ACTION
Kyle Rodda, Capital.com: "Renewed hostilities in the Middle East sent crude prices surging, driving Wall Street lower and global bond yields to multi-year — and in some instances, multi-decade — highs," with markets "hopeful that the latest flare-up... is another attempt by the Trump administration to 'escalate to de-escalate'." Daniela Hathorn, also Capital.com: higher oil is "adding to concerns that inflation could remain elevated, adding further pressure on already rising global bond yields and strengthening expectations that the Federal Reserve may need to tighten monetary policy further."
Separately, and of interest given this desk covered his positioning on 14 August: Michael Burry is reported to have trimmed Veeva and cut PayPal. We have not seen the underlying filing and are noting the report rather than the position.
9. STOCKS TO WATCH
ENERGY AND SHIPPING
The tanker complex is now the most direct listed expression of the Hormuz story, and it cuts both ways: rates of $300,000 to $400,000 a day are extraordinary revenue for owners willing to sail, while every mined vessel is a hull loss and a crew at risk. Note Pyxis Tankers fell more than 10% on Monday despite beating — the market is not treating this as a clean long.
AI-ENERGY AND PHYSICAL AI
The AI-power complex is now fighting a ten-year Treasury at levels last seen in late 2023. Constellation, Vistra, Talen and the rest are long-duration cash flows with heavy capital programmes; the discount rate is doing more to their share prices this quarter than the demand story is. GE Vernova remains the exception. On the physical-AI bench, Symbotic (SYM), Teradyne (TER), Serve Robotics (SERV) and Cognex (CGNX). Dell's result is the relevant read-across for the whole complex: if the assemblers of AI infrastructure are earning 12.6% operating margins rather than 7.7%, the economics of the buildout are being shared more widely than the Nvidia-takes-everything model assumed.
10. GLOBAL MACRO SNAPSHOT
Market
Level
Note
Detail
United States
10-year 4.814%
Highest since Nov 2023
30-year ~5.29%
United Kingdom
Yields higher
—
—
Germany
Yields higher
—
—
France
Yields higher
—
—
Japan
10-year near multi-decade high
—
—
A synchronised global bond selloff is a different animal from a domestic repricing of the Fed. Five sovereign markets with five different central banks, three different inflation rates and wildly different fiscal positions do not move together because of anything Kevin Warsh said in Wyoming. They move together on oil, on the aggregate supply of government paper, or on a change in who is willing to hold duration. That is the question to be asking for the rest of this week.
11. WEEK AHEAD PREVIEW
Today, 10:30: EIA weekly petroleum status. The SPR line, and crude inventories.
Today, 2:00 PM: Beige Book. Today, 4:15 PM: H.15, giving us Monday and Tuesday's TIPS yields and therefore the breakeven composition of this week's selloff.
Today, after the close: Broadcom, Snowflake, Hewlett Packard Enterprise.
Thursday: jobless claims, trade balance, ISM services. Friday, 8:30: August payrolls, consensus +50,000.
WHAT WE ARE WATCHING, STATED IN ADVANCE
One. Tonight's H.15. If the ten-year breakeven has risen this week rather than fallen, the character of the bond selloff has changed and Friday's flattering interpretation of Warsh's speech no longer holds.
Two. Whether Brent can stay near $95 now that mines have been used and acknowledged. A muted price response to a genuine escalation would tell us the market believes the strait stays passable; a delayed surge would tell us it does not.
Three. Friday's payrolls against ADP's composition. If healthcare is again carrying the entire number, the labour market is weaker than a headline near 50,000 will make it sound, and the Fed's September decision gets considerably harder.
12. THE CLOSING THOUGHT
The Strategic Petroleum Reserve is a set of holes dissolved in salt, and every time you use one it gets a little bigger and a little weaker until one day it cannot be used again. That is a strange and rather beautiful fact about a policy instrument the financial press discusses as though it were a bank account. It is not a bank account. It is a consumable, purchased once in the 1970s at enormous cost and considerable fraud, and each barrel withdrawn is partly a withdrawal against the asset itself. We have now spent something like 120 million of them, taken the reserve to its lowest level since Ronald Reagan's first term, and the durable thing that has changed in the oil market is not the price of a barrel but the cost of moving one — which no amount of crude in a Texas salt dome can address. There is a general lesson in there about reaching for the instrument you have rather than the one the problem calls for, and it is not confined to energy policy. Ten-thirty brings the EIA number. Have a good Wednesday.
THE BROOKSIDE BRIEF · COMPILED 9:15 AM ET, WEDNESDAY 2 SEPTEMBER 2026, BEFORE THE OPEN · SOURCES: BUREAU OF LABOR STATISTICS JOLTS RELEASE USDL-26-1432 FOR JULY 2026, PUBLISHED 10:00 AM ET 1 SEPTEMBER 2026, READ DIRECTLY; FEDERAL RESERVE H.15 (FRIDAY'S NOMINAL AND TIPS YIELDS, AS REPORTED IN YESTERDAY'S BRIEF); EIA WEEKLY PETROLEUM STATUS DATA FOR THE WEEK ENDING 21 AUGUST 2026 (SPR AT 289.7 MILLION BARRELS); INSTITUTE FOR SUPPLY MANAGEMENT AUGUST 2026 MANUFACTURING REPORT VIA PR NEWSWIRE (PMI 54.6, NEW ORDERS 53.7, EMPLOYMENT 51.2); THESTREET AND CNBC (IRGC MINE CLAIM, TRUMP TRUTH SOCIAL REMARKS, IRANIAN STRIKES ON JORDAN/UAE/KUWAIT, ADP DETAIL, PRE-MARKET MOVERS, OIL AND METALS QUOTES, RODDA AND HATHORN); CNBC AND INVESTING.COM (TUESDAY CLOSE, DELL AND PALO ALTO AND MONGODB RESULTS, 10-YEAR AND 30-YEAR LEVELS); BRIAN POTTER, 'HOW THE STRATEGIC PETROLEUM RESERVE WORKS', CONSTRUCTION PHYSICS, 27 AUGUST 2026 (READER-SUPPLIED — ALL SPR ENGINEERING, HISTORY AND THE COMPILATION OF CLAIMED MINIMUM FILL LEVELS); THE STRATEGIST'S SUBSTACK QUOTING BLOOMBERG INTELLIGENCE (READER-SUPPLIED — ALL TRANSIT-COST FIGURES IN FIG. 2) · THE BLOOMBERG INTELLIGENCE TRANSIT COSTS HAVE NOT BEEN INDEPENDENTLY VERIFIED BY THIS DESK AND ARE REPRODUCED AS ATTRIBUTED · THE IRGC MINING CLAIM AND THE PRESIDENT'S 'ALMOST TOTAL CONTROL' CLAIM ARE BOTH STATEMENTS BY INTERESTED PARTIES AND ARE REPORTED AS SUCH · DELL'S 12.6% OPERATING MARGIN IS A CONSOLIDATED NON-GAAP FIGURE; SEGMENT DETAIL NOT YET REVIEWED · DISCLOSURE: THIS BRIEF IS RESEARCHED AND DRAFTED WITH THE ASSISTANCE OF AN AI SYSTEM BUILT BY ANTHROPIC, A COMPANY OPERATING IN THE SECTOR DISCUSSED ABOVE · NOTHING IN THIS BRIEF IS INVESTMENT ADVICE
Brent reached $99.38 a barrel at eight o'clock this morning — up $3.27 on yesterday morning, roughly $31.50 above where it stood a year ago, and sixty-two cents from a three-figure handle. The reason given in the reporting is the one this desk said on Tuesday would matter: not the strikes, but reduced tanker traffic through the Strait of Hormuz. Iran's Revolutionary Guards acknowledged yesterday that mines had disabled two vessels. Owners appear to be responding.
And the more consequential development is in the bond market, where something changed on Tuesday that we can now measure precisely. The Federal Reserve's H.15 release, published yesterday afternoon, gives us nominal and inflation-indexed yields through 1 September. The answer to the question we set on Tuesday is unambiguous, and it is the bad one.
THE THREE TESTS, SCORED
Test One — has the ten-year breakeven risen this week rather than fallen?Yes. It went 2.33% on Thursday, 2.31% on Friday — the good, credible-Fed move we described — held 2.31% on Monday, and then jumped to 2.35% on Tuesday. The nominal ten-year rose four basis points that day and the real yield did not move at all, so every basis point of it was inflation compensation. The flattering interpretation of the keynote held for exactly one session. Test Two — can Brent stay near $95 with mines acknowledged? Overtaken by events: it did not stay near $95, it went to $99.38. Test Three — do owners suspend Hormuz transits? No public announcement from Bahri or Sinokor, but "reduced tanker traffic" is now cited in the price commentary. We count that as answered in substance if not in form.
Fig. 3 — Brent, from before the Larak strike to this morning.
2. MARKETS AT A GLANCE
WEDNESDAY'S CLOSE, 2 SEPTEMBER — THE STREAK BROKEN
Asset
Last
Change
% Chg
S&P 500
7,666.60
+0.46%
snapped 3-day losing streak
Nasdaq Composite
26,217.83
+0.45%
—
Dow Jones Industrial
53,061.95
+0.56%
+295.07 pts
Stocks rose because yields paused, not because anything improved. Nvidia and Johnson & Johnson led the Dow.
TREASURY CONSTANT MATURITIES, FROM H.15 — THE PRIMARY SOURCE
Tenor
1 Sep
Change
Note
2-year
4.39%
+5 bp
from 4.34% on 31 Aug
5-year
4.55%
+6 bp
real unchanged at 2.18%
10-year
4.79%
+4 bp
real unchanged at 2.44%
30-year
5.27%
+2 bp
real 2.99% to 2.98%
10-yr breakeven
2.35%
+4 bp
computed by this desk
Fed funds, effective
3.63%
unchanged
every day last week
The ten-year has since traded past 4.8% intraday, which reporting variously describes as the highest since October 2023 and since November 2023. We are not going to arbitrate that; the H.15 figures above are the ones we stand behind, and tonight's release will give us Wednesday.
THIS MORNING, 3 SEPTEMBER
Asset
Last
Change
% Chg
Brent crude
$99.38
+$3.27
vs yesterday morning
Dow futures
—
+0.2%
—
S&P 500 futures
—
~flat
—
Nasdaq 100 futures
—
slightly lower
—
Initial jobless claims
206,000
+2,000
vs 205,000 expected
3. TOP STORIES
What Tuesday's Bond Move Actually Was
This is the most important thing in today's brief and it comes entirely from a free government data release that almost nobody reads. Last Friday, when Chair Warsh gave his Jackson Hole keynote, the ten-year Treasury yield rose six basis points and the ten-year real yield rose eight — meaning inflation compensation fell two. We said at the time that this was what central-bank credibility looks like: the market expecting tighter policy and lower inflation simultaneously.
On Tuesday the pattern inverted. The nominal ten-year rose from 4.75% to 4.79%. The real ten-year sat unchanged at 2.44%. The entire four-basis-point move was breakeven inflation, which went from 2.31% to 2.35%. The five-year tells the same story more loudly: nominal from 4.49% to 4.55%, real unchanged at 2.18%, breakeven up six basis points to 2.37%.
Fig. 1 — The ten-year, decomposed from the Fed's own daily release.
Tuesday was the day two supertankers were struck and Brent settled up 4.6%. The bond market's response was to raise its expectation of future inflation without raising its expectation of the real return required to hold duration. That is a commodity shock passing through into inflation compensation, and it is precisely what a central bank that has declared prices its "predominant focus" least wants to see in the week before it decides.
But Note What Kind of Shock the Market Thinks It Is
Before anyone reaches for the 1970s, look at the term structure of the move. The five-year breakeven rose six basis points, the ten-year four, and the thirty-year three. Near-dated inflation compensation rose most; long-dated rose least.
Fig. 2 — The breakeven move by tenor.
That downward-sloping shape is the signature of a shock the market expects to fade. A genuine regime change — a market concluding that the central bank has lost control of the price level — raises long-dated breakevens by as much or more than near-dated ones, because the damage is to the anchor itself. What we have instead is a market saying: energy is going to make the next two or three years hotter, and then we expect it to be over. That is a much better outcome than the alternative, and it is also exactly the reading that becomes wrong if oil stays above $95 for two more quarters. The thirty-year breakeven at 2.29% is the number to watch. It is the market's statement that the anchor still holds.
The Beige Book: One Sector Is Carrying the Economy
The Fed's twelve-district survey landed yesterday afternoon and it is a remarkable document. Economic activity increased "modestly" since early July; ten of twelve districts reported growth in the slight-to-moderate range and two reported no change. And the growth is attributed, specifically, to demand from data centres — with nonresidential construction up on balance and several districts noting a high concentration of activity related to data centre projects.
On employment the language is stark. Employment rose "very slightly overall": three districts reported modest gains, four slight gains, and five reported no change at all. Consumer spending grew only "marginally." And on prices, input pressure was elevated in manufacturing and construction across multiple districts, driven by energy, raw materials, transportation and petrochemicals. The outlook was positive but mixed, with contacts citing heightened uncertainty over energy prices, policy and international conflict.
Assemble those three sentences and you have the whole macro problem in one paragraph. Growth is concentrated in a single capital-intensive sector. Hiring has stopped in nearly half the country. Input costs are rising because of a war. That is not an economy a central bank can address with one instrument, which is why the September meeting is genuinely difficult rather than merely close.
Three Nights of Beating and Being Sold
The earnings pattern this week has become the clearest read available on what the market is actually paying for. MongoDB beat on both lines and fell 12.4% on cautious guidance. Hewlett Packard Enterprise beat — revenue $12.21 billion against $11.91 billion expected, adjusted EPS $1.11 against $0.93 — raised full-year EPS guidance to $3.75-$3.85 from $3.43, raised revenue guidance, and announced an expanded Oracle partnership deploying HPE Juniper Networking across Oracle's AI data centres. The shares fell 5%. HPE had entered the print up 116% year to date, which is most of the explanation.
Broadcom delivered what reporting characterises as respectable third-quarter numbers and fell 3.6%, on two things: unease about data centre financing, and reports that Google has struck a chip design agreement with Marvell. That second item deserves attention beyond a day's move. Broadcom's custom-accelerator franchise rests heavily on Google's TPU programme; a credible second supplier is a structural development, not a headline. We have not seen the underlying agreement and are reporting the report.
The two that rose are instructive by contrast. Dell beat and raised full-year revenue guidance by $25 billion. Snowflake grew product revenue 37% to $1.49 billion and gained 24%. The rule this week is not "beats are rewarded." It is that acceleration is rewarded and everything else — however good — is sold into a market that already owned it.
4. MACRO & FED WATCH
Initial jobless claims were 206,000 for the week ending 29 August, against 205,000 expected and a revised 204,000 the week before; the four-week average rose to 207,250. By any historical standard that is a very low number, and it is the single strongest piece of evidence for the view Warsh set out at Jackson Hole — that the labour market is "quite stable" and that soft monthly job gains reflect labour supply rather than deteriorating demand.
LOW FIRING IS NOT THE SAME AS HEALTHY HIRING
This week has produced an unusually clean illustration of a distinction that matters enormously right now. Claims measure separations — people losing jobs. They are very low. JOLTS on Tuesday showed the quits rate at 1.9%, historically depressed, meaning people are not voluntarily leaving. ADP yesterday showed 38,000 private jobs added, of which education and health services accounted for 45,000 — implying everything else, in aggregate, shed workers. And the Beige Book reports no employment change at all in five of twelve districts. Put together: firms are not firing, workers are not quitting, and firms are not hiring either. That is a frozen labour market, not a strong one. It can persist for a long time and it does not look like a recession in the claims data — which is exactly what makes it hard to read, and why tomorrow's unemployment rate matters more than the payroll count.
Fed Governor Christopher Waller's remarks are being digested this morning; futures steadied on them. September remains priced at roughly two-thirds for a quarter-point increase. ISM services arrives at ten o'clock with consensus at 54.3 against 54.1 prior — and given yesterday's Beige Book language on input costs, the prices-paid component is the line to read rather than the headline.
5. ECONOMIC CALENDAR
Date
Time ET
Release
Note
THU 3 Sep
8:30 AM
Initial jobless claims
DONE: 206,000 vs 205,000 exp
THU 3 Sep
8:30 AM
Trade balance
July
THU 3 Sep
10:00 AM
ISM SERVICES PMI
54.3 exp, 54.1 prior
THU 3 Sep
4:15 PM
H.15
Wednesday's breakeven
FRI 4 Sep
8:30 AM
EMPLOYMENT SITUATION
Consensus +50,000
Mon 7 Sep
—
LABOR DAY
US markets closed
Wed 9 Sep
—
Enlarged Treasury buybacks begin
$4bn per operation
Tue-Wed 15-16 Sep
—
FOMC
~two-thirds of a hike priced
6. EARNINGS WATCH
The week's AI cluster is done and the scorecard is uncomfortable for anyone who believed the tape rewards fundamentals in a straight line. Five companies beat consensus. Two went up. The calendar thins into the long weekend; the next thing that matters is not a company at all but eight-thirty tomorrow morning.
7. THE PRIMER: BREAKEVEN INFLATION, PROPERLY
We have used the word "breakeven" three days running and given it two sentences each time. It has now become the most informative number in the market, so it deserves a proper treatment.
The mechanics
The United States Treasury issues two kinds of note. A conventional Treasury pays a fixed coupon on a fixed principal. A Treasury Inflation-Protected Security — a TIPS — pays a fixed coupon on a principal that is adjusted upward with the Consumer Price Index. If you buy the conventional note you know your dollars and take the inflation risk. If you buy the TIPS you know your purchasing power and give up the chance that inflation comes in low.
The breakeven is simply the difference between the two yields. Yesterday's H.15 has the ten-year nominal at 4.79% and the ten-year inflation-indexed at 2.44%. Subtract: 2.35%. That is the average annual CPI inflation over the next ten years at which the two investments would produce identical returns. Above it the TIPS wins; below it the conventional note wins. Which is why the number is a market forecast of inflation, arrived at not by asking anybody's opinion but by observing the price at which two large groups of investors are willing to take opposite sides.
Why the decomposition is so powerful
Any nominal yield can be split into a real yield and an inflation compensation. That means every time a nominal yield moves, you can ask which half moved — and the answer tells you what the market thinks is happening.
Nominal up, real up, breakeven down. The market expects tighter policy and believes it will work. This is last Friday, and it is the best outcome available to a hawkish central banker.
Nominal up, real flat, breakeven up. The market has raised its inflation forecast without demanding more real return. This is Tuesday. It is a supply shock or a credibility question, and it is not good.
Nominal up, real up sharply, breakeven up too. The worst configuration: higher expected inflation and a higher required real return, which is what a market demanding compensation for policy risk looks like. This is 1979-82 and it is not where we are.
Nominal down, real down, breakeven down. A growth scare. The market expects cuts and lower inflation because it expects a weaker economy.
THE TERM STRUCTURE IS THE SECOND SIGNAL
Breakevens exist at every maturity, and comparing them is as informative as the levels. A five-year breakeven describes the next five years. A ten-year describes the next ten. The difference between them — the five-year-forward five-year breakeven — describes years six through ten, which is beyond any plausible commodity cycle and is therefore the cleanest available read on whether the inflation anchor is intact. When near breakevens rise and far ones do not, the market is pricing something temporary. When far breakevens move, the market is repricing the central bank itself. Tuesday: five-year up six basis points, ten-year up four, thirty-year up three. Temporary. That is the reassuring half of an unwelcome development, and it is only visible if you look at more than one tenor.
Four things wrong with it
One: it is not a pure forecast. A breakeven embeds an inflation risk premium — compensation for the uncertainty around inflation, not just its expected level — which means it typically sits above the market's true central expectation. When uncertainty rises, breakevens can widen without anybody's forecast changing.
Two: TIPS are less liquid than nominal Treasuries. In stressed markets TIPS cheapen for liquidity reasons alone, which pushes real yields up and breakevens down — exactly the wrong signal at the worst moment. In March 2020 breakevens collapsed partly because nobody could sell a TIPS.
Three: it references CPI, not the Fed's target. The Fed targets PCE inflation, which has run below CPI on average. A 2.35% CPI breakeven is not a market forecast of 2.35% PCE, and the wedge is usually a couple of tenths.
Four: seasonals and carry distort short tenors. A one-year or two-year breakeven is dominated by the known path of energy prices already in the index and by the seasonal adjustment convention. Five years out is about the shortest tenor worth reading as a genuine expectation.
How to use it from tomorrow
YOUR STANDING INSTRUCTION
H.15 publishes every business day at 4:15 PM Eastern at federalreserve.gov, free, and it contains both the nominal and the inflation-indexed constant-maturity curves. Subtract one from the other. That single arithmetic operation converts a headline you cannot interpret — "yields hit a two-year high" — into a statement you can: yields rose because the market wants more real return, or because it fears more inflation, and those two are opposite trades. Nobody will do this for you in a market wrap, because it takes a subtraction and a table. It took us two days too long to start doing it, and it has been the most useful thing in this brief since we did.
8. ANALYST CALLS DRIVING ACTION
Fed Governor Christopher Waller's commentary steadied futures this morning; we have not seen the full text and are not characterising it beyond the market reaction. Yesterday's calls stand: Capital.com's Kyle Rodda on markets hoping the Iran flare-up is "escalate to de-escalate," and Daniela Hathorn on higher oil raising the probability the Fed tightens further. Both look better this morning than they did yesterday, with Brent at $99.38 and the breakeven data now confirming the inflation-expectations channel Hathorn described.
9. STOCKS TO WATCH
THE CUSTOM-SILICON QUESTION
Broadcom is the name to watch for the rest of the month. If Google has genuinely engaged Marvell for chip design, the single most valuable franchise in the non-Nvidia AI complex has acquired a competitor at its anchor account. That is a different kind of risk from a soft quarter and it will not resolve in a session. Marvell is the other side of the same trade, and this desk notes it fell 7% on its own results only last week — a reminder of how quickly the market's view of who wins custom silicon can invert.
AI-ENERGY
The Beige Book has just told us, in the Federal Reserve's own words, that data centre demand is what is driving American economic growth. That is about as official as validation of the AI-power thesis gets. And the AI-power equities have spent the year falling, because a ten-year at 4.79% does more to the present value of a twenty-year contracted cash flow than a good demand story does to its numerator. Constellation, Vistra, Talen: the thesis is being confirmed by the central bank while the trade is being beaten by the discount rate. Those are not the same question and this brief has been careful not to conflate them. On the physical-AI bench: Symbotic (SYM), Teradyne (TER), Serve Robotics (SERV), Cognex (CGNX).
ENERGY AND SHIPPING
With Brent at $99.38 and Hormuz traffic thinning, the tanker complex and the majors are the day's obvious movers. Chevron and Halliburton also carry the separate Venezuela story we flagged on Monday, with Energy Secretary Chris Wright expected in Caracas this week.
10. GLOBAL MACRO SNAPSHOT
Market
Level
Change
Note
Brent crude
$99.38
+$3.27 on the morning
~$31.50 above a year ago
US 10-year
past 4.8% intraday
Highest since late 2023
H.15 close 4.79% on 1 Sep
US 30-year
5.27% on 1 Sep
+2 bp
real yield fell
SPR
~122m bbl drawn
Of a 172m authorisation
Lowest since Nov 1982
On the SPR: yesterday's EIA weekly release landed at 10:30 and we were unable to retrieve the current summary directly — the primary PDF endpoint served a stale December 2025 file when we requested it. The cumulative drawdown figure of roughly 122 million barrels against the 172 million authorised on 11 March, and the characterisation of the level as the lowest since November 1982, come from secondary summaries of the EIA data rather than from the release itself. We flag that rather than present it as verified.
11. WEEK AHEAD PREVIEW
Today, 10:00: ISM services. Read prices paid, not the headline.
Today, 4:15 PM: H.15 gives us Wednesday's breakeven — the first observation after Brent went to $99.
Tomorrow, 8:30: August payrolls, consensus +50,000 after July's −23,000. Then a long weekend: US markets closed Monday for Labor Day.
WHAT WE ARE WATCHING, STATED IN ADVANCE
One. The thirty-year breakeven, currently 2.29%. If it starts rising with the five-year rather than lagging it, the market has stopped treating this as an energy shock and started treating it as a regime question. That would be the most important development of the autumn and it would happen quietly, in a table nobody reads.
Two. Tomorrow's unemployment rate rather than the payroll count. Given a frozen labour market — low firing, low quitting, low hiring — the household survey's unemployment rate and the participation rate will tell you more than the establishment survey's headline.
Three. Whether Brent takes $100. It is sixty-two cents away. Round numbers are not economics, but they are journalism, and a three-figure oil price will change the political conversation about energy and about the Fed in a way that $99 does not.
12. THE CLOSING THOUGHT
The most important number this week was published at 4:15 in the afternoon in a table of about sixty rows on a government website, for free, and required a subtraction to see. Nominal ten-year, 4.79. Inflation-indexed ten-year, 2.44. The difference, 2.35, up from 2.31 — which is the market telling you that Tuesday's bond selloff was not about the Federal Reserve at all but about two tankers and a mine. Nobody wrote that headline, because the headline is "yields hit multi-year highs," and that sentence is true of both the good version and the bad version of this week and therefore tells you nothing. The Beige Book, published the same afternoon, says American growth is being carried by data centres while hiring has stopped in five of twelve districts. Brent is sixty-two cents from a hundred dollars. Payrolls are tomorrow. All of which is to say: the information is there, it is public, it is free, and the reason it is not priced is that reading it requires arithmetic rather than opinion. Have a good Thursday.
THE BROOKSIDE BRIEF · COMPILED 9:45 AM ET, THURSDAY 3 SEPTEMBER 2026, SHORTLY AFTER THE OPEN · SOURCES: FEDERAL RESERVE H.15 SELECTED INTEREST RATES, RELEASED 2 SEPTEMBER 2026, READ DIRECTLY — ALL NOMINAL AND INFLATION-INDEXED TREASURY YIELDS AND THE EFFECTIVE FUNDS RATE; BREAKEVEN INFLATION IS THE ARITHMETIC DIFFERENCE AND IS COMPUTED BY THIS DESK, NOT A PUBLISHED BOARD SERIES; FEDERAL RESERVE BEIGE BOOK, SEPTEMBER 2026, AS REPORTED BY BLOOMBERG, THE ABA BANKING JOURNAL, FXSTREET AND THE FEDERAL RESERVE BANK OF BOSTON; BUREAU OF LABOR STATISTICS (INITIAL CLAIMS 206,000 FOR THE WEEK ENDING 29 AUGUST, AS REPORTED); FORTUNE (BRENT AT $99.38 AT 8:00 AM ET ON 3 SEPTEMBER); THESTREET AND CNBC (WEDNESDAY CLOSE, BROADCOM, HPE, SNOWFLAKE, PRE-MARKET AND WALLER REACTION); INVESTING.COM AND BLOCKONOMI (EARNINGS DETAIL AND REACTIONS) · THE GOOGLE-MARVELL CHIP DESIGN AGREEMENT IS AS REPORTED; THIS DESK HAS NOT SEEN THE UNDERLYING AGREEMENT · SPR FIGURES ARE FROM SECONDARY SUMMARIES; THE EIA PRIMARY SUMMARY ENDPOINT SERVED A STALE DECEMBER 2025 FILE WHEN REQUESTED AND THIS IS FLAGGED IN SECTION 10 · REPORTING DESCRIBES THE TEN-YEAR'S INTRADAY HIGH AS BOTH THE HIGHEST SINCE OCTOBER 2023 AND SINCE NOVEMBER 2023; WE DECLINE TO ARBITRATE AND USE THE H.15 CLOSES · DISCLOSURE: THIS BRIEF IS RESEARCHED AND DRAFTED WITH THE ASSISTANCE OF AN AI SYSTEM BUILT BY ANTHROPIC, A COMPANY OPERATING IN THE SECTOR DISCUSSED ABOVE · NOTHING IN THIS BRIEF IS INVESTMENT ADVICE
MORNING EDITION · FRIDAY, SEPTEMBER 4, 2026 · PAYROLLS +162,000, TRIPLE CONSENSUS · JULY REVISED FROM MINUS 23,000 TO PLUS 21,000 · SERVICES PRICES PAID 72.6 · MARKETS CLOSED MONDAY
Daily Markets Briefing
The Brookside Brief
Markets · Macro · The Day Ahead
— CORRECTION AND A RETRACTION OF FRAMING
Two things this desk has printed repeatedly this week are no longer true, and one piece of analysis we built on Wednesday and Thursday looks wrong in light of this morning's data. Both go at the top rather than buried.
First, the fact. We have written on Monday, Tuesday, Wednesday and Thursday that the economy shed 23,000 jobs in July. The Bureau of Labor Statistics revised that figure this morning to positive 21,000 — a swing of 44,000 and a change of sign. June was also revised up, from +20,000 to +31,000. The two months together are 55,000 higher than previously reported. Nothing we wrote was wrong when written; it was the published number. But we quoted it four times without once noting that first prints of this series are routinely revised by more than the number itself. That omission is the subject of today's primer.
Second, the framing. On Wednesday we read the ADP report and wrote that healthcare was carrying the entire labour market. On Thursday we went further and described a "frozen labour market — firms are not firing, workers are not quitting, and firms are not hiring either." This morning's establishment survey does not support that. Payrolls rose 162,000. Health care added only 13,000, well below its twelve-month average of 32,000 — so healthcare was not carrying it. Manufacturing added 16,000, where ADP had it shedding 17,000. The average workweek rose. The number of people working part time for economic reasons fell by 414,000. Labour force participation edged up. That is not a frozen labour market.
We had written our own caution into Wednesday's brief — that ADP "is not a forecast of the BLS number and its historical correlation with it is much weaker than most commentary implies" — and then leaned on ADP's sector composition anyway twenty-four hours later. Printing the caveat and then ignoring it is worse than not printing it, because it borrows the credibility of care without doing the work.
1. THE MORNING SETUP
Total nonfarm payrolls rose 162,000 in August against a consensus of about 55,000, and the unemployment rate held at 4.1%. The gain was more than five times the 31,000 monthly average of the prior twelve months. It is, on its face, the strongest labour report in a year.
The composition is not what anyone expected. Food services and drinking places added 59,000, against a 12,000 monthly average. Local government education added 42,000, largely reversing a July decline. Manufacturing added 16,000 and is up 58,000 from its December 2025 low. And the information industry lost 23,000 — with declines in computing infrastructure providers, data processing and web hosting (−8,000), publishing (−7,000) and broadcasting (−5,000).
HOLD THAT LAST ONE AGAINST THE BEIGE BOOK
On Wednesday the Federal Reserve told us that American growth is being driven by demand from data centres. This morning the Bureau of Labor Statistics tells us that the industry category containing computing infrastructure providers, data processing and web hosting shed 8,000 jobs in August, within an information sector down 23,000. Both are true, and the reconciliation is the whole point: building a data centre is a construction project employing thousands of people for eighteen months; running one employs a few dozen forever. The AI buildout is a capital expenditure boom, not an employment boom, and it will show up in nonresidential construction and in electricity demand long before it shows up in payrolls — if it ever does.
Wages were benign. Average hourly earnings rose 10 cents, or 0.3%, to $37.75, and are up 3.1% over the year. Production and non-supervisory earnings rose 11 cents to $32.53. The average workweek edged up 0.1 hour to 34.4 hours. A 3.1% wage print is not an inflationary wage print.
Fig. 1 — Payrolls as first reported and as they stand today.
2. MARKETS AT A GLANCE
THURSDAY'S CLOSE, 3 SEPTEMBER — A RALLY ON WALLER
Stocks closed higher on Thursday as Treasury yields fell, driven by Fed Governor Christopher Waller indicating he would support holding rates steady this month barring surprises in the coming inflation data. Capital.com's Kyle Rodda noted that Waller's remarks, together with a falling dollar on a surging yen, pushed market pricing for a September hike back to roughly 50% — from above 60% earlier in the week. We do not have verified closing levels for the three indices in hand at this hour and are not going to print unverified ones; the direction is well established across sources.
THIS MORNING, 4 SEPTEMBER, PRE-PAYROLLS QUOTES
Asset
Last
Change
% Chg
Brent crude
$95.04
−0.50%
off Thursday's $99.38
WTI crude
$90.55
−0.82%
—
Gold futures
$4,513.20
−0.59%
—
Silver futures
$67.43
−0.40%
—
Bitcoin
$81,224.60
+3.23%
on easing hike odds
The oil answer to yesterday's third test: no. Brent did not take $100. It got to $99.38 yesterday morning and has come back to $95.04. Round numbers held, and the retreat came before this morning's data rather than because of it.
3. TOP STORIES
The Fed's Week Just Got Harder, Not Easier
Consider what has landed in the past forty-eight hours. Thursday: ISM services at 55.4 against a 54.3 forecast — and prices paid at 72.6, up 2.3 points, with a twelve-month average the highest since April 2023. Thursday afternoon: Waller signals he would prefer to hold. Friday: payrolls at 162,000, triple consensus, with wages at 3.1%.
Fig. 3 — ISM services, headline and prices paid.
That is close to the most awkward combination available to a committee that has declared prices its predominant focus. The labour market gives no cover for holding — 162,000 jobs and 4.1% unemployment is not an economy that needs protecting. Wages give no reason to hike — 3.1% annual earnings growth is consistent with two per cent inflation and decent productivity. And services prices at 72.6 say inflation is broadening in the two-thirds of the economy that has nothing to do with the Strait of Hormuz.
We flagged prices paid on Thursday morning as the line to read rather than the headline, and it delivered. A services prices index in the low seventies is not a reading you can attribute to crude alone.
What the Revisions Do to the Story
The July revision from −23,000 to +21,000 removes the single most-cited data point of the past month. That negative print was the reason September hike odds collapsed from 67% in early August to the low thirties; it was the evidence behind every "the labour market is cracking" note written since; and this desk used it as context four days running. It no longer exists.
What remains is a run of months averaging 31,000 with a 162,000 August on top. That is a slow labour market that has just had a good month, which is a materially different object from a labour market in contraction. Whether August is the signal or the noise is precisely the question the revisions should make you humble about — see Section 7.
ADP and BLS Could Not Have Disagreed More
Wednesday's ADP report and this morning's establishment survey describe two different economies. ADP had manufacturing shedding 17,000; BLS has it adding 16,000. ADP had professional and business services shedding 16,000; BLS reports little change. ADP had education and health services adding 45,000 and carrying the entire headline; BLS has health care adding 13,000, below its own twelve-month average.
Fig. 2 — The same month, two surveys.
The categories are not identical and the surveys cover different universes — ADP samples its own payroll clients and excludes government entirely, which matters enormously in a month when local government education added 42,000. That is the explanation, not an excuse. The lesson is that ADP's composition is not a preview of BLS composition, and we should not have treated it as one.
Iran: Sanctions Widen, and a Fight Over the Word
The European Union has formally joined the American-led sanctions campaign against Iran — "Operation Economic Outcast" — which Treasury Secretary Bessent publicly welcomed. South Korea is reported to be weighing a military role in helping reopen the Strait of Hormuz. Meanwhile Vice President Vance declined to call the six-month-old conflict a war: "I wouldn't call it a war... Right now, there is no active shooting." He said so on a day when Iran had fired on Kuwait.
We report the disagreement without adjudicating it. But note the market consequence: a conflict that is formally not a war is one in which war-risk underwriters, charterers and insurers must still price as though it is. The gap between the legal characterisation and the commercial one is where the $6-to-$9 a barrel of transit cost we described on Wednesday actually lives.
4. MACRO & FED WATCH
Going into this morning, September was priced at roughly 50% after Waller — down from above 60% earlier in the week and 66% on Tuesday. A 162,000 payroll print with steady unemployment removes the labour-market argument for patience. Whether it moves pricing much depends on how the committee weighs a hot services prices index against a 3.1% wage number, and on the August CPI report, which Waller explicitly named as the thing that will determine his vote.
WHY PARTICIPATION RISING IS THE QUIETLY GOOD NEWS
The labour force participation rate edged up to 61.6% in August — though it remains half a percentage point below January. Participation matters because it determines how fast the economy can grow without generating inflation. Warsh made exactly this argument at Jackson Hole: "When labour supply is barely growing, monthly job gains are naturally going to run low." If participation is now rising, the economy can absorb stronger payroll growth without wage pressure — which is precisely what a 162,000 print alongside 3.1% earnings growth looks like. One month is not a trend, and the level is still down on the year. But the direction is the single most encouraging thing in this report, and almost nobody will lead with it.
5. ECONOMIC CALENDAR
Date
Time ET
Release
Note
FRI 4 Sep
8:30 AM
EMPLOYMENT SITUATION
DONE: +162,000, u-rate 4.1%
FRI 4 Sep
4:15 PM
H.15
Thursday's breakeven
MON 7 Sep
—
LABOR DAY
US stock and bond markets closed
Wed 9 Sep
—
Enlarged Treasury buybacks begin
$4bn per operation to 4 Nov
mid-Sep
—
AUGUST CPI
Waller has named this as decisive
Tue-Wed 15-16 Sep
—
FOMC
~50% of a hike priced after Waller
Fri 2 Oct
8:30 AM
September employment situation
And the August revision
6. EARNINGS WATCH
Lululemon fell 20.4% pre-market after missing third-quarter revenue forecasts, reporting deteriorating comparable sales and cutting its full-year outlook. Guidewire fell 14.5% on weak first-quarter fiscal 2027 revenue guidance that overshadowed a fourth-quarter beat. Fair Isaac fell 12.2% after the Federal Housing Finance Agency's director announced a directive ending its effective mortgage-scoring monopoly — a regulatory event rather than an operating one, and the kind of single-agency risk that does not appear in any model.
On the other side: Volkswagen rose 6.1% on announcing a further 50,000 job cuts under a "Future Plan 2030," bringing planned reductions to 100,000. A stock rising six per cent on the elimination of fifty thousand jobs is not a moral fact about markets; it is a statement that the market had priced a worse outcome than restructuring.
7. THE PRIMER: WHY THE FIRST PAYROLL PRINT IS THE LEAST RELIABLE NUMBER IN MACRO
This morning the Bureau of Labor Statistics changed the sign on a month. July went from minus 23,000 to plus 21,000. Markets moved on that original number; this desk quoted it four times; every commentator in the country built a narrative on it. It was wrong by 44,000, which is nearly twice the size of the figure itself. That is not a scandal. It is how the series works, and understanding why will make you a better reader of every jobs Friday for the rest of your life.
Where the number comes from
The headline payroll figure is produced by the Current Employment Statistics survey — the establishment survey — which asks a large sample of businesses and government agencies how many people were on their payroll during the pay period including the 12th of the month. It is a survey with a deadline, and the deadline arrives before all the responses do.
That is the entire mechanism behind the first revision. The initial estimate is published with a response rate substantially below the final one. Firms that report late are not a random subset — smaller firms and firms in distress report later — so the late arrivals systematically change the answer. The second and third estimates incorporate them. This is why every month is published three times before it settles.
The three layers of revision
One: the two monthly revisions. Each month's figure is revised in each of the following two reports as more survey responses arrive. This is what happened to June and July this morning.
Two: the annual seasonal recalculation. The BLS re-estimates its seasonal adjustment factors annually, which can change historical months without a single new survey response arriving. August is a notoriously difficult month to seasonally adjust because of school calendars — which is directly relevant to a report in which local government education added 42,000.
Three: the annual benchmark. Once a year the entire series is re-anchored to the Quarterly Census of Employment and Wages, which is not a survey at all but a near-universal count derived from unemployment insurance tax records covering roughly 95% of jobs. The benchmark revision has in recent years run to hundreds of thousands of jobs. It is the closest thing to truth the system produces, and it arrives more than a year late.
THE BIRTH-DEATH MODEL, AND WHY IT FAILS AT TURNING POINTS
The survey cannot sample firms that do not yet exist, and firms that have died stop responding — which would bias the count if left alone. So the BLS adds a modelled estimate of net jobs created by business births minus business deaths. The model is estimated from history, which means it works well when the economy behaves as it recently has and badly precisely when it does not. At turning points it systematically overstates job growth going into a downturn — the model keeps adding jobs from firms that have just failed — and understates it coming out. This is the single largest known source of first-print error and it is not a secret: the BLS publishes the adjustment every month. It is simply never mentioned on television.
What to do with all this
First: never build a thesis on one print. A single month's figure has a confidence interval around it of roughly plus or minus 130,000 at the 90% level. That is the BLS's own published standard, and it means a reported 55,000 and a reported 162,000 are not statistically distinguishable from one another, let alone from zero. Almost every jobs-Friday narrative in existence is describing sampling noise.
Second: read the three-month average, not the month. June, July and August now stand at +31,000, +21,000 and +162,000 — an average of about 71,000. That number is far more informative than any of its components and it will itself be revised.
Third: watch the revision direction as its own signal. Persistent downward revisions over several months are a well-documented feature of economies entering recession, because the birth-death model is adding jobs that no longer exist. Persistent upward revisions — which is what we have just had, twice — point the other way.
Fourth: prefer the household survey for turning points and the establishment survey for levels. The unemployment rate comes from a different survey of 60,000 households, is not subject to the birth-death model, and is not revised monthly. It is noisier month to month and far more stable across revisions — which is why "unchanged at 4.1%" may be the most reliable sentence in this morning's release.
THE UNCOMFORTABLE GENERAL LESSON
We spent four days this week reasoning carefully from a number that had a sign error in it. The reasoning was sound; the input was provisional and we did not label it so. There is no clever technique that would have prevented this — the revised figure did not exist yet — but there is a discipline that reduces the damage, which is to state explicitly, every time, which of your inputs are provisional and how large the revision to each has historically been. An analyst who says "July was minus 23,000" is making a claim. An analyst who says "July's first print was minus 23,000, and first prints of this series are revised by an average of several tens of thousands" is making a much weaker claim, and a much more defensible one. From today this brief will label first prints as first prints.
8. ANALYST CALLS DRIVING ACTION
Fed Governor Christopher Waller indicated he would support holding rates steady this month barring surprises in upcoming inflation data, and said his bias into the September meeting will be determined by the August CPI report. Kyle Rodda, Capital.com, on the effect: Waller's comments plus a falling dollar on a surging yen "sparked a recovery on Wall Street" and pushed hike pricing back to roughly 50%. Rodda had also framed this morning's report in advance, noting that a stronger-than-expected number "could remove an obstacle for the central bank to lift rates." It was stronger than expected by a factor of three.
Separately: Michael Burry is reported to have added to positions in Nvidia, Micron and Palantir — a notable reversal for an investor whose short positioning this desk covered on 14 August. We have not seen the filing.
9. STOCKS TO WATCH
THE INFORMATION-SECTOR PUZZLE
The 8,000 jobs lost in computing infrastructure providers, data processing and web hosting deserve more attention than they will get. This is the industry category that most directly contains data centre operations, in a month when the Federal Reserve identified data centre demand as the driver of national growth. It is a small number and one month, and we are not going to over-read it. But it is a useful corrective to the assumption that the AI buildout creates broad employment. It creates construction jobs, electricians' jobs and enormous demand for power. The operating businesses themselves are, by design, extremely thin on labour.
AI-ENERGY AND PHYSICAL AI
With yields falling on Waller and now facing a strong payroll print, the discount-rate pressure on Constellation (CEG), Vistra (VST) and Talen (TLN) is the variable to watch into the FOMC. GE Vernova (GEV) continues to be the exception the others are measured against. On the physical-AI bench: Symbotic (SYM), Teradyne (TER), Serve Robotics (SERV), Cognex (CGNX).
ENERGY
Brent back to $95.04 from $99.38 takes some heat out of the complex. Note also reporting that Treasury Secretary Bessent is "doubling down on cheaper oil for a third time" — the same official simultaneously running the buyback programme intended to hold down long yields and the sanctions campaign against Iran. Those two objectives are not obviously compatible and it is worth watching which one gives.
10. GLOBAL MACRO SNAPSHOT
Market
Development
Detail
Note
United States
Payrolls +162,000
u-rate 4.1%
AHE +3.1% y/y
Germany
Volkswagen +6.1%
50,000 more job cuts
100,000 total planned
Japan
Yen surging
Dollar retreating
Helped Thursday's US rally
European Union
Joined US sanctions
'Operation Economic Outcast'
Bessent welcomed it
South Korea
Weighing military role
To help reopen Hormuz
Per CNBC
Volkswagen's announcement is the largest single corporate labour event of the week and it is happening in the country with Europe's biggest manufacturing base. One hundred thousand planned job reductions at one firm, attributed to tariffs, Chinese competition and technological change, in an 89-year-old company describing it as the most profound transformation in its history. American payrolls added 162,000 in the same month. The two facts belong in the same paragraph.
11. WEEK AHEAD PREVIEW
Today, 4:15 PM: H.15, giving Thursday's breakeven — the first reading after Brent's round trip to $99 and back.
Monday 7 September: Labor Day. US stock and bond markets closed.
Wednesday 9 September: the enlarged Treasury buyback operations begin, running to 4 November.
Mid-September: August CPI — which Waller has named as the report that will decide his vote. 15-16 September: FOMC.
WHAT WE ARE WATCHING, STATED IN ADVANCE
One. August CPI, and specifically services ex-shelter. ISM services prices paid at 72.6 with a twelve-month average at its highest since April 2023 is a leading indicator for exactly that component. If it confirms, Waller's condition for holding is not met.
Two. The thirty-year breakeven, which we left at 2.29% and which remains the cleanest read on whether the anchor holds. Yields fell on Thursday; we want to know whether inflation compensation fell with them or the real yield did all the work.
Three. Whether this payroll print survives its first revision on 2 October. Given what we have just written, we are not going to pretend to know, and we would encourage readers to treat 162,000 as a first print with a wide confidence interval rather than as a fact about the economy.
12. THE CLOSING THOUGHT
A month that was reported as the economy losing twenty-three thousand jobs turns out to have been the economy gaining twenty-one thousand. Between those two numbers sits a month of commentary, a repricing of the Federal Reserve's September meeting from sixty-seven per cent to the low thirties and back again, and four editions of this brief that quoted the wrong figure with a straight face. The correction arrived quietly, in the eleventh paragraph of a government press release, on a Friday morning before a long weekend, and by Tuesday almost nobody will remember that July was ever negative. There is a version of financial analysis that consists of reacting quickly and confidently to provisional numbers, and it is the version that fills most of the airtime. The alternative is slower, less quotable, and involves saying "first print" a lot. We are going to say "first print" a lot. Markets are closed Monday. Have a good long weekend.
THE BROOKSIDE BRIEF · COMPILED 9:15 AM ET, FRIDAY 4 SEPTEMBER 2026, BEFORE THE OPEN · CORRECTION AND RETRACTION OF FRAMING APPEAR AT THE HEAD OF THIS BRIEF · SOURCES: BUREAU OF LABOR STATISTICS, THE EMPLOYMENT SITUATION — AUGUST 2026, USDL-26-1435, RELEASED 8:30 AM ET 4 SEPTEMBER 2026, READ DIRECTLY — ALL PAYROLL, UNEMPLOYMENT, PARTICIPATION, EARNINGS, HOURS, SECTOR AND REVISION FIGURES; BLS JOLTS RELEASE USDL-26-1432, READ DIRECTLY (QUITS RATE); FEDERAL RESERVE H.15, RELEASED 2 SEPTEMBER 2026 (BREAKEVENS, COMPUTED BY THIS DESK); FEDERAL RESERVE BEIGE BOOK, SEPTEMBER 2026, AS REPORTED; INSTITUTE FOR SUPPLY MANAGEMENT AUGUST 2026 SERVICES REPORT VIA FXSTREET AND CNBC (HEADLINE 55.4, PRICES PAID 72.6); THESTREET (THURSDAY DIRECTION AND WALLER, PRE-MARKET MOVERS, OIL AND METALS QUOTES, BITCOIN, VOLKSWAGEN, EU SANCTIONS, VANCE REMARKS, RODDA COMMENTARY); ADP NATIONAL EMPLOYMENT REPORT FOR AUGUST 2026 AS REPORTED 2 SEPTEMBER · THIS BRIEF DOES NOT PRINT THURSDAY'S CLOSING INDEX LEVELS BECAUSE THEY WERE NOT VERIFIED BEFORE THE COMPILE DEADLINE; THE DIRECTION IS ESTABLISHED ACROSS SOURCES · CONSENSUS FOR AUGUST PAYROLLS IS REPORTED VARIOUSLY AS 50,000 AND 55,000; WE USE 55,000 AND NOTE THE RANGE · THE BURRY POSITION CHANGES ARE AS REPORTED; THIS DESK HAS NOT SEEN THE FILING · DISCLOSURE: THIS BRIEF IS RESEARCHED AND DRAFTED WITH THE ASSISTANCE OF AN AI SYSTEM BUILT BY ANTHROPIC, A COMPANY OPERATING IN THE SECTOR DISCUSSED ABOVE · NOTHING IN THIS BRIEF IS INVESTMENT ADVICE
MORNING EDITION · TUESDAY, SEPTEMBER 8, 2026 · SAUDI ENERGY SITES ATTACKED, BRENT $98.51 · THE 30-YEAR BREAKEVEN HELD AT 2.29% · CANADA TARIFFS BITE · CPI FRIDAY
Daily Markets Briefing
The Brookside Brief
Markets · Macro · The Day Ahead
1. THE MORNING SETUP
The conflict changed category overnight. Saudi Arabia's Ministry of Energy said that several energy sector facilities and installations in the southern region of the Kingdom, bordering Yemen, were targeted on Tuesday morning local time. Fires broke out at several locations and some operations have been temporarily halted, with specialised field teams containing the fires, securing the sites and assessing the damage, according to the official Saudi Press Agency.
For a fortnight this has been a fight about the Strait of Hormuz — about whether barrels can get out. This is an attack on whether barrels get produced at all, which is a different problem with a different set of remedies. Section 7 sets out why the distinction matters more than the headline price, and why it partly reverses an argument this desk made last Wednesday.
Brent is up 1.56% to $98.51 and WTI up 2.55% to $93.81. Separately, Iranian officials issued a fresh threat over an upgraded American ballistic missile, warning that Iran "will take action against any threat, even before it is carried out." And on a second front entirely, Canada's retaliatory tariffs on American goods took effect just after midnight, with Prime Minister Carney escalating after talks collapsed last month.
FRIDAY'S THREE TESTS, SCORED
Test One — August CPI, and services ex-shelter. Not yet: the release is this Friday, 11 September, at 8:30 AM. It is the report Governor Waller named as the one that will decide his vote. Test Two — the thirty-year breakeven, which we left at 2.29%.Answered, and the answer is good. H.15 through Thursday shows it at 2.29% on 1 September, 2.29% on 2 September and 2.29% on 3 September. It did not move while Brent went to $99.38. And Thursday's rally on Waller was entirely real: the nominal ten-year fell two basis points, the real ten-year fell three, and the breakeven actually rose one, to 2.35%. Yields fell because the market lowered its expected policy path, not because it lowered its inflation forecast.Test Three — whether the 162,000 payroll print survives revision. 2 October. Pending, and we are not guessing.
Fig. 1 — Breakeven inflation by tenor, computed from H.15.
2. MARKETS AT A GLANCE
FRIDAY'S CLOSE, 4 SEPTEMBER — YIELDS UP, STOCKS DOWN
Asset
Last
Change
% Chg
S&P 500
7,718.60
−0.38%
—
Nasdaq Composite
26,506.99
−0.29%
—
Dow Jones Industrial
53,414.25
−0.51%
−271.86 pts
2-year Treasury
~4.37%
higher
highest since Jan 2025
Stocks fell on a strong jobs report, which is the textbook "good news is bad news" response of a market that fears the central bank more than it fears the economy. Note that Thursday had been a large up day on Waller; Friday gave back a fraction of it.
TREASURY CONSTANT MATURITIES THROUGH THURSDAY, FROM H.15
Tenor
3 Sep
Change
Note
2-year
4.34%
−5 bp on Thu
from 4.39% Wed
5-year
4.52%
−2 bp
real 2.15%, breakeven 2.37%
10-year
4.77%
−2 bp
real 2.42%, breakeven 2.35%
30-year
5.25%
−2 bp
real 2.96%, breakeven 2.29%
Fed funds, effective
3.63%
unchanged
every day since 24 Aug
Friday's figures arrive in tonight's H.15 at 4:15; there was no release on Monday because the Board was closed for Labor Day. Reporting puts Friday's two-year at roughly 4.37%, its highest since January 2025, and we will confirm against the primary source tomorrow.
THIS MORNING, 8 SEPTEMBER, ROUGHLY 6:55 AM ET
Asset
Last
Change
% Chg
Brent crude
$98.51
+1.56%
on the Saudi attacks
WTI crude
$93.81
+2.55%
—
Sept hike probability
58.7%
as of 7 Sep
CME FedWatch, as reported
Fig. 2 — Brent through the escalation.
3. TOP STORIES
From Transit Risk to Production Risk
Note the geography. The facilities hit are in the southern region of the Kingdom, bordering Yemen — not on the Gulf coast where the great export terminals sit, and not in the Strait. That location strongly implies a different actor and a different vector from the mining and anti-ship missile campaign in Hormuz, and the reporting so far does not attribute it. We are not going to speculate about attribution. What we can say is that the target set has widened from ships to installations.
The market response is instructive in its restraint. Brent is up a percent and a half, to $98.51 — a smaller move than the four-point-six per cent it put on when two tankers were struck a week ago. Either the market judges the damage limited, or it has become desensitised, or it is waiting for the damage assessment the Saudi energy ministry says is under way. All three are possible and the honest answer this morning is that nobody knows which.
The Bond Market Kept Its Nerve
This is the most reassuring thing in today's brief and it comes from arithmetic on a government table. Over the three sessions spanning the tanker attacks, the acknowledgement of mining and Brent's run to $99.38, the thirty-year breakeven inflation rate sat at 2.29% on every single day. The five-year moved — from 2.31% to 2.37% — and the ten-year moved a little, from 2.31% to 2.35%. The long end did not move at all.
That is the market saying, with money, that it expects this oil shock to pass through the price level and then be over. It is the single strongest available piece of evidence that inflation expectations remain anchored, and it is worth holding onto precisely because it is so unglamorous — a number that did not change, three days running, in a table nobody reads.
AND THE WALLER RALLY WAS A REAL-RATE RALLY
Thursday is worth decomposing too, because it is the mirror image of the Tuesday move we described last week. On Thursday the nominal ten-year fell two basis points, from 4.79% to 4.77%. The real ten-year fell three, from 2.45% to 2.42%. The breakeven therefore rose one basis point. Yields fell entirely because the market marked down its expected path for the policy rate after Waller signalled a preference for holding — not because it marked down inflation. The two moves are easily confused on a screen and they mean opposite things. A rally driven by falling real yields on a dovish signal is a repricing of the Fed. A rally driven by falling breakevens would have been a repricing of inflation itself, and would have been far more bullish for long duration.
One Meeting, Eight Different Views
The September FOMC is eight days away and the market has held eight materially different opinions about it in five weeks. Sixty-seven per cent in early August. Forty-two after the 7 August payroll miss. Thirty by late August. Thirty-four the morning of the keynote. Fifty-seven by that afternoon. Sixty-six on 1 September. Fifty after Waller. Fifty-nine yesterday.
Fig. 3 — The September meeting, repriced.
Two observations. First, the 7 August collapse — the largest single move in the series — was driven by a payroll print that has since been revised from minus 23,000 to plus 21,000. A quarter of the range in that chart rests on a number that no longer exists. Second, a coin-flip eight days before a meeting, from a committee that has abolished forward guidance, is not a failure of the market. It is the design working as intended. Chair Warsh said he was "committed to a discipline, not to a decision"; a market that cannot predict the decision is the direct consequence.
Canada, and the Other Front
Canada's retaliatory tariffs on American goods took effect just after midnight Tuesday, after negotiations collapsed last month. This will get a fraction of the attention the Middle East gets and it touches far more American businesses directly. Canada is the United States' largest trading partner; a tariff war with it is an input-cost event for American manufacturers and an inflation event at the margin — arriving in the same week as a CPI report the Federal Reserve has said will decide a rate decision.
4. MACRO & FED WATCH
Everything now runs into Friday. August CPI lands at 8:30 on 11 September, four days before the FOMC convenes. Governor Waller has said explicitly that his bias into the meeting will be determined by it. The setup could hardly be tighter.
What we know going in. ISM services prices paid printed 72.6 in August, up 2.3 points, with a twelve-month average at its highest since April 2023. The Beige Book reported elevated input pressure in manufacturing and construction from energy, raw materials, transportation and petrochemicals. Average hourly earnings rose 3.1% over the year, which is not an inflationary wage number. And Brent has spent the entire month between $88 and $99.
WHAT TO ACTUALLY READ ON FRIDAY
Not the headline. Energy will be in it and everyone knows why. Not core either, on its own. The number that matters for this decision is core services excluding shelter — sometimes called supercore — because it is the component least affected by oil, least affected by the long lags in the shelter index, and most closely tied to wages and to the domestic demand a central bank can actually influence. If supercore is firm, the Fed has a domestically generated inflation problem and the oil story is a distraction. If supercore is soft, then whatever the headline does is a relative price change working through the index, and Warsh's own diffusion test — the share of components rising faster than 3% — should tell the same story. Shelter is roughly a third of core CPI and lags market rents by many months; treat it as history, not news.
5. ECONOMIC CALENDAR
Date
Time ET
Release
Note
TUE 8 Sep
4:15 PM
H.15
Friday's yields and breakevens
Wed 9 Sep
—
ENLARGED TREASURY BUYBACKS BEGIN
$4bn per operation to 4 Nov
Thu 10 Sep
8:30 AM
Initial jobless claims
206,000 prior
FRI 11 Sep
8:30 AM
AUGUST CPI
Waller has named it decisive
Tue-Wed 15-16 Sep
—
FOMC
~59% of a hike priced
Fri 2 Oct
8:30 AM
September employment situation
And the August revision
Wednesday is quietly important. The Treasury's enlarged buyback operations begin — at least $4 billion per operation of longer-dated debt, doubled from $2 billion, running through 4 November, in what Secretary Bessent called a "Treasury Twist." It is the fiscal authority attempting to hold down the long end in the same week the monetary authority may raise the short end. Watch whether the thirty-year responds.
6. EARNINGS WATCH
A thin week after last week's AI cluster. The scorecard from that cluster is worth carrying forward: five companies beat consensus and two of them went up. Dell rose on a $25 billion guidance raise and a five-point operating margin expansion; Snowflake rose 24% on 37% product revenue growth. MongoDB fell 12% on cautious guidance, Hewlett Packard Enterprise fell 5% despite raising twice, and Broadcom fell on reports Google has engaged Marvell for chip design. The market is paying for acceleration and selling everything else, however good.
7. THE PRIMER: TRANSIT RISK, PRODUCTION RISK, AND WHY IT CHANGES THE ANSWER
Last Wednesday this desk argued that the Strategic Petroleum Reserve was the wrong instrument for this crisis. The argument was that the durable change in the oil market was a ten-fold increase in the cost of moving a barrel out of the Gulf, and that releasing crude onto the Texas Gulf Coast does nothing about freight and insurance between Ras Tanura and Yokohama. We stand by that as far as it went. This morning's news is why it did not go far enough.
Two different shocks that look identical on a price screen
A transit shock means the barrels exist, are produced, and cannot cheaply reach the buyer. Mines in a strait, war-risk premiums at ten per cent of hull value, tankers rerouting round the Cape. The global quantity of oil is unchanged; what has risen is the wedge between where it is and where it is wanted.
A production shock means the barrels stop existing. A processing facility burns, a field is shut in, a stabilisation train goes offline. The physical quantity available to the world falls.
On a Brent screen these look the same — the price goes up. In every other respect they are opposites, and the policy responses that work for one are close to useless for the other.
Why the distinction determines what helps
SPARE CAPACITY IS THE ANSWER TO ONE AND NOT THE OTHER
The world holds a buffer against production shocks: OPEC spare capacity, the great majority of it Saudi, defined as production that can be brought online within about thirty days and sustained. When a field goes down somewhere, the buffer is opened and the barrels are replaced. This is why individual production outages have historically had short price half-lives. But spare capacity is useless against a transit shock — producing more barrels behind a blocked chokepoint does not help anyone — and it is worse than useless if the facilities that hold the spare capacity are themselves the target. That is the specific reason this morning's news is a category change rather than an increment: it raises the possibility of damage to the buffer that protects against all the other scenarios. We have no information on whether any spare capacity has in fact been affected, and the Saudi statement says only that some operations were halted and damage is being assessed.
The reciprocal point is the one that revises our own argument. The SPR is a quantity instrument. Against a transit shock it is close to the wrong tool, for the reasons we set out last week. Against a production shock it is exactly the right tool — that is what it was built for in 1975, and what it was used for after Abqaiq in 2019, after Hurricane Katrina, and during the Libyan civil war. If the world loses barrels at source, a reserve of physical crude is precisely the correct answer.
Which is why the arithmetic from last Wednesday now cuts the other way. The reserve stood at 289.7 million barrels in the week ending 21 August, the lowest since November 1982, after roughly 122 million barrels were delivered against a 172 million barrel authorisation — spent fighting a transit problem it was poorly suited to solve. If the problem is now becoming a production problem, the tool that would work has been substantially depleted addressing the problem for which it did not.
We want to be careful not to overclaim. The releases were also a response to genuine domestic supply tightness and to an IEA collective action, and hindsight is cheap. The point is not that the decision was wrong at the time. It is that reserves are optionality, optionality has a price, and spending it early is a real cost that shows up only when the second shock arrives.
Three things that are not fungible
Crude grade. A barrel is not a barrel. Saudi Arab Light is a medium sour crude; much of the SPR is sour; American shale is light and sweet. Refineries are configured for particular slates and cannot costlessly switch. Replacing a lost sour barrel with a light sweet one does not fully replace it, which is why grade differentials widen in production outages and why the headline benchmark understates the disruption to specific refiners.
Location. Discussed last week and still true: an SPR barrel on the Gulf Coast is not a substitute for a Gulf barrel delivered to Asia when the freight wedge is $6 to $12.
Time. Spare capacity takes about thirty days. SPR deliveries take roughly two weeks from authorisation to first cargo, and the drawdown rate falls as caverns empty. Neither is a same-day instrument, which is why the price moves first and the physical response arrives later — and why the initial price spike almost always overshoots what the eventual physical outcome justifies.
What to watch instead of Brent
The damage assessment the Saudi energy ministry says is under way — specifically whether any processing or stabilisation capacity is affected rather than only storage or distribution. Official Saudi Selling Prices for October loading, which tell you what the producer thinks about its own availability. The Brent-Dubai spread, which widens when sour crude specifically is short. And whether the IEA convenes. A second collective action would confirm that member governments regard this as a production event, and would tell you more than any price move.
8. ANALYST CALLS DRIVING ACTION
Kyle Rodda, Capital.com: Middle East tensions and rate uncertainty "continue to cast a shadow over the markets, especially heading into crucial price data out of the States late in the week." On oil: "The inflation picture is becoming murkier because of the rally in oil prices... The military activity is maintaining a significant risk premium in energy markets amidst the heightened possibility of deeper and more protracted disruptions to global supply."
Also on the wires and worth flagging without endorsement: reporting that the Energy Secretary's comments have tested Treasury Secretary Bessent's repeated forecast of cheaper oil, and a BofA note staying bullish on Oracle with the stock down 25%. We have seen neither in full.
9. STOCKS TO WATCH
ENERGY, AND THE GRADE QUESTION
Attacks on Saudi facilities are read differently by different parts of the energy complex. Producers of light sweet crude — most American shale operators — benefit from the price without being exposed to the risk. Refiners configured for sour crude are the ones with a problem, because their feedstock is what is threatened and their product prices lag their input costs. Complex refiners with heavy-sour capability have historically been the winners in exactly this scenario, and simple refiners the losers.
AI-ENERGY
The FOMC on 15-16 September is the single variable for Constellation (CEG), Vistra (VST) and Talen (TLN) over the next fortnight — long-duration contracted cash flows do not care much about a 162,000 payroll print but care enormously about the discount rate. GE Vernova (GEV) remains the exception. On the physical-AI bench: Symbotic (SYM), Teradyne (TER), Serve Robotics (SERV), Cognex (CGNX).
INDUSTRIALS, AND CANADA
Canadian retaliatory tariffs taking effect this morning are an input-cost event for American manufacturers with cross-border supply chains — automotive, machinery, building products and food processing above all. It is the least glamorous story on the page and it will touch more corporate income statements than the Strait of Hormuz will.
10. GLOBAL MACRO SNAPSHOT
Market
Development
Detail
Note
Saudi Arabia
Energy sites attacked
Southern region
Some operations halted; damage being assessed
Iran
Fresh threat issued
Over US missile upgrade
'Action against any threat, even before it is carried out'
Canada
Retaliatory tariffs live
From just after midnight
Talks collapsed last month
United States
Shortened week
Labor Day Monday
CPI Friday, FOMC next week
Three separate escalations in three separate theatres, in one morning, eight days before a central bank meeting that is priced as a coin flip. It is worth noting how little the equity market is doing about it: futures were mixed, not down. Either that is complacency or it is a correct judgement that none of these is yet large enough to change the earnings path. We are not going to pretend to know which, but we would observe that the bond market — which has been the better-informed of the two all fortnight — has kept its long-run inflation expectation pinned at 2.29%.
11. WEEK AHEAD PREVIEW
Today, 4:15 PM: H.15, with Friday's yields and the first breakeven reading after the payroll print.
Wednesday: the enlarged Treasury buyback operations begin.
Thursday, 8:30: jobless claims.
Friday, 8:30: AUGUST CPI — the report Waller named as decisive, four days before the FOMC.
15-16 September: FOMC. Roughly 59% of a quarter-point hike priced, and no forward guidance to help.
WHAT WE ARE WATCHING, STATED IN ADVANCE
One. Core services excluding shelter in Friday's CPI. That single component, not the headline and not core, is what determines whether the Fed has a domestic inflation problem or an imported one.
Two. The thirty-year breakeven, which has now held 2.29% through a tanker campaign, an acknowledged mining and a run to $99 crude. If an attack on Saudi production dislodges it where Hormuz did not, that is the market saying this shock is different in kind — and it would be the most important signal of the month.
Three. Whether the IEA convenes on the Saudi attacks. A second coordinated release would tell us member governments have reclassified this as a production event, and would raise a harder question about what is left in the reserve to release.
12. THE CLOSING THOUGHT
For two weeks the question has been whether oil could get out of the Gulf. This morning the question became whether it gets produced. Those sound like the same worry and they are not: one is solved by ships and insurance and time, the other by spare capacity and strategic reserves — and the strategic reserve has just been spent, down to its lowest level since 1982, fighting the first problem. There is a general shape to this that is worth noticing, because it recurs everywhere. Optionality is cheapest to buy when you do not need it and impossible to buy when you do. A reserve held is a reserve that costs you nothing visible; a reserve spent is a decision that looks free until the second shock arrives, and then does not. Against that, the one genuinely encouraging fact of the past week: through mines, missiles, ninety-nine dollar crude and a jobs print that tripled expectations, the market's expectation of inflation thirty years from now has not moved by a single basis point. Somebody, somewhere, still believes this ends. Have a good Tuesday.
THE BROOKSIDE BRIEF · COMPILED 9:45 AM ET, TUESDAY 8 SEPTEMBER 2026, SHORTLY AFTER THE OPEN · SOURCES: FEDERAL RESERVE H.15 SELECTED INTEREST RATES, RELEASED 4 SEPTEMBER 2026, READ DIRECTLY — ALL NOMINAL AND INFLATION-INDEXED YIELDS AND THE EFFECTIVE FUNDS RATE; ALL BREAKEVEN FIGURES ARE THE ARITHMETIC DIFFERENCE AND ARE COMPUTED BY THIS DESK, NOT A PUBLISHED BOARD SERIES; BUREAU OF LABOR STATISTICS, THE EMPLOYMENT SITUATION — AUGUST 2026, USDL-26-1435, READ DIRECTLY; BLS RELEASE SCHEDULE (AUGUST CPI, 11 SEPTEMBER); SAUDI PRESS AGENCY QUOTING THE MINISTRY OF ENERGY, VIA OILPRICE.COM AND THESTREET (ATTACKS ON SOUTHERN-REGION ENERGY FACILITIES); THESTREET (TUESDAY OIL QUOTES, CANADA TARIFFS, RODDA COMMENTARY, FRIDAY DIRECTION); THE INDEPENDENT VIA THESTREET (IRANIAN STATEMENT); CNBC (FRIDAY CLOSE AND THE TWO-YEAR AT ITS HIGHEST SINCE JANUARY 2025); CME FEDWATCH AS REPORTED (58.7% ON 7 SEPTEMBER); INSTITUTE FOR SUPPLY MANAGEMENT AUGUST 2026 SERVICES REPORT AS REPORTED (PRICES PAID 72.6) · NO ATTRIBUTION FOR THE ATTACKS ON SAUDI FACILITIES IS ASSERTED IN THIS BRIEF; THE SAUDI STATEMENT DOES NOT NAME A PERPETRATOR AND NEITHER DO WE · THIS DESK HAS NO INFORMATION ON WHETHER SAUDI SPARE PRODUCTION CAPACITY HAS BEEN AFFECTED; SECTION 7 DISCUSSES THE CATEGORY OF RISK, NOT A CONFIRMED OUTAGE · SPR FIGURES ARE AS PUBLISHED IN THIS BRIEF ON 2 SEPTEMBER AND DERIVE FROM SECONDARY SUMMARIES OF EIA WEEKLY DATA · DISCLOSURE: THIS BRIEF IS RESEARCHED AND DRAFTED WITH THE ASSISTANCE OF AN AI SYSTEM BUILT BY ANTHROPIC, A COMPANY OPERATING IN THE SECTOR DISCUSSED ABOVE · NOTHING IN THIS BRIEF IS INVESTMENT ADVICE
MORNING EDITION · FRIDAY, SEPTEMBER 11, 2026 · AUGUST CPI AT 8:30 · FOUR DOWN DAYS · 52-WEEK HIGHS ACROSS THE ENTIRE CURVE · BRENT ABOVE $105 · FOMC TUESDAY
Daily Markets Briefing
The Brookside Brief
Markets · Macro · The Day Ahead
— A NOTE ON TIMING
This brief was compiled before 8:30 this morning and therefore before the August Consumer Price Index was published. We are not going to print a number we have not read. What follows is everything that can be known in advance: what the report has to clear, what the Federal Reserve has said it will do at each outcome, why the threshold in question is smaller than the statistical precision of the instrument, and how to read the release when it lands. The figure itself is at bls.gov/cpi at 8:30 sharp. Section 7 is the guide to reading it.
1. THE MORNING SETUP
Four consecutive down days, a Treasury curve at fifty-two week highs at every single tenor, Brent above $105, and a Federal Reserve meeting on Tuesday that the market cannot call. Into that, at half past eight this morning, lands the August Consumer Price Index — the report Governor Christopher Waller named publicly as the one that will determine his vote.
The condition he set is unusually explicit, and unusually narrow. As reported by TheStreet, Waller said he would vote to hold if core CPI comes in at 0.2% for August, and would support a hike if it comes in higher. The Dow Jones consensus for the headline is +0.4% on the month and 3.4% over twelve months.
And here we have to stop and flag something, because it matters enormously and we cannot resolve it. TheStreet reports that economists expect core prices to have risen 0.2% in August — precisely Waller's hold threshold. Kiplinger's preview puts the core consensus at 0.4% on the month and 2.4% over the year. Those are not the same forecast, and the gap between them is the entire decision.We have not been able to reconcile the two and are not going to pick whichever makes the tidier story. If the true consensus is 0.2%, the market's near-70% hike pricing looks high. If it is 0.4%, the hike is close to already decided and the bond market has been reading it correctly all week. Treat the expected core number as genuinely uncertain until the print settles it.
A DECISION RESTING ON LESS THAN THE MEASUREMENT ERROR
Here is a fact from the BLS's own technical note that almost nobody will mention today. The estimated standard error of the one-month percent change in the all-items CPI is 0.04 percent. The Bureau spells out the implication itself: for a reported one-month change of 0.2 percent, "we are 95 percent confident that the actual percent change based on all retail prices would fall between 0.12 and 0.28 percent." In other words a printed 0.2% and a printed 0.3% are not statistically distinguishable from one another. A quarter-point move in the policy rate of the world's reserve currency is about to turn on a difference the issuing agency says it cannot reliably measure. That is not a criticism of the Bureau, which is admirably transparent about it. It is an observation about what happens when a reaction function is specified more precisely than the data can support.
2. MARKETS AT A GLANCE
THURSDAY'S CLOSE, 10 SEPTEMBER — A FOURTH STRAIGHT DECLINE
Asset
Last
Change
% Chg
S&P 500
7,591.79
−0.58%
4th down day
Dow Jones Industrial
52,064.46
−0.60%
—
Nasdaq Composite
26,081.73
−0.65%
—
Russell 2000
2,891.49
−1.02%
worst for a 3rd day
VIX
17.89
+8.69%
stressed, not alarmed
Technology and materials both fell over a per cent. Only two S&P sectors advanced: communication services and consumer staples — which is a defensive tape, not a rotation.
THURSDAY'S TREASURY MOVE — 52-WEEK HIGHS ACROSS THE CURVE
Tenor
Thursday
Change
Note
2-year
4.567%
+14.0 bp
52-week high
5-year
4.747%
+13.4 bp
52-week high
10-year
4.954%
+11.4 bp
52-week high
30-year
5.367%
+8.1 bp
52-week high
Fig. 2 — Thursday's move by tenor.
ENERGY AND THE WEEK
Asset
Last
Change
% Chg
Brent crude
~$106.11
−1.41%
after passing $108 Thursday
WTI crude
above $100
—
+4.2% Thursday to $100.10
Brent, 8 Sep
$98.51
—
start of the week
Gold futures
$4,427.40
−0.75%
Thursday morning
3. TOP STORIES
What the Week Did
Since Tuesday's brief the market has repriced the September meeting from a coin-flip to something close to a near-certainty, and it has done so on energy rather than on any domestic data. CME FedWatch odds of a hike reached nearly 70% on Thursday. Brent went from $98.51 on Tuesday morning to above $108 on Thursday. And the entire Treasury curve set fifty-two week highs in a single session.
August PPI, released Thursday, was the proximate trigger. Wholesale prices rose 0.4% on the month, matching consensus — but the annual rate jumped to 5.4% from 4.8% in July, slightly above expectations. A five-and-a-half per cent producer price rate is the sort of number that makes a central bank with a stated price focus uncomfortable regardless of what it thinks about oil.
TheStreet Pro's James DePorre put the position sharply: "The recent poor bond action is the market pricing in a rate increase that Fed Chair Warsh has never promised. Warsh will have to deliver the hike or provide an explanation for why it is not needed at this time." He quoted a former senior Fed economist calling it the market double-dog daring the new chair. That is exactly the corner a policymaker who abolished forward guidance can find himself in: having refused to tell the market what he will do, he now has to either validate what it has assumed or explain himself after the fact.
The Saudi Attacks: A Refinery, Not a Wellhead
We flagged on Tuesday that the conflict had changed category from transit risk to production risk. The detail that has emerged since requires a refinement, and it cuts against the alarm rather than for it. The facility struck was the Jazan refinery — a roughly 400,000 barrel-a-day refinery — together with the Jazan bulk plant, in attacks Yemen's Houthis have claimed. Reporting indicates at least 73 people were wounded.
A refinery is not a wellhead. Destroying refining capacity removes refined products — diesel, gasoline, jet — from the market. It does not remove crude; if anything it reduces demand for crude at the margin. And Aramco's chief executive Amin Nasser has said the recent attacks caused some production interruptions but had "no material operational or financial impact." Aramco has separately said its spare capacity allows it to bypass Hormuz disruption without cutting production or exports.
So why is crude at $106? Because the market is not pricing the Jazan barrels. It is pricing the demonstrated capability to hit Saudi energy infrastructure at all, and the possibility that the next target is upstream. For scale: the 2019 attacks on Abqaiq and Khurais took out 5.7 million barrels a day, roughly five per cent of global supply. That is the event the current price is insuring against, not the one that has happened.
We would also flag, and decline to print, a widely circulating claim that Saudi output has fallen to a 1990 low. We could not verify it, and it sits badly against Aramco's own public statement. If it is true it is the most important fact in the market and we will lead with it once somebody shows the number. Until then it is a headline, not a datum.
The Anchor, Through Tuesday
Through Tuesday 8 September — the last day for which the Federal Reserve has published inflation-indexed yields — the thirty-year breakeven was 2.29%. It was 2.29% on 1 September, 2.29% on the 2nd, 2.29% on the 3rd, 2.28% on the 4th and 2.29% on the 8th. Over the same fortnight the five-year breakeven rose from 2.30% to 2.40% and the ten-year from 2.31% to 2.37%.
Fig. 3 — Breakeven inflation by tenor, computed from H.15.
That shape — near end rising ten basis points, far end rising three — remains the single most reassuring thing in this market. It says the bond market reads the oil shock as something that raises prices for a few years and then stops.The critical caveat: this data stops on Tuesday. Wednesday and Thursday saw the largest nominal moves of the episode, and we do not yet know whether they were real yields or breakevens. The Board publishes Wednesday's figures this afternoon and Thursday's on Monday. If the thirty-year breakeven has broken 2.30% in those two sessions, everything in this paragraph changes.
The Fiscal Announcement Nobody Priced
On Wednesday the President proposed sending $5,000 to every American adult if Republicans retain the House and Senate in November — a "Trump Dividend" announced at the party's midterm convention in Dallas. Reuters estimates the cost at about $1.35 trillion. The Vice President later suggested wealthier Americans might be excluded and that tariff revenue could fund it, though the cost would far exceed tariff receipts to date, and the proposal would require congressional approval.
Set aside the politics. A $1.35 trillion transfer proposal, announced in the same week the thirty-year Treasury set a fifty-two week high and the Treasury began enlarged buybacks to hold the long end down, is a term-premium event. It is also a demand-side inflation proposal arriving during a supply-side inflation shock, which is the least helpful possible combination. We note it is a campaign proposal, not legislation, and the market has plainly not priced it. Whether that is because it is judged unlikely or because nobody has done the arithmetic is unclear.
4. MACRO & FED WATCH
The European Central Bank raised its deposit rate 25 basis points to 2.5% on Thursday, a move markets had fully priced, with Iran-driven energy costs clouding its outlook. It is now the first major central bank to tighten in response to this oil shock, which puts a marker down for Tuesday.
Clark Bellin of Bellwether Wealth made the dovish case: "If we see a relatively benign CPI report on Friday, the Fed may take a pause on rates this time around and allow more time to pass." He added a point this desk has been making since Monday: "The Federal Reserve can now focus more intently on inflation, now that it's clear that the labor market has been stronger than previously expected thanks to upward revisions in the recent jobs data." The July revision from minus 23,000 to plus 21,000 removed the last argument for pre-emptive caution.
Fig. 1 — The 2026 CPI path, from the BLS release.
What Figure 1 shows is the case for calm. Core CPI has not printed above 0.4% in any month this year and has averaged close to 0.2%. The violence in the headline is energy: March at +0.9% on a 21% jump in gasoline, then June at −0.4% as it unwound. July's headline was +0.1% with core at +0.2%, and the twelve-month rates were 3.4% and 2.5% respectively. The question this morning is whether August is another energy month with a quiet core, or the month the oil price started showing up in things that are not oil.
5. ECONOMIC CALENDAR
Date
Time ET
Release
Note
FRI 11 Sep
8:30 AM
AUGUST CPI
Consensus +0.4% headline, +0.2% core
FRI 11 Sep
4:15 PM
H.15
Wednesday's breakevens
Mon 14 Sep
4:15 PM
H.15
Thursday and Friday
TUE-WED 15-16 Sep
—
FOMC
~70% of a hike priced Thursday
Wed 16 Sep
2:00 PM
Decision, and no dot plot
No forward guidance by policy
Fri 2 Oct
8:30 AM
September payrolls
And the August revision
Note what is not on that list: a press conference the market can use to calibrate the next meeting. Chair Warsh eliminated forward guidance at his first meeting and cut the statement to 132 words. Whatever happens Wednesday, the market will get the decision and very little else — which is precisely why it has spent five weeks oscillating between thirty and seventy per cent.
6. EARNINGS WATCH
Adobe reported Thursday after the close: record revenue of $6.76 billion, up 13%, and non-GAAP earnings of $6.13 a share, up 15% — both ahead of expectations. The shares fell 2.14% in after-hours trade to $243.50. The company also announced a chief executive transition. The stated concerns were freemium monetisation timing and near-term growth momentum, which is another entry in this autumn's consistent pattern: a beat without an acceleration is being treated as a miss.
Oracle also reported Thursday; options had implied a move of more than ten per cent on a company with a $451 billion market value, roughly $48 billion at stake, with the stock already down 21.3% year to date. We do not have verified post-release figures at this hour and are not going to characterise the result from the setup.
Elsewhere Thursday: Cooper Companies fell around 14-18% on a disappointing strategic review, cut guidance and downgrades; Freeport-McMoRan fell 7.3% and Southern Copper 7.1% as copper retreated from record highs; Intel fell 5.7% on profit-taking after a multi-session rally. Macy's beat and raised — with $116 million of tariff refunds contributing 23 cents to the quarter — and still fell.
7. THE PRIMER: HOW TO READ A CPI REPORT
In about half an hour a number will be published that may determine whether the Federal Reserve raises interest rates on Wednesday. Most of the commentary you will read about it today will be wrong in predictable ways. Here is how the thing is actually built.
Where the number comes from
Prices are collected each month in 75 urban areas from about 6,000 housing units and roughly 22,000 retail establishments — shops, supermarkets, hospitals and service businesses — by personal visit, telephone, web and app. Fuel prices are collected monthly everywhere; most other goods and services are collected monthly in the three largest metropolitan areas and every other month elsewhere. The resulting price changes are weighted by their importance in household spending and aggregated to a national average.
The CPI-U covers over 90% of the American population. It excludes rural non-metropolitan households, farm families, the armed forces and people in institutions. It is not, and does not claim to be, the cost of living of any actual individual.
The four numbers, and which one matters
Headline, month on month. The all-items index, seasonally adjusted. It contains energy and food, which is why it will be large today. It is the least informative figure for policy and the one that will lead every broadcast.
Headline, year on year. Useful for households, nearly useless for a central bank at a turning point, because eleven of the twelve months in it have already happened and cannot be influenced by Wednesday's decision.
Core, month on month — all items less food and energy. This is the number Waller has tied his vote to. The exclusion is not because food and energy do not matter to people; it is because they are volatile and supply-driven, and a central bank raising rates cannot make a refinery reopen.
Core services excluding shelter. The one we told readers on Tuesday to look for. It strips out energy, the goods cycle, and the shelter index — and what remains is the part of inflation most closely tied to domestic wages and demand. If that is firm today, the Fed has a problem it can actually address. If it is soft, then whatever the headline does is a relative price change passing through the index.
WHY SHELTER IS A REAR-VIEW MIRROR
Shelter is roughly a third of core CPI and it accounted for about two-thirds of July's entire monthly increase. It is also the most backward-looking component in the index. The Bureau surveys each housing unit roughly every six months and measures the rent actually being paid, across the whole stock of rented and owner-occupied housing — not the rent on new leases. Since most tenants are part-way through a lease, the index reflects market rents agreed a year or more ago. Owners' equivalent rent, which imputes what homeowners would pay to rent their own homes, is slower still. Practical consequence: a shelter print today is telling you about the rental market of late 2025. It is history dressed as news, and it is why a shelter-driven core number should be discounted and a services-driven one should not.
Three traps
One: seasonal adjustment is an estimate, not a fact. The factors are recomputed every February using the X-13ARIMA-SEATS method and applied to revise the previous five years. For 2026, 36 of the 81 components of the all-items index are not seasonally adjusted at all. And the Bureau uses intervention analysis on 57 series this year — including food, motor fuels and vehicles — to stop extreme moves distorting the seasonal pattern. Reasonable people can produce different seasonally adjusted numbers from identical raw data.
Two: the sampling error is larger than the decision threshold. As above: the one-month standard error is 0.04%, so the 95% confidence interval around a 0.2% print runs from 0.12% to 0.28%. Anybody who tells you today that core came in "hot" because it printed 0.3% rather than 0.2% is describing a difference the Bureau itself says it cannot resolve.
Three: CPI is not the Fed's target. The Federal Reserve targets PCE inflation, which uses different weights — notably a much smaller shelter share and a much larger healthcare share — and which has historically run a few tenths below CPI. A 3.4% CPI does not mean the Fed is 1.4 points above target. The August PCE report arrives at the end of the month, after Wednesday's decision.
What to do at 8:30
THE ORDER TO READ IT IN
First, core month-on-month, to one decimal. That is Waller's stated trigger and the only number that mechanically matters for Wednesday. Second, services less energy services, which the release reports directly in Table A — July was +0.2% on the month and +3.0% over the year. Third, shelter, so you can work out how much of core was the rear-view mirror. Fourth, energy — to confirm the headline is what everyone assumes it is. And only then the headline itself. The whole report is free, published at bls.gov/cpi, and takes about four minutes to read properly. That is a materially better use of four minutes than any commentary about it, including ours.
8. ANALYST CALLS DRIVING ACTION
James DePorre, TheStreet Pro: the bond market is "double-dog daring" Warsh; "a difference of a single tenth of a percentage point could be enough to trigger a rate hike." On the hawkish case: "A war that has kept oil elevated for six months, new tariffs, and a massive AI buildout will keep inflation pressures bubbling up."Clark Bellin, Bellwether Wealth: a benign CPI may buy a pause; the labour revisions free the Fed to focus on prices. Kyle Rodda, Capital.com: PPI then CPI "could be the make-or-break factor between a US Federal Reserve that keeps rates unchanged next week and one that hikes them."
9. STOCKS TO WATCH
RATE-SENSITIVES INTO WEDNESDAY
The Russell 2000 has been the worst-performing major index for three consecutive sessions and fell 1.02% on Thursday. That is the cleanest expression of what a curve at fifty-two week highs does to companies that borrow at floating rates and refinance often. It is also why Constellation (CEG), Vistra (VST) and Talen (TLN) remain hostage to Wednesday rather than to their demand story — a story the Federal Reserve's own Beige Book confirmed nine days ago. GE Vernova (GEV) continues to be the exception.
ENERGY AND MATERIALS
Refiners are the nuanced trade here, not producers: an attack on a 400,000 barrel-a-day refinery is bullish refining margins outside the Gulf and bearish nothing in particular for crude. Against that, copper fell hard on Thursday — Freeport −7.3%, Southern Copper −7.1% — off record highs. Industrial metals selling off while energy rallies is a growth signal, and not a good one.
PHYSICAL AI
Symbotic (SYM), Teradyne (TER), Serve Robotics (SERV), Cognex (CGNX). Note Intel fell 5.7% on Thursday in a semiconductor selloff that TheStreet attributed directly to rising ten-year yields and surging oil — a reminder that at 4.95% the long bond starts to matter to growth equities in a way it did not at 4.2%.
10. GLOBAL MACRO SNAPSHOT
Market
Development
Detail
Note
Euro area
ECB +25 bp to 2.5%
First major CB to tighten
Energy clouding outlook
Saudi Arabia
Jazan refinery struck
~400,000 bpd; 73 wounded
Aramco: no material impact
Jordan
US aircraft damaged
One A-10 lost a wing
~8 F-15s light damage, back in service
United States
Existing home sales −2%
3.98m SAAR, lowest since Jun 2025
4.9 months supply, decade high
Canada
Retaliatory tariffs live
From Tuesday
Largest US trading partner
The housing number deserves more than a line. Existing home sales fell 2% in August to a 3.98 million annual pace, the lowest since June 2025, with inventory at 4.9 months — the highest in more than a decade. The median price still rose 1.6% to $429,100. That is a market where supply is building, volumes are at multi-year lows and prices have not yet adjusted, which is what happens when mortgage rates track a ten-year Treasury that just touched 4.95%. If the Fed hikes on Wednesday, this is the channel through which it will be felt first.
11. WEEK AHEAD PREVIEW
Today, 8:30: August CPI. Core month-on-month is the number.
Today, 4:15 PM: H.15 with Wednesday's inflation-indexed yields — the first look at whether this week's selloff was real or breakeven.
Monday: H.15 catches up on Thursday and Friday.
Tuesday and Wednesday: FOMC. Decision at 2:00 PM Wednesday. No dot plot, no forward guidance.
WHAT WE ARE WATCHING, STATED IN ADVANCE
One. Core services excluding shelter in this morning's release. Firm means a domestic inflation problem and a hike; soft means an imported one and a genuine case for waiting.
Two. The thirty-year breakeven for Wednesday and Thursday, published this afternoon and Monday. It has held between 2.26% and 2.29% for a fortnight through everything the Middle East has thrown at it. If it broke above 2.30% during this week's rout, the anchor has moved and that is a bigger story than the CPI print.
Three. Whether Warsh delivers the hike the market has dared him into, or explains why not. Either is defensible; what would be costly is doing the first without explanation, because a committee that has abolished forward guidance has nothing left to communicate with except the decision itself.
12. THE CLOSING THOUGHT
In roughly half an hour the Bureau of Labor Statistics will publish a number with a margin of error of four hundredths of a percentage point, and a central bank will use a one-tenth difference in that number to decide whether to raise the price of money for three hundred and forty million people. The Bureau, to its considerable credit, says so plainly in its own technical note — that a reported 0.2% could truly be anything between 0.12% and 0.28%. Nobody is being deceived here. The information is published, in plain English, in the same document as the number. It is simply that a reaction function has been specified to a precision the underlying measurement cannot deliver, and everybody involved has agreed to proceed as though it can, because the alternative — admitting that the difference between hiking and holding is sometimes just noise — is not a thing central banks are able to say out loud. Read the report yourself. It is free, it takes four minutes, and the caveats are in the back. Have a good weekend.
THE BROOKSIDE BRIEF · COMPILED BEFORE 8:30 AM ET, FRIDAY 11 SEPTEMBER 2026 — BEFORE THE AUGUST CPI RELEASE · NO AUGUST CPI FIGURE APPEARS IN THIS BRIEF BECAUSE NONE HAD BEEN PUBLISHED AT THE COMPILE DEADLINE · SOURCES: BUREAU OF LABOR STATISTICS, CONSUMER PRICE INDEX — JULY 2026, USDL-26-1378, READ DIRECTLY (ALL JULY AND YEAR-TO-DATE CPI FIGURES IN FIG. 1, THE COLLECTION METHODOLOGY, THE SEASONAL-ADJUSTMENT DETAIL AND THE PUBLISHED STANDARD ERROR); FEDERAL RESERVE H.15 SELECTED INTEREST RATES, RELEASED 9 SEPTEMBER 2026, READ DIRECTLY (ALL NOMINAL AND INFLATION-INDEXED YIELDS THROUGH 8 SEPTEMBER; BREAKEVENS COMPUTED BY THIS DESK AND NOT A PUBLISHED BOARD SERIES); THESTREET (THURSDAY CLOSE AND SECTOR DETAIL, THURSDAY'S CURVE MOVE CITING CNBC, PPI, OIL, ADOBE, MOVERS, EXISTING HOME SALES, ECB, TRUMP DIVIDEND, DEPORRE, BELLIN AND RODDA COMMENTARY); AGBI, AL JAZEERA AND NPR (JAZAN REFINERY AND HOUTHI CLAIM; ARAMCO CHIEF EXECUTIVE'S STATEMENT); INVESTING.COM (ADOBE RESULTS) · THURSDAY'S YIELDS IN FIG. 2 ARE INTRADAY WIRE QUOTES, NOT H.15 CLOSES, AND WILL BE RECONCILED AGAINST THE BOARD'S FIGURES ON MONDAY · BREAKEVEN DATA STOPS ON 8 SEPTEMBER; THE COMPOSITION OF WEDNESDAY AND THURSDAY'S LARGE NOMINAL MOVES IS NOT YET KNOWN · THIS DESK COULD NOT VERIFY A CIRCULATING CLAIM THAT SAUDI OUTPUT HAS FALLEN TO A 1990 LOW AND HAS DECLINED TO PRINT IT · THE ORACLE RESULT IS NOT CHARACTERISED BECAUSE NO VERIFIED FIGURES WERE IN HAND · DISCLOSURE: THIS BRIEF IS RESEARCHED AND DRAFTED WITH THE ASSISTANCE OF AN AI SYSTEM BUILT BY ANTHROPIC, A COMPANY OPERATING IN THE SECTOR DISCUSSED ABOVE · NOTHING IN THIS BRIEF IS INVESTMENT ADVICE
MORNING EDITION · TUESDAY, SEPTEMBER 15, 2026 · FOMC DAY ONE · CORE CPI 0.3%, ONE TENTH ABOVE WALLER'S LINE · HIKE PRICED AT OVER 90% · 10-YEAR TOUCHED 5% · BRENT $107
Daily Markets Briefing
The Brookside Brief
Markets · Macro · The Day Ahead
— THE NUMBER WE COULD NOT PRINT ON FRIDAY
Friday's brief went out before 8:30 without the August CPI figure, because our own retrieval was lagging the release and we do not print numbers we have not read. Here it is, from the Bureau of Labor Statistics release USDL-26-1496, read in full this morning.
Measure
August
Context
Note
All items, monthly
+0.4%
after +0.1% in July
as consensus
All items, 12-month
3.4%
same as July
above the 3.3% expected
CORE, monthly
+0.3%
after +0.2% in July
ONE TENTH ABOVE WALLER'S LINE
Core, 12-month
2.4%
down from 2.5%
matched estimate
Gasoline, monthly
+3.9%
over a third of the headline
+27.4% over the year
Services less energy services
+0.3%
+3.0% over the year
y/y unchanged from July
Core printed 0.3%. Governor Waller had said publicly he would vote to hold at 0.2% and support a hike above it. The condition was breached by exactly one tenth — the tenth that Friday's brief pointed out is smaller than the Bureau's own published standard error of 0.04% on the monthly change. We take no satisfaction in that. It was the obvious thing to notice and we noticed it; what matters is what it implies, which is Section 7.
1. THE MORNING SETUP
The Federal Open Market Committee convenes this morning and announces tomorrow at two o'clock. The market has stopped treating it as a question: CME FedWatch puts a quarter-point increase at better than 90%, and Kalshi has an 83% probability that the funds rate is above 3.75% when it is over. This would be the first increase since 2023 and the first of Chair Warsh's tenure.
And the genuinely important thing — the thing almost nobody wrote last week — is how the bond market delivered that repricing. Over the four sessions to Friday the ten-year real yield rose seventeen basis points, from 2.43% to 2.60%. The five-year real rose twenty-one, to 2.38%. The thirty-year real reached 3.07%. The entire selloff was real rates. Inflation compensation went nowhere and, on the day of the hot print itself, went down.
FRIDAY'S THREE TESTS, SCORED
Test One — core services excluding shelter. The release reports services less energy services at +0.3% on the month and +3.0% over twelve months — the annual rate unchanged from July. So domestic services inflation did not accelerate on a trend basis. The monthly tick up is real but it is not a new regime. Test Two — the thirty-year breakeven, and whether it broke 2.30%.It did — and then it did not hold. 2.29% on Tuesday, 2.30% on Wednesday, 2.32% on Thursday, and then 2.28% on Friday, CPI day — below where the week began. We said a sustained break would be a bigger story than the CPI print. It was not sustained. Test Three — whether Warsh delivers the hike the market dared him into. Tomorrow at 2:00 PM. Over 90% priced.
Fig. 1 — Friday's ten-year, decomposed from the Fed's own release.
2. MARKETS AT A GLANCE
FRIDAY 11 SEPTEMBER — STOCKS RALLIED ON A HOT CPI
Asset
Last
Change
% Chg
Dow Jones Industrial
52,573.29
+0.98%
led the majors
Nasdaq Composite
26,333.04
+0.96%
—
S&P 500
7,656.98
+0.86%
—
A market that rallies nearly one per cent on an above-consensus inflation print is not celebrating the inflation. It is celebrating the removal of uncertainty — and, we would argue from Figure 1, the fact that the bond market simultaneously marked down its inflation forecast.
MONDAY 14 SEPTEMBER — AND THE FIVE PER CENT HANDLE
Stocks reversed on Monday. The S&P closed around 7,598, roughly 59 points below Friday, on a sharp selloff in AI-related semiconductors, another leg higher in oil, and a brief move above 5% in the ten-year Treasury yield.The five per cent print was intraday; H.15 has Friday's ten-year close at 4.96% and Monday's figure publishes this afternoon.
TREASURY CONSTANT MATURITIES, FROM H.15 — THE WEEK THAT PRE-DELIVERED THE HIKE
Tenor
8 Sep
11 Sep
Change
2-year
4.39%
4.63%
+24 bp
5-year
4.57%
4.78%
+21 bp
10-year
4.80%
4.96%
+16 bp
30-year
5.25%
5.35%
+10 bp
10-year REAL (TIPS)
2.43%
2.60%
+17 bp
30-year REAL (TIPS)
2.96%
3.07%
+11 bp
Fed funds, effective
3.63%
3.63%
unchanged
A thirty-year real yield of 3.07% is a remarkable number. It means an investor can lock in three per cent above inflation for thirty years, guaranteed by the United States Treasury. Whatever else is true about this market, long-dated real assets are now competing against a genuinely high risk-free real return — which is most of what has been happening to utilities, small caps and long-duration equity all month.
ENERGY
Asset
Last
Change
% Chg
Brent crude
~$107.46
15 Sep
from $98.51 on 8 Sep
Brent, 14 Sep
$108.34
+3.56%
—
3. TOP STORIES
What Actually Put Core at 0.3%
This is worth doing carefully, because the difference between a broad inflation problem and a narrow one is the difference between a hiking cycle and a single insurance hike.
Fig. 3 — Selected core components, August.
The three largest monthly moves inside core were airline fares at +2.7%, lodging away from home at +2.4%, and communication at +2.3%. Bloomberg attributed the core beat specifically to a record jump in cellular phone service prices — the communication line. Lodging is a bounce-back: it fell 2.8% in July and rose 2.4% in August, which nets to roughly nothing over two months. Shelter rose 0.3% after 0.1%, and shelter is about a third of core.
Against that, two of the most reliably sticky services categories fell. Medical care declined 0.2% — with hospital services, physicians' services and prescription drugs all literally unchanged and dental services down 0.6%. Motor vehicle insurance fell 0.8%. Apparel and recreation were flat.
Assemble that and the picture is a core number carried by phone plans, travel and the rear-view mirror of shelter, while the parts of the basket most tied to domestic wage costs were soft or falling. And on a twelve-month basis core inflation did not rise at all — it fell, from 2.5% to 2.4%.That is not an argument that the Fed should not hike. It is an argument that the case for hiking rests on the oil-driven headline and on risk management, not on evidence that underlying inflation has broadened.
The Bond Market Did the Fed's Work
Figure 1 is the most encouraging piece of data this desk has published in a fortnight. On Friday, on a core print that beat to the upside and effectively guaranteed a rate rise, the ten-year nominal yield moved one basis point. The real yield rose five. Breakeven inflation fell four, from 2.40% to 2.36%. The five-year was starker: real up nine, breakeven down six.
Read that in plain English: presented with hotter inflation data, the market raised the real return it demands and lowered its forecast of future inflation. It did so because it concluded the Federal Reserve would act. That is the entire mechanism of monetary credibility working in a single afternoon, and it is the strongest argument available that the anchor described in this brief for the past three weeks is intact.
Fig. 2 — The thirty-year breakeven through the wobble.
The thirty-year breakeven makes the same point over the week. It cleared the 2.30% line we flagged on Wednesday and Thursday, reaching 2.32% as the ten-year approached five per cent. Then CPI landed and it fell to 2.28% — lower than where it started the week. Two sessions of doubt, resolved by the expectation of action.
Oil Is Still the Problem the Fed Cannot Fix
Brent is around $107, having reached $108.34 on Monday. The drivers reported are intensified fighting in the Gulf, attacks that have shut down a major Saudi pipeline, and the postponement of talks between Iran and the Gulf states. That is the third distinct category of energy infrastructure to be hit in a fortnight — after tankers in transit and the Jazan refinery, now a pipeline.
Gasoline rose 3.9% in August and accounted for over a third of the entire monthly headline increase. It is up 27.4% over twelve months. Fuel oil is up 52.0%.None of that is amenable to a federal funds rate. The Fed will raise rates tomorrow partly because of a price it has no instrument to influence — which is the oldest and least satisfying problem in central banking, and the one Chair Warsh will be asked about first.
4. MACRO & FED WATCH
Going in: over 90% priced for a quarter point, taking the target range to 3.75-4.00% from 3.50-3.75%. The effective funds rate has sat at 3.63% every single business day since late August.
THE TWO THINGS THAT WOULD SURPRISE
A hold. At 90% priced, holding would be the largest communication event of Warsh's tenure — and he has argued explicitly that markets should react to data rather than to the Fed's anticipated reaction to data, so he may regard validating a market expectation as precisely the wrong reason to move. The counter-argument is that disappointing a 90% priced move without forward guidance to soften it would be violently disruptive, and central banks that have abolished guidance have historically become more reluctant to surprise, not less.Fifty basis points. Very unlikely, but not unthinkable given three dissents in favour of a hike as far back as July and a headline rate stuck at 3.4% for two months. Our base case is that the committee does the thing that is priced and lets the statement do the rest of the work.
One question we cannot resolve and flag as genuinely open: whether tomorrow includes a Summary of Economic Projections. September is conventionally a projection meeting, and an SEP with a dot plot would be by far the most informative document this Federal Reserve has produced — because for a committee that has abolished forward guidance, the projections are the only forward-looking thing left. We have not been able to confirm whether this committee is publishing one. If it does, it is the headline of Wednesday's brief regardless of what the rate does.
5. ECONOMIC CALENDAR
Date
Time ET
Event
Note
TUE 15 Sep
—
FOMC DAY ONE
No announcement today
TUE 15 Sep
4:15 PM
H.15
Monday's yields and the 5% question
WED 16 Sep
2:00 PM
FOMC DECISION
>90% priced for +25 bp
Wed 16 Sep
2:00 PM
Statement — and any SEP
132 words last time
Thu 17 Sep
8:30 AM
Initial jobless claims
206,000 two weeks ago
Wed 14 Oct
8:30 AM
September CPI
Next inflation print
Fri 2 Oct
8:30 AM
September payrolls
And the August revision
6. EARNINGS WATCH
A quiet stretch between the AI cluster and the banks in mid-October. The pattern established through late August and early September stands and is worth carrying into the next season: of the companies that beat consensus, only those that also raised guidance were rewarded. Dell rose on a $25 billion revenue raise; Snowflake rose 24% on 37% product revenue growth. MongoDB, Hewlett Packard Enterprise, Broadcom and Adobe all beat and all fell. At a 3.07% thirty-year real yield, a beat that does not change the trajectory is not worth paying for.
7. THE PRIMER: READING A FED DECISION THAT COMES WITH NO GUIDANCE
Tomorrow at two o'clock the Federal Reserve will publish a document that, last time, ran to 132 words. There will be no press-conference promise about the next meeting, because this Chair has abolished the practice. So the question is: what is actually left to read? Rather more than you might think, and almost none of it is the headline rate.
One: the vote
The single most informative line in any FOMC statement is the list of who voted which way. Dissents are rare, deliberate and costly — a regional president who dissents is making a public statement about their own reaction function. In July, three members dissented in favour of a hike while the committee held. If tomorrow's hike carries dissents in the other direction — members preferring to hold — that tells you the committee is split on whether an oil shock justifies tightening, and that the next move is much less certain than the market thinks. A unanimous hike says the opposite. Count the names. It takes ten seconds and almost nobody does it.
Two: the statement, compared word by word
Because the statement is short, every word in it is load-bearing. The technique is to put the new statement next to the old one and mark the differences — the financial press calls this a redline and several outlets publish one within minutes. What you are looking for is not new promises. It is changes to the description of conditions: whether inflation is "elevated" or "has eased", whether labour market conditions are "solid" or "have softened", whether risks are described as "balanced". Those adjectives are the committee's assessment, and in the absence of guidance they are the only thing it is telling you about how it reads the world.
THREE: THE IMPLEMENTATION NOTE, WHICH NOBODY READS
Alongside the statement the Board publishes an implementation note setting the administered rates — interest on reserve balances, the discount rate, and the overnight reverse repo rate — and describing what happens to the balance sheet. This is where you find out whether a hike is a genuine tightening or a technical adjustment, and whether the committee is changing the pace of balance-sheet runoff. It also matters enormously right now because the Treasury is simultaneously running enlarged buybacks of long-dated debt. A Fed that raises the policy rate while slowing runoff is doing something quite different from one that raises and keeps shrinking, and only the implementation note tells you which.
Four: the projections, if there are any
Four times a year the committee publishes a Summary of Economic Projections: each participant's forecast for growth, unemployment, inflation and the appropriate policy rate, the last of these displayed as the dot plot. The dots are individual, anonymous, and explicitly not a commitment — the standard caveat is that they are projections conditional on each participant's own view of appropriate policy, not a plan.
But for a committee that has stopped giving forward guidance, an SEP is the only forward-looking information it still produces, which makes it far more important now than it was under the previous regime. The number to find is the median dot for the end of this year and next — not because it will be right, but because it is the committee's own central expectation, and the gap between it and market pricing is where the next repricing comes from.
Five: what to ignore
The first fifteen minutes of price action. It is dominated by algorithmic reading of the statement and by positioning unwinds, and it reverses often enough to be useless as signal. The press conference's opening statement, which is written in advance and says nothing the statement did not. And any commentary that describes the decision as "hawkish" or "dovish" without reference to what was priced beforehand — a 25 basis point hike into 90% pricing is close to neutral, and a 25 basis point hike into 40% pricing would be violently hawkish. The same action means different things depending on the starting point.
THE ORDER TO READ IT IN, TOMORROW AT 2:00
First, the rate decision and the target range. Two seconds. Second, the vote and any dissents — names and direction. Third, a redline of the statement against July's, looking only at changed adjectives. Fourth, the implementation note for administered rates and balance-sheet language. Fifth, the SEP if there is one, and specifically the median dot. Then close the browser until tomorrow. Everything after that is interpretation, and interpretation on the afternoon of a decision is worth less than your own reading of five primary documents that are all free and all published simultaneously at federalreserve.gov.
8. ANALYST CALLS DRIVING ACTION
Nationwide moved to a quarter-point hike call after the CPI print. CBS News, summarising economists after the release: a September hike is "all but guaranteed." Bloomberg's framing was the sharpest — that the Fed's rate decision "may have come down to phone plan changes", given that a record jump in cellular service prices is what lifted core above forecast. That is a fair description of the arithmetic and an uncomfortable one for anybody who believes policy should rest on broad measures rather than single volatile components.
9. STOCKS TO WATCH
SEMICONDUCTORS AND THE AI COMPLEX
Monday's decline was led by a sharp selloff in AI-related semiconductors. The mechanism is not complicated and this desk has flagged it repeatedly: a 3.07% thirty-year real yield raises the discount rate applied to cash flows that arrive in 2030 and beyond, and that is most of what an AI infrastructure valuation consists of. The demand story has not changed — the Federal Reserve's own Beige Book said growth is being driven by data centre demand a fortnight ago. The discount rate has changed.
AI-ENERGY
Constellation (CEG), Vistra (VST), Talen (TLN) — tomorrow at two o'clock is the single variable, and specifically whether the statement or any projections imply this is one insurance hike or the start of a sequence. One hike is survivable for long-duration contracted cash flows; a cycle is not.GE Vernova (GEV) remains the exception in the complex.
ENERGY AND PHYSICAL AI
With Brent at $107 and a Saudi pipeline reportedly shut, the energy complex continues to be the one part of the market with a fundamental tailwind rather than a discount-rate headwind. On the physical-AI bench: Symbotic (SYM), Teradyne (TER), Serve Robotics (SERV), Cognex (CGNX).
10. GLOBAL MACRO SNAPSHOT
Market
Development
Detail
Note
United States
FOMC decides tomorrow
>90% priced for +25 bp
First hike since 2023
Euro area
ECB hiked 25 bp to 2.5%
10 September
First major CB to move
Saudi Arabia
Major pipeline reported shut
Plus the Jazan refinery
Third category of target
Iran / Gulf
Talks postponed
Fighting intensified
Brent to $108.34 Monday
The European Central Bank moved first, on 10 September, raising its deposit rate to 2.5%. If the Federal Reserve follows tomorrow, two of the three largest central banks will have tightened within a week of each other in response to an oil shock neither of them caused and neither can remedy. That is a synchronised global tightening into a supply disruption — the precise policy configuration that produced the recessions of the mid-1970s and early 1980s.We are not forecasting a recession and the differences from those episodes are substantial: wage growth at 3.1% is nothing like the wage-price spiral of that era, and inflation expectations remain anchored, as Figure 2 shows. But the shape of the policy response rhymes, and it is worth saying so plainly.
11. WEEK AHEAD PREVIEW
Today: FOMC day one. No announcement. H.15 at 4:15 gives Monday's yields and settles whether the ten-year closed above five per cent.
Tomorrow, 2:00 PM: the decision, the statement, the implementation note, and possibly a Summary of Economic Projections.
Thursday, 8:30: jobless claims.
2 October: September payrolls, and the first revision to the 162,000 August print.
WHAT WE ARE WATCHING, STATED IN ADVANCE
One. The vote. A unanimous hike and a split hike are different animals, and the difference tells you whether tomorrow is one move or the first of several.
Two. Whether the thirty-year breakeven stays below 2.30% after the decision. It has now tested that line once and failed to hold above it. If a delivered hike pushes it back up — the market concluding the Fed is behind rather than ahead — that would be a genuinely bad outcome and the opposite of Friday's reaction.
Three. The ten-year real yield, currently 2.60%. It has risen seventeen basis points in four sessions and is doing more damage to equity valuations than anything in the earnings data. Whether a delivered hike stops it rising is the question for every long-duration asset on the board.
12. THE CLOSING THOUGHT
On Friday the Bureau of Labor Statistics reported that core consumer prices rose three tenths of one per cent in August rather than two, and that one tenth — smaller than the Bureau's own stated margin of error, and driven substantially by a record move in the price of mobile phone plans — appears to have settled whether the world's most important central bank raises interest rates tomorrow. That is either absurd or it is exactly right, and the case that it is exactly right is better than it sounds: the market's response was to demand a higher real return and simultaneously lower its forecast of inflation, which is what happens when people believe a central bank will act before it has acted. The hike, in that sense, has already been delivered — in the real yield, not the funds rate. Tomorrow is the paperwork. The interesting question is not whether they move but what the vote looks like, and that will be in the second paragraph, and hardly anyone will read it. Have a good Tuesday.
THE BROOKSIDE BRIEF · COMPILED 7:45 AM ET, TUESDAY 15 SEPTEMBER 2026, BEFORE THE OPEN · THE AUGUST CPI FIGURES OMITTED FROM FRIDAY'S BRIEF APPEAR AT THE HEAD OF THIS ONE · SOURCES: BUREAU OF LABOR STATISTICS, CONSUMER PRICE INDEX — AUGUST 2026, USDL-26-1496, PUBLISHED 8:30 AM ET 11 SEPTEMBER 2026, READ DIRECTLY — ALL CPI FIGURES AND ALL COMPONENT DETAIL IN FIG. 3; FEDERAL RESERVE H.15 SELECTED INTEREST RATES, RELEASED 14 SEPTEMBER 2026, READ DIRECTLY — ALL NOMINAL AND INFLATION-INDEXED YIELDS AND THE EFFECTIVE FUNDS RATE; ALL BREAKEVEN FIGURES ARE THE ARITHMETIC DIFFERENCE, COMPUTED BY THIS DESK, AND ARE NOT A PUBLISHED BOARD SERIES; CME FEDWATCH AND KALSHI AS REPORTED BY YAHOO FINANCE AND THE MOTLEY FOOL (HIKE PROBABILITIES); BLOOMBERG (CELLULAR PHONE SERVICE PRICES AND THE RATE DECISION); CBS NEWS AND CNBC (ECONOMIST REACTION, NATIONWIDE); INVESTRADE AND STL.NEWS (FRIDAY AND MONDAY CLOSES); SCHWAB (MONDAY'S AI SEMICONDUCTOR SELLOFF AND THE FIVE PER CENT TEN-YEAR); TRADING ECONOMICS AND CONVEX (BRENT) · MONDAY'S CLOSING INDEX LEVELS ARE APPROXIMATE AS REPORTED AND WILL BE RECONCILED TOMORROW · THE TEN-YEAR'S MOVE ABOVE 5% ON MONDAY WAS INTRADAY; H.15 PUBLISHES MONDAY'S CLOSE THIS AFTERNOON · THIS DESK COULD NOT CONFIRM WHETHER TOMORROW'S MEETING INCLUDES A SUMMARY OF ECONOMIC PROJECTIONS AND HAS FLAGGED THAT AS OPEN RATHER THAN ASSUMING EITHER WAY · FIG. 3 SHOWS COMPONENT PRICE CHANGES, NOT WEIGHTED CONTRIBUTIONS TO CORE · DISCLOSURE: THIS BRIEF IS RESEARCHED AND DRAFTED WITH THE ASSISTANCE OF AN AI SYSTEM BUILT BY ANTHROPIC, A COMPANY OPERATING IN THE SECTOR DISCUSSED ABOVE · NOTHING IN THIS BRIEF IS INVESTMENT ADVICE
MORNING EDITION · WEDNESDAY, SEPTEMBER 16, 2026 · FOMC DECIDES 2:00 PM · DOT PLOT RETURNS · 93% PRICED FOR +25 BP · 10-YEAR HIT 5.04%, A 2007 HIGH · BREAKEVENS UNMOVED ON THE WEEK
Daily Markets Briefing
The Brookside Brief
Markets · Macro · The Day Ahead
— EDITOR'S NOTE: A CORRECTION ON MONDAY'S FIVE PER CENT
Yesterday's brief reported that Monday 14 September included "a brief 10-year move above 5%." We flagged at the time that the figure was intraday and unverified pending H.15. H.15 published that afternoon and it does not support the claim: the 10-year constant maturity closed Monday at 4.97%. The five per cent handle arrived a day later than we printed it — on Tuesday, when the 10-year reached 5.04% intraday, its highest since 2007, and closed around 5%.
The error is small in magnitude and instructive in kind. We attributed to Monday a move that had not yet happened, on the strength of wire copy written while it was still happening. The rule established on 1 September stands and we restate it: the curve numbers in this brief come from H.15 or the Treasury's own daily yield curve, and wire quotes are for intraday colour only. A number that is described as unverified should not also be used as a fact in the same sentence.
1. THE MORNING SETUP
At two o'clock this afternoon the Federal Open Market Committee is expected to raise the federal funds target range by a quarter point to 3.75-4.00%, the first increase since 2023 and the first of Chair Warsh's tenure. CME FedWatch puts it at roughly 93%. The press conference follows at 2:30.
And one question this brief flagged yesterday as genuinely open is now closed: the meeting does include a Summary of Economic Projections and a dot plot. We said that if it did, it would be the headline regardless of what the rate does. We stand by that. For a committee that abolished forward guidance in June, the projections are the only forward-looking document it still produces.
The dot plot also supplies the fact that reframes today. In June the median participant projected a funds rate of 3.8% at the end of this year — one quarter-point increase. If the committee moves this afternoon, it is not lurching in response to one hot inflation print. It is completing a path it published three months ago. The interesting question is therefore not today's rate but where the new dots sit for 2027.
Fig. 1 — The 10-year decomposed, 8-14 September. Nominal and real rose seventeen basis points each. Breakeven inflation finished exactly where it started.
YESTERDAY'S THREE TESTS, AND WHERE THEY STAND
One — the vote. Unresolved until 2:00. It remains the line we will read first. Two — whether the 30-year breakeven stays below the 2.30% line. It closed Monday at 2.29%, one basis point below. It has now spent three sessions failing to hold above that line. Three — the 10-year real yield, and whether a delivered hike stops it rising. It was unchanged Monday at 2.60% after rising seventeen basis points in the four sessions before. The first stall of the episode, on the day before the decision.
2. MARKETS AT A GLANCE
TUESDAY 15 SEPTEMBER — A SIXTH DECLINE IN SEVEN SESSIONS
Market
Level
Change
Note
Dow Jones Industrial
52,093.11
−328.09
−0.63%
S&P 500
7,585.73
—
−0.45%
Nasdaq Composite
25,981.57
—
−0.78%
Brent crude
$107.46
—
back above $100 and staying
VIX
17.20
+0.10
+0.58%
Bitcoin
$76,921
—
as at 9:00 AM ET Tuesday
The 10-year Treasury yield reached 5.04% intraday on Tuesday, above the peaks of 2023 and the highest since 2007, and closed around five per cent. Reporting attributes the move to two forces this brief has been tracking separately for a fortnight: booming capital investment, and energy prices that will not come down. Neither is a demand-side inflation that a funds rate reaches easily.
TREASURY CONSTANT MATURITIES — THE WEEK THAT PRE-DELIVERED THE HIKE
Tenor
8 Sep
14 Sep
Change
2-year
4.39%
4.65%
+26 bp
5-year
4.57%
4.80%
+23 bp
10-year
4.80%
4.97%
+17 bp
30-year
5.25%
5.34%
+9 bp
10-year REAL (TIPS)
2.43%
2.60%
+17 bp
30-year REAL (TIPS)
2.96%
3.05%
+9 bp
10-year BREAKEVEN
2.37%
2.37%
0 bp
30-year BREAKEVEN
2.29%
2.29%
0 bp
Fed funds, effective
3.63%
3.63%
unchanged
Read the last three rows together and the week resolves into a single sentence. Between the 8th and the 14th the bond market repriced the path of policy by seventeen basis points at ten years and nine at thirty — and its forecast of inflation over those same horizons did not change by a single basis point.
Fig. 2 — Change by tenor, 8 to 14 September. Nominal and real move together at every point on the curve; the residual is zero.
3. TOP STORIES
What a Zero Looks Like
It is worth being precise about why a row of zeroes is the most important thing in this brief. A nominal Treasury yield contains two things: the real return investors require, and the compensation they demand for expected inflation. Break one from the other and you learn what the market thinks is actually happening.
Over the week to Monday, every basis point of the move was real. The market demanded a higher real return — which is what tighter policy means — and left its inflation forecast untouched. It did that through an above-consensus CPI print on the Friday and a Monday on which oil went higher again.
That is the definition of an anchored expectation, and it is the strongest argument available that this Federal Reserve retains its credibility. The counterfactual is easy to picture and would look nothing like this: breakevens widening as the market concluded the committee was behind an oil shock it had decided to tolerate. Nothing of the kind has happened. Not at five years, not at ten, not at thirty.
The Five Per Cent Handle and What It Costs
A 10-year at five per cent and a 30-year real yield above three per cent are not abstractions. They are the discount rate applied to every long-dated cash flow in the market — and, through the mortgage market, to housing. This is most of what has been happening to equities all month. Six declines in seven sessions have occurred without any deterioration in reported earnings; what deteriorated is the denominator.
Which is why today is a genuine fork. A committee that hikes and is believed will see long yields stabilise or fall, because the market prices a Fed that gets ahead of the problem. A committee that hikes and is not believed will see the long end keep rising anyway. The two outcomes look identical at 2:00 and completely different by Friday.
The AI Complex Has Found a Second Derivative
On 12 September, Anthropic's Dario Amodei published a 3,800-word essay titled "We Must Pace the Frontier," calling for embedded independent evaluators, coordination among firms in democratic countries, and eventually an international agreement including China. On Monday Microsoft joined OpenAI, Anthropic and SpaceXAI in endorsing a more cautious approach, and a semiconductor gauge fell 5.9%.
The distinction that matters: every previous AI scare was a demand question asked by outsiders. This one came from the buyers. Microsoft is not a commentator on the AI capex cycle; it is the purchase order inside the backlog. Nobody announced a cut — Microsoft's Mustafa Suleyman said the industry has to keep developing, "just with a little bit more caution and care." What changed is not the level of spending but its implied acceleration, and a complex priced for acceleration does not need a cut to reprice.
The counter-argument is the strongest one available and we print it: Deutsche Bank's analysts noted it is difficult to imagine firms voluntarily stepping back while rivals push ahead. No company has committed to a capex number. Until caution appears in a guidance line rather than an essay, this is sentiment, not cash flow.
4. MACRO & FED WATCH
Going in: roughly 93% priced for a quarter point to 3.75-4.00%. The effective funds rate has printed 3.63% every business day for three weeks. August core CPI came in at +0.3% month on month — one tenth above the threshold Governor Waller had named as his condition for holding — while core on a twelve-month basis fell to 2.4% from 2.5%.
THE ORDER TO READ IT IN, AT 2:00
First, the target range. Two seconds. Second, the vote and any dissents — names and direction. A unanimous hike and a split hike are different animals. Third, the statement redlined against July's, looking only at changed adjectives. Fourth, the implementation note — administered rates and any balance-sheet language, which is Section 7's subject and where today's most under-covered news may sit. Fifth, the SEP, and specifically the median dot for end-2027. Ignore the first fifteen minutes of price action, and ignore any commentary calling the decision hawkish or dovish without reference to what was priced beforehand. A hike into 93% pricing is close to neutral.
5. ECONOMIC CALENDAR
Date
Time ET
Event
Note
WED 16 Sep
2:00 PM
FOMC DECISION + SEP + DOT PLOT
93% priced for +25 bp
Wed 16 Sep
2:00 PM
Statement and implementation note
132 words last time
Wed 16 Sep
2:30 PM
Chair Warsh press conference
First hike of his tenure
Wed 16 Sep
4:15 PM
H.15
Tuesday's close and the 5% question
Thu 17 Sep
8:30 AM
Initial jobless claims
206,000 three weeks ago
Fri 2 Oct
8:30 AM
September payrolls
And the August revision
Wed 14 Oct
8:30 AM
September CPI
Next inflation print
6. EARNINGS WATCH
A quiet stretch until the banks in mid-October. The pattern from late August and early September stands and is worth carrying forward: of the companies that beat consensus, only those that also raised guidance were rewarded. Dell rose on a $25 billion revenue raise; Snowflake rose 24% on 37% product revenue growth. MongoDB, Hewlett Packard Enterprise, Broadcom and Adobe all beat and all fell. At a 3.05% thirty-year real yield, a beat that does not change the trajectory is not worth paying for.
The date to mark is late October, when the hyperscalers guide. That is the first hard test of whether Monday's caution is a budget or a press release.
7. THE PRIMER: THE PLUMBING UNDER THE POLICY RATE
This afternoon's implementation note will set something called the overnight reverse repurchase rate. It is the least-read number the Federal Reserve publishes and one of the more consequential. A reader asked what it is. The honest answer requires starting one level down, in a market most people have never looked at and all of them depend on.
One: what a repo actually is
A repurchase agreement is a collateralised loan wearing a costume. I sell you a Treasury today and agree to buy it back tomorrow at a slightly higher price. Legally it is two sales. Economically it is me borrowing cash overnight against a bond, and the difference between the two prices is the interest.
The costume is not decorative. Because it is structured as a sale, the cash lender owns the collateral outright rather than holding a lien on it. If the borrower fails, the lender keeps the bond and sells it — no bankruptcy queue, no waiting. That single feature is why this is the cheapest funding in the world, and why the market is roughly $12 trillion.
The same trade has two names depending on which end of it you are standing at. Hand over the bond and take cash, and you have done a repo. Take the bond and lend the cash, and you have done a reverse repo. One transaction, two labels — which is the origin of most confusion about the term.
Two: so what is the Fed's reverse repo rate
The Fed's overnight reverse repo facility is the central bank taking the lender's side in reverse: money market funds hand the Fed cash overnight and receive Treasury collateral, at a rate the Fed sets. It exists as a floor. No money fund should lend to a private borrower for less than the Federal Reserve will pay it risk-free, so the facility sets the bottom of the corridor while interest on reserve balances does the work near the top.
That is why it lives in the implementation note rather than the statement. It is not a stance on the economy. It is the plumbing that makes the announced target range actually bind — and if you have ever wondered how a committee "sets" a rate that is determined by private trades between banks, this is the answer.
Three: why the Fed cares more than you would assume
Repo pressure does not stay in repo. Federal Home Loan Banks lend in both the repo market and the federal funds market. When repo rates become more attractive, the FHLBs shift their lending there, and the arbitrage drags federal funds up behind it. Pressure in a market the Fed does not set transmits directly into the effective federal funds rate, which is the rate the Fed does set.
September 2019 is the case study. A $54 billion coupon settlement hit corporate tax outflows on the same day, with reserves below nine per cent of GDP. SOFR spiked more than 280 basis points to 5.25%, and the effective funds rate printed five basis points above the top of the target range.The Federal Reserve lost control of its own policy rate for a day, through the plumbing, with no change whatsoever in its stated policy.
WHY THIS IS A NONLINEAR PROBLEM, NOT A LINEAR ONE
Board staff estimate that $50 billion of net Treasury coupon issuance moves the repo spread by less than one basis point when Federal Reserve liquidity is above 12 per cent of GDP — and by almost ten basis points when it is below 10 per cent. Same shock, ten times the effect, determined by nothing but how much cash is in the system. It is why this topic was irrelevant in 2021 and is not now, and it is the reason the Fed began buying Treasury bills for reserve management purposes in December 2025 — about $120 billion through mid-April — long before anything had visibly broken.
Four: the exodus almost nobody is covering
There is a second repo story running, and it is regulatory rather than cyclical. The SEC is forcing Treasury repo into central clearing — eligible repo by 30 June 2027, with Treasury cash transactions already mandated from 31 December 2026. A central counterparty steps between the two sides and becomes the counterparty to each.
The consequence most coverage misses is what it does to SOFR. The Secured Overnight Financing Rate is not built from all repo. It is constructed from triparty, from FICC's General Collateral Financing service, and from cleared delivery-versus-payment trades — and it has never included non-centrally cleared bilateral repo, the segment where relative-value funds finance basis trades and off-the-run arbitrage. That exclusion is the dark spot: a large, leveraged corner of the funding market that the benchmark cannot see.
Fig. 3 — The overnight repo rate complex. Central clearing moves roughly a trillion dollars of borrowing across the boundary and into the benchmark's sample.
The mandate drags that volume — on one published estimate roughly $1 trillion — out of the bilateral segment and into cleared DVP, which means it enters SOFR's calculation for the first time. The same estimate sketches three outcomes: a mild repricing of about one basis point, a firmer one of two to three, or a low-probability disorderly case well beyond that. These are one analyst's scenarios rather than a consensus, and we print them as such.
Even the small outcomes matter, because SOFR is the reference rate beneath the entire post-LIBOR complex of swaps and floating-rate debt. A benchmark that moves for compositional reasons — because the sample changed, not because funding got tighter — repricing the world's floating-rate contracts is a genuinely new problem, and it arrives on a known date.
Five: and the swaps, briefly
Two different instruments share the word. An interest rate swap exchanges a fixed payment stream for a floating one, and the floating leg references SOFR — which makes everything above a swaps story as much as a repo story. An FX swap is different: borrow dollars, post another currency as collateral, unwind later. Economically it is a collateralised dollar loan, which is why the FX swap basis is the first thing to blow out in any dollar funding squeeze, and why large banks treat FX swaps and repo as substitutes when balancing funding across currencies.
None of this normally matters. That is precisely the point. The plumbing is invisible until the day it is the only thing that matters, and the people who noticed in August 2019 had a month's warning.
8. ANALYST CALLS DRIVING ACTION
Nationwide moved to a quarter-point hike call after the CPI print. CBS News, summarising economists: a September increase is "all but guaranteed." Bloomberg's framing remains the sharpest and the most uncomfortable — that the decision "may have come down to phone plan changes," given that a record jump in cellular service prices is what lifted core above forecast. Deutsche Bank on the AI slowdown: it is hard to imagine firms stepping back voluntarily while rivals advance.
9. STOCKS TO WATCH
AI-ENERGY AND THE POWER COMPLEX
Constellation (CEG), Vistra (VST) and Talen (TLN) face the single variable at two o'clock: whether the statement and the dots imply one insurance hike or the beginning of a sequence. One hike is survivable for long-duration contracted cash flows. A cycle is not.GE Vernova (GEV) remains the exception in the complex, and Quanta (PWR) benefits from the physical bottleneck regardless of how the frontier-model debate resolves.
PHYSICAL AI
Symbotic (SYM), Teradyne (TER), Serve Robotics (SERV) and Cognex (CGNX). A useful feature of the embodied-AI names this week: the argument about pacing the frontier is an argument about training ever-larger models. It is not obviously an argument about warehouse automation or machine vision, which run on capability that already exists.
SEMICONDUCTORS
The complex is absorbing a discount-rate shock and a demand-derivative shock at the same time. The demand story has not changed — the Fed's own Beige Book credited data-centre demand with driving growth a fortnight ago. What changed is the rate at which the future is discounted and the confidence with which the buyers describe their own spending.
10. GLOBAL MACRO SNAPSHOT
Market
Development
Detail
United States
FOMC decides at 2:00 PM
93% priced; SEP and dot plot included
Euro area
ECB hiked 25 bp to 2.5%
10 September; moved first
Oil
Brent $107.46
Above $100 and clouding every inflation forecast
Middle East
Supply risk elevated
Tanker, refinery and pipeline disruption
AI policy
Ban Superintelligence Act introduced
Sanders and Casar, 3 September
If the Federal Reserve moves this afternoon, two of the three largest central banks will have tightened within a week of each other in response to an oil shock neither caused and neither can remedy.We noted yesterday that the shape of that policy response rhymes with the mid-1970s, and we repeat the qualification that matters: wage growth at 3.1% is nothing like the spiral of that era, and — as Figures 1 and 2 show — inflation expectations are not merely anchored but did not move at all last week. The rhyme is in the configuration, not in the outcome.
11. WEEK AHEAD PREVIEW
Today, 2:00 PM: decision, statement, implementation note, SEP and dot plot. 2:30, the press conference. 4:15, H.15 with Tuesday's close.
Thursday, 8:30: jobless claims. 2 October: September payrolls and the first revision to the 162,000 August print. Late October: hyperscaler guidance, and the first hard read on whether AI caution is a budget.
WHAT WE ARE WATCHING, STATED IN ADVANCE
One. The median dot for end-2027. Today's hike was already in the June projections; next year's path was not, and the gap between the new dots and market pricing is where the next repricing comes from.
Two. Whether breakevens stay still. They have now gone a full week without moving through a hot CPI print and higher oil. If a delivered hike widens them — the market concluding the Fed is behind rather than ahead — that would be the genuinely bad outcome, and the opposite of everything Figures 1 and 2 show.
Three. The implementation note, for any change to administered rates beyond the mechanical, any language on reserve management purchases, and any mention of standing repo operations. Given Section 7, we will be reading it more carefully than usual, and we will report what it says tomorrow whether or not it is interesting.
12. THE CLOSING THOUGHT
The most telling number in this brief is a zero. Across a week that contained an above-consensus inflation print, oil above a hundred dollars, a ten-year Treasury yield at levels last seen before the financial crisis, and the near-certain end of a three-year pause, the bond market's forecast of inflation over the next decade changed by nothing at all. Every basis point of the repricing was the real return investors demand — which is the precise signature of a market that expects a central bank to act, and expects the action to work.
That is worth holding onto this afternoon, because the commentary will be about the quarter point and the quarter point is the least informative thing on offer. It has been priced for a week and projected since June. The information is in the vote, in the dots for 2027, and in a two-page implementation note that sets the floor under a twelve-trillion-dollar market almost nobody will mention.Have a good Wednesday.
THE BROOKSIDE BRIEF · COMPILED 8:30 AM ET, WEDNESDAY 16 SEPTEMBER 2026, BEFORE THE OPEN SOURCES: FEDERAL RESERVE H.15 SELECTED INTEREST RATES, RELEASED 15 SEPTEMBER 2026, READ DIRECTLY — ALL NOMINAL AND INFLATION-INDEXED YIELDS AND THE EFFECTIVE FUNDS RATE THROUGH MONDAY 14 SEPTEMBER; ALL BREAKEVEN FIGURES ARE THE ARITHMETIC DIFFERENCE, COMPUTED BY THIS DESK, AND ARE NOT A PUBLISHED BOARD SERIES; BUREAU OF LABOR STATISTICS CPI FOR AUGUST 2026, USDL-26-1496, RELEASED 11 SEPTEMBER 2026; FEDERAL RESERVE FEDS NOTE "REPO MARKETS AND THE FED'S BALANCE SHEET," 26 AUGUST 2026 (REPO-TO-EFFR TRANSMISSION, ISSUANCE SENSITIVITY, RESERVE MANAGEMENT PURCHASES, SEPTEMBER 2019 FIGURES); SEC PRESS RELEASE 2025-43 AND SUBSEQUENT IMPLEMENTATION UPDATES (TREASURY CLEARING COMPLIANCE DATES); CONKS, "INFOGRAPHICS: THE REPO EXODUS," 15 SEPTEMBER 2026 (SOFR COMPOSITION, MIGRATION ESTIMATE AND SCENARIOS); CME FEDWATCH VIA KIPLINGER AND CNBC; CNBC, CNN AND BLOOMBERG (TUESDAY'S SESSION AND THE 5.04% PRINT); SEMAFOR AND REUTERS (MONDAY'S AI SELLOFF); FORTUNE (BITCOIN); CBOE (VIX); TRADING ECONOMICS AND CONVEX (BRENT) CORRECTION PUBLISHED ABOVE: YESTERDAY'S EDITION PLACED THE 10-YEAR'S MOVE ABOVE 5% ON MONDAY 14 SEPTEMBER. H.15 SHOWS MONDAY'S CLOSE AT 4.97%; THE 5.04% PRINT WAS TUESDAY 15 SEPTEMBER · TUESDAY'S H.15 FIGURES PUBLISH AT 4:15 PM TODAY AND WILL BE RECONCILED TOMORROW · THE $1 TRILLION MIGRATION FIGURE AND THE THREE SOFR SCENARIOS IN SECTION 7 ARE ONE ANALYST'S ESTIMATES, NOT CONSENSUS DISCLOSURE: THIS BRIEF IS RESEARCHED AND DRAFTED WITH THE ASSISTANCE OF AN AI SYSTEM BUILT BY ANTHROPIC, A COMPANY DISCUSSED IN SECTION 3 ABOVE · NOTHING IN THIS BRIEF IS INVESTMENT ADVICE
MORNING EDITION · THURSDAY, SEPTEMBER 17, 2026 · FED HIKES TO 3.75-4.00%, UNANIMOUS · DOTS SAY ONE MORE THIS YEAR AND NO CUTS IN 2027 · NEUTRAL REVISED UP · QT IS OVER · BRENT −2.7%
Daily Markets Briefing
The Brookside Brief
Markets · Macro · The Day Ahead
1. THE MORNING SETUP
The Federal Reserve raised the target range a quarter point to 3.75-4.00% yesterday afternoon, its first increase since 2023 and the first of Chair Warsh's tenure. The vote was unanimous. There were no dissents.
Yesterday's brief said the vote would be the first line worth reading and that a unanimous hike and a split hike are different animals. It was unanimous, which tells you this committee is not divided over whether an energy-driven inflation overshoot justifies tightening. Three members dissented in favour of a hike as far back as July. Yesterday the rest of them came across.
But the decision was the least interesting document released at two o'clock. The projections were considerably more hawkish than the hike, the implementation note contained a change to the balance sheet that nobody covered, and the market spent thirty minutes moving in precisely the wrong direction before working out what it had been handed.
THE THREE TESTS WE STATED IN ADVANCE, SCORED
One — the vote.Unanimous. Scored: the committee is not split. Two — whether a delivered hike widens breakevens. Through Tuesday it had not: ten-year inflation compensation moved from 2.37% to 2.38% across the week, thirty-year from 2.30% to 2.29%. Wednesday's figures publish this afternoon and we will report them tomorrow either way. Three — the implementation note. It contained the most consequential unreported news of the day, and it is Section 7.
2. MARKETS AT A GLANCE
WEDNESDAY 16 SEPTEMBER — UP, THEN DECISIVELY DOWN
Market
Level / move
Change
Note
Dow Jones Industrial
−1.2%
about 600 points
fell as much as 1.6% intraday
S&P 500
−0.4%
—
reversed from +0.3% after 2:00
Nasdaq Composite
little changed
—
reversed from +0.7% after 2:00
10-year Treasury
back above 5%
—
fell first, then climbed
Brent crude
$105.48
−2.68%
from $108.38 Tuesday
Bitcoin
$75,942
−1.27%
7:00 AM ET Wednesday
VIX (Tuesday close)
17.20
+0.10
Wednesday publishes today
The sequence is the story, and it is worth setting out precisely. In the minutes after the statement landed the S&P rose 0.3%, the Nasdaq rose 0.7% and Treasury yields fell. Then Chair Warsh began speaking, the market read him as hawkish, and the Dow fell more than 700 points — a swing of well over a per cent inside half an hour.
Yesterday's brief told readers to ignore the first fifteen minutes of price action because it is dominated by algorithmic reading of the statement and by positioning unwinds, and because it reverses often enough to be useless as signal. We did not expect to be able to score that one the same afternoon.
TREASURY CONSTANT MATURITIES THROUGH TUESDAY — THE WEEK BEFORE THE DECISION
Tenor
9 Sep
15 Sep
Change
2-year
4.43%
4.67%
+24 bp
10-year
4.83%
5.00%
+17 bp
30-year
5.28%
5.36%
+8 bp
10-year REAL (TIPS)
2.46%
2.62%
+16 bp
30-year REAL (TIPS)
2.98%
3.07%
+9 bp
10-year BREAKEVEN
2.37%
2.38%
+1 bp
30-year BREAKEVEN
2.30%
2.29%
−1 bp
Fed funds, effective
3.63%
3.63%
unchanged
The ten-year closed Tuesday at exactly 5.00% — the highest close since 2007, and confirmation of the correction this brief published yesterday. Note what the last two rows have now done for a second consecutive week.
Fig. 1 — Breakeven inflation at three tenors, 9 to 15 September. A hot CPI print, oil above $105 and a near-certain rate rise moved it by one basis point.
3. TOP STORIES
The Dots Did the Talking
The Summary of Economic Projections is where yesterday actually happened, and it was hawkish in every dimension at once. The median participant now sees the funds rate at 4.1% at the end of this year, against 3.8% in June. The midpoint after yesterday's move is 3.875%. The committee's own median therefore implies another quarter point before December — and 16 of the 18 participants expect at least one more, with four seeing two.
The 2027 median also sits at 4.1%, against 3.6% in June. That is not a slower path of cuts. That is no cuts at all next year. The 2028 median rose to 3.9% from 3.4%.
Fig. 2 — The median projected policy path, June against September. Every horizon moved up, and so did the committee's estimate of where rates settle in the long run.
The number almost nobody will write about is the last one: the longer-run median moved from 3.1% to 3.2%. That is the committee's estimate of neutral — the rate that neither stimulates nor restrains once the cycle is over. It is the anchor underneath the entire long end of the curve, and a committee revising it upward is saying the higher-rate regime is not a forecasting error that will wash out. If it goes to 3.3% in December, every long-dated valuation in the market reprices around it.
The rest of the forecast is of a piece. Growth was revised up — 2.3% this year and 2.4% next, against 2.2% and 2.3%. Unemployment was revised down hard, to 4.1% in every year from 4.3%. PCE inflation this year goes to 3.7% and core to 3.4%, and core does not reach 2% until 2029. Risks to inflation were judged weighted to the upside by very nearly the entire committee, with uncertainty higher than normal.
Read together: a stronger economy, a tighter labour market, inflation lasting three more years, and a policy rate that stays where it is through next year. That is a committee that has stopped describing this as a passing energy shock.
What Warsh Actually Said
"Our predominant focus is on the price stability side of our mandate," the Chair said. "The plain fact is that inflation is too high and has been for too long." He opened by noting that productivity growth is strong, capital investment robust, job gains keeping pace with the workforce and unemployment little changed — "but inflation remains elevated."
The statement carried the sentence the redline was for: today's action "will support a timelier return to the Committee's 2 percent goal."Timelier is a confession. It concedes the previous path was going to get there too slowly.
Asked about political pressure on the Federal Reserve, he declined: "We stay in our lane. We'll let people that do trade policy and fiscal policy stay in their lane too."Hold on to that sentence. It is Section 7.
Two Data Points Nobody Noticed Under the Fed
August retail sales rose 1.2% against an expected 0.9%, after a 0.5% decline in July. The consumer did not merely hold up; spending reaccelerated. That is a point for the hawks and it helps explain the unemployment revision.
And Brent fell 2.68% on the day, to $105.48 from $108.38.It remains up roughly 14% on the month and the Gulf supply picture has not changed. But this is the first session in a fortnight where the energy impulse ran the Fed's way rather than against it, and if it persists it does more for the inflation path than the quarter point did.
4. MACRO & FED WATCH
Instrument / projection
Level
Note
Target range
3.75-4.00%
raised 25 bp, unanimous
Interest on reserve balances
3.90%
effective today
Standing repo operations
4.00%
the ceiling
Overnight reverse repo
3.75%
the floor; $160bn per counterparty per day
Primary credit rate
4.00%
effective today
Median dot, end-2026
4.1%
implies one more hike
Median dot, end-2027
4.1%
implies no cuts next year
Median dot, longer run
3.2%
up from 3.1% in June
For readers who followed Tuesday's primer: the corridor is now fully visible. The reverse repo facility at 3.75% is the floor under money-market lending, interest on reserves at 3.90% does the work in the middle, and the standing repo facility at 4.00% caps the top. That is how a committee "sets" a rate that is actually determined by private trades between banks.
5. ECONOMIC CALENDAR
Date
Time ET
Event
Note
THU 17 Sep
8:30 AM
Initial jobless claims
First read since the hike
Thu 17 Sep
4:15 PM
H.15
Wednesday's yields and breakevens
Fri 2 Oct
8:30 AM
September payrolls
And the August revision
Wed 14 Oct
8:30 AM
September CPI
The one that decides the next meeting
Late Oct
—
Hyperscaler guidance
First hard test of AI capex caution
Early Nov
—
Treasury quarterly refunding
Watch the bills share
Jobless claims publish at 8:30 this morning, after this brief compiles. Claims were 206,000 three weeks ago. We will carry the number tomorrow rather than guess at it today.
6. EARNINGS WATCH
Quiet until the banks in mid-October. The pattern holds: beats were only rewarded when they came with raised guidance. Dell rose on a $25 billion revenue raise, Snowflake 24% on 37% product revenue growth; MongoDB, Hewlett Packard Enterprise, Broadcom and Adobe all beat and all fell.
That bar just moved higher. A median dot implying no cuts through 2027 and a neutral rate revised upward means the discount rate applied to 2029 cash flows is not coming down on schedule. At a 3.07% thirty-year real yield, the hurdle for paying up for growth is now set by the Federal Reserve's own projections rather than by sentiment.
7. THE PRIMER: THE OTHER TWIST, AND WHO CONTROLS THE LONG END
A reader asked about Operation Twist and whether the Federal Reserve might use it now. The answer turns out to be documented in yesterday's implementation note, and it is more interesting than a yes or a no.
What a twist is
Sell or run off short-dated Treasuries, buy long-dated ones, leave the balance sheet the same size. The Federal Reserve did this in 1961 and again in 2011-12. The purpose is to push down long yields — the ones that set mortgage rates and corporate financing costs — without creating new reserves. It is a way of easing where it matters without easing everywhere.
Why the Fed is not doing one
Because its own directive forbids it. The instruction issued yesterday to the Open Market Desk reads, in part, that it may increase holdings "through purchases of Treasury bills and, if needed, other Treasury securities with remaining maturities of three years or less." Three years or less. That is the opposite end of the curve from a twist. Agency mortgage principal is now reinvested into bills as well.
AND THE SENTENCE THAT ENDED QUANTITATIVE TIGHTENING
The same directive instructs the Desk to "roll over at auction all principal payments from the Federal Reserve's holdings of Treasury securities."All of them. There is no runoff cap any more, which means the balance sheet has stopped shrinking. The Federal Reserve ended quantitative tightening yesterday, in a two-page technical annex, on the same afternoon it raised rates for the first time in three years — and we have not seen it reported anywhere. Tightening the price of money while ceasing to shrink the quantity of it is a genuine change of posture, and it did not appear in the statement.
Who is doing the twist instead
The Treasury. Secretary Bessent has been buying back old, off-the-run 10-to-30-year bonds and funding the purchases by issuing bills — and he has called it, in terms, a "Treasury Twist." Effective 9 September the buyback operations doubled: from a $2 billion maximum per operation to a $4 billion minimum, with long-end operations going from two to four a quarter. Treasury has said it would repurchase up to $69 billion between 6 August and 5 November, since raised toward a maximum near $83 billion. The Treasury General Account has been built to roughly $950 billion as the war chest behind it.
Fig. 3 — The Federal Reserve is confined to the front end. The Treasury is operating at the back end. The mechanism is the same; the institution is not.
So the twist is real, and it is being run by the borrower rather than the central bank. The mechanics are identical — duration comes out of private hands, bills go back in. The authority is completely different. A central bank doing this is conducting monetary policy. A Treasury doing this is managing its own debt, which it is entitled to do, and which happens to have the same effect on the curve.
Why this matters, and what it costs
Two things follow. First, every buyback funded with bills shortens the average maturity of the national debt. You are trading duration risk today for refinancing risk tomorrow — and with the funds rate now at 4% and the committee projecting no cuts through 2027, that refinancing happens at the highest short rate in three years. The firepower is real but it is not free and it is not unlimited.
Second, and more awkward: a Treasury holding down long yields is loosening financial conditions, which is precisely what the Federal Reserve is trying to tighten. The two institutions are pulling against each other from opposite ends of the same curve. Which is why Chair Warsh's "we stay in our lane" was the most carefully constructed sentence of his press conference. He was asked about fiscal policy and he declined to be drawn — while presiding over a directive that keeps his own Desk as far from the Treasury's operating range as it is possible to get.
THE HISTORICAL RHYME, STATED CAREFULLY
In 1951 the Treasury announced short-dated issuance on the same day the Federal Reserve announced a tightening, in an explicit attempt to force the central bank's hand. The public argument that followed produced the Treasury-Fed Accord and the modern doctrine of central bank independence. We are not claiming that is happening now — there is no yield peg, no public dispute, and both parties are operating within their own authorities. But the configuration is the same one: a Treasury with a large financing need shortening its issuance, and a central bank trying to tighten into it. It is worth knowing the precedent exists.
8. ANALYST CALLS DRIVING ACTION
Attention now turns to whether the next hike comes in October or December, with the committee's own median saying one of them. The commentary to discount is anything describing yesterday as hawkish or dovish without reference to what was priced. A quarter point into 93% pricing was close to neutral; the hawkishness was entirely in the projections, which were not priced at all. That is why the market rose first and fell afterwards — it read the rate before it read the dots.
9. STOCKS TO WATCH
AI-ENERGY AND THE POWER COMPLEX
Constellation (CEG), Vistra (VST) and Talen (TLN) got the answer they did not want. The question into the meeting was whether this is one insurance hike or a sequence; the dots said sequence, and said no relief in 2027.GE Vernova (GEV) and Quanta (PWR) remain the exceptions, because the physical bottleneck in turbines, transformers and skilled labour is indifferent to the discount rate.
PHYSICAL AI
Symbotic (SYM), Teradyne (TER), Serve Robotics (SERV) and Cognex (CGNX). Retail sales at +1.2% is a better read-through for warehouse automation than anything in the Fed's projections — throughput demand is what justifies the capital equipment.
RATE-SENSITIVES AND THE LONG-DURATION COMPLEX
A longer-run dot of 3.2% and a ten-year at five per cent is the whole story for housing, small caps and unprofitable growth.The relief for these names was supposed to come from cuts in 2027. The committee has just said there aren't any.
10. GLOBAL MACRO SNAPSHOT
Market
Development
Detail
United States
Hiked to 3.75-4.00%, unanimous
Dots imply one more in 2026, none cut in 2027
Euro area
ECB hiked 25 bp to 2.5% on 10 Sep
Moved a week before the Fed
Oil
Brent $105.48, −2.68%
First session of relief in a fortnight
US fiscal
Treasury buybacks doubled from 9 Sep
TGA built to roughly $950bn
US balance sheet
Full reinvestment resumed
Quantitative tightening has ended
Two of the three largest central banks have now tightened within a week of each other in response to an energy shock neither caused.We have noted the mid-1970s rhyme twice and we will keep the qualification attached to it: wage growth at 3.1% is nothing like that era, and inflation compensation — as Figure 1 shows for the second week running — has not moved at all. The configuration rhymes. The expectations do not.
11. WEEK AHEAD PREVIEW
Today, 8:30: jobless claims. 4:15: H.15 with Wednesday's curve, and the first post-decision reading of breakevens. 2 October: September payrolls. 14 October: September CPI, which now effectively decides whether the extra hike lands in October or December. Early November: the quarterly refunding.
WHAT WE ARE WATCHING, STATED IN ADVANCE
One. Wednesday's breakevens, in this afternoon's H.15. A delivered hike should hold them flat or narrow them. If they widened on the day the Fed tightened, that is the market saying the move was insufficient — and it would be the first genuine crack in the credibility story this brief has been tracking for three weeks.
Two. Whether the thirty-year outperforms the two-year from here. A bear-flattening curve is the signature of a tightening that is believed. A re-steepening, with the long end leading, would mean term premium is demanding more regardless of what the Fed does — and would tell you the Treasury's twist is fighting the tide rather than setting it.
Three. The bills share at the November refunding, and the pace of the TGA drawdown. That is the gauge of how much of Treasury's firepower has been spent, and it is publicly observable.
12. THE CLOSING THOUGHT
The Federal Reserve did the thing that was priced, and the market fell anyway — because the priced thing was never the point. The quarter point had been settled for a week and projected since June. What was not priced was a committee telling you it expects to go again this year, expects to cut nothing next year, and has quietly raised its estimate of where interest rates finally settle. Those three sentences cost the Dow six hundred points, and every one of them was in a document you can download for free.
Meanwhile, in a technical annex that generated no headlines at all, the same institution stopped shrinking its balance sheet and confined its own buying to maturities under three years — while the Treasury, at the other end of the curve, buys back thirty-year bonds with money raised in bills. Two arms of the government, one yield curve, opposite directions. Nobody is doing anything improper and nobody is hiding anything. It is all published. It is simply that the important things are rarely in the press release.Have a good Thursday.
THE BROOKSIDE BRIEF · COMPILED 8:40 AM ET, THURSDAY 17 SEPTEMBER 2026, BEFORE THE OPEN SOURCES: FOMC STATEMENT AND IMPLEMENTATION NOTE, 16 SEPTEMBER 2026, READ DIRECTLY — TARGET RANGE, ADMINISTERED RATES, THE THREE-YEAR MATURITY LIMIT ON DESK PURCHASES AND THE FULL-REINVESTMENT INSTRUCTION; FOMC SUMMARY OF ECONOMIC PROJECTIONS, 16 SEPTEMBER 2026, READ DIRECTLY — ALL MEDIANS, CENTRAL TENDENCIES AND JUNE COMPARISONS; FEDERAL RESERVE H.15, RELEASED 16 SEPTEMBER 2026, READ DIRECTLY — ALL YIELDS THROUGH TUESDAY 15 SEPTEMBER; ALL BREAKEVENS ARE THE ARITHMETIC DIFFERENCE, COMPUTED BY THIS DESK, AND ARE NOT A PUBLISHED BOARD SERIES; YAHOO FINANCE LIVE COVERAGE (WEDNESDAY'S SESSION, THE INTRADAY REVERSAL, WARSH PRESS CONFERENCE QUOTATIONS AND AUGUST RETAIL SALES); CNBC AND BLOOMBERG (POST-DECISION YIELD REACTION, DOT-PLOT DISTRIBUTION); TREASURY PRESS RELEASE ON INCREASED LONG-END BUYBACK SIZES EFFECTIVE 9 SEPTEMBER 2026; CNBC (THE "TREASURY TWIST" DESCRIPTION AND THE TGA FIGURE); CONVEX (BRENT); FORTUNE (BITCOIN); CBOE VIA FRED (VIX) WEDNESDAY'S INDEX MOVES ARE REPORTED AS PERCENTAGES BECAUSE CLOSING LEVELS WERE NOT VERIFIED AT COMPILE; THEY WILL BE RECONCILED TOMORROW · WEDNESDAY'S YIELDS AND BREAKEVENS PUBLISH IN H.15 AT 4:15 PM TODAY · BITCOIN AND VIX ARE POINT-IN-TIME READINGS AS LABELLED, NOT SESSION CLOSES · THE 1951 PARALLEL IN SECTION 7 IS OFFERED AS HISTORICAL CONTEXT AND IS EXPLICITLY NOT A CLAIM ABOUT PRESENT CONDUCT DISCLOSURE: THIS BRIEF IS RESEARCHED AND DRAFTED WITH THE ASSISTANCE OF AN AI SYSTEM BUILT BY ANTHROPIC · NOTHING IN THIS BRIEF IS INVESTMENT ADVICE
MORNING EDITION · FRIDAY, SEPTEMBER 18, 2026 · THURSDAY ERASED THE FED-DAY SELLOFF · NASDAQ +1.7% · 10-YEAR BACK TO 4.93% · CLAIMS FELL TO 196,000 · BRENT DOWN THREE SESSIONS
Daily Markets Briefing
The Brookside Brief
Markets · Macro · The Day Ahead
— EDITOR'S NOTE: WEDNESDAY'S LEVELS, AS PROMISED
Thursday's brief reported Wednesday's index moves as percentages because the closing levels were not verified at compile, and undertook to reconcile them. Wednesday 16 September: the Dow closed at 51,461.90, down 631.21 points or 1.2%. The S&P 500 closed at 7,551.81, down 33.92 or 0.5%. The Nasdaq Composite closed at 25,978.43, down 3.15 points — effectively unchanged. The VIX closed at 17.71. Those figures are consistent with what we printed.
A TRAP WORTH NAMING, BECAUSE WE NEARLY WALKED INTO IT
Compiling this morning, one widely syndicated market wrap headlined "Stock Market News for Sep 17" reported the Dow down 631 points. Those are Wednesday's numbers in a piece published Thursday morning. A second source, the Associated Press tabulation headed "How major US stock indexes fared Thursday," had the Dow up 316 points. Two reputable sources, opposite directions, same date in the headline. The rule this desk adopted after the August stale-data failure is that a source conflict on a verifiable number stops the brief until it is resolved. It stopped this one. The resolution was arithmetic: 7,585.73 less 33.92 is 7,551.81, which is Tuesday's close minus Wednesday's move. The dateline was describing when the article was written, not which session it covered.
1. THE MORNING SETUP
Thursday undid most of Wednesday. The Nasdaq Composite rose 439.87 points, or 1.7%, to 26,418.30. The S&P 500 added 85.95, or 1.1%, to 7,637.76. The Dow rose 316.14, or 0.6%, to 51,778.04. Two forces did it: oil fell for a third consecutive session, and the bond market eased.
The number that matters most is the second one. The ten-year Treasury yield, which closed above five per cent on the day of the rate rise, fell to 4.93% on Thursday.
WHICH SCORES THE TEST WE STATED ON WEDNESDAY MORNING
We wrote, before the decision: "A committee that hikes and is believed will see long yields stabilise or fall, because the market prices a Fed that gets ahead of the problem. A committee that hikes and is not believed will see the long end keep rising anyway. The two outcomes look identical at 2:00 and completely different by Friday." It is Friday. The Federal Reserve raised rates, signalled more, and the ten-year yield went down. That is the believed case, and it is the single most encouraging thing in this brief.
One caveat we will not paper over: the H.15 releases covering Wednesday and Thursday were not available at compile, so we cannot yet decompose that move into real yield and inflation compensation. The nominal fall is verified from wire reporting. The breakeven reading — the test we actually care about — has to wait for the data, and we will carry it Monday.
2. MARKETS AT A GLANCE
THURSDAY 17 SEPTEMBER — THE REVERSAL
Market
Close
Change
Per cent
Nasdaq Composite
26,418.30
+439.87
+1.69%
S&P 500
7,637.76
+85.95
+1.14%
Dow Jones Industrial
51,778.04
+316.14
+0.61%
Russell 2000
2,874.63
+15.82
+0.55%
10-year Treasury
4.93%
—
back below 5%
Brent crude
$104.09
—
−1.41%, third down session
VIX (Wednesday close)
17.71
+3%
Thursday's close publishes today
Fig. 1 — The round trip. Across the decision and the session after it, the Nasdaq is up 1.7% and the Dow is down 0.6%.
Measured from Tuesday's close to Thursday's, the first rate rise in three years and a set of hawkish projections left the Nasdaq up 1.68%, the S&P up 0.69% and the Dow down 0.60%.The "hawkish Fed crushes equities" story lasted about eighteen hours. What it did not do is leave the market where it found it — the dispersion between the three indices is the real information, and it is not about the Fed.
WHERE WEDNESDAY'S DAMAGE ACTUALLY LANDED
Fig. 2 — Sector performance on decision day. Energy did most of the work, and the Dow carries more of it than the Nasdaq does.
Energy fell 3.0% on Wednesday, financials 1.6% and materials 0.7%, while technology rose 0.1%. Eight of the eleven S&P sectors closed lower. ExxonMobil fell 3.5% and Occidental 6.6%.That is not a discount-rate selloff. It is an oil selloff wearing a Federal Reserve costume, and it explains why the Dow — heavier in energy and banks — lost four times as much as the Nasdaq on the day the Fed was supposedly punishing long-duration growth.
3. TOP STORIES
Saudi Cargoes Do What the Fed Cannot
Brent has now fallen three sessions running, from $108.38 on Tuesday to $104.09 Thursday. The reported cause is specific and worth understanding: Saudi Arabia is offering additional crude cargoes to Asian refiners through ship-to-ship transfers near Oman's Sohar port, partly offsetting the disruption from attacks on the kingdom's East-West pipeline feeding the Red Sea export hub at Yanbu. A smaller-than-expected draw in US crude inventories — down 0.6 million barrels to 423.4 million — added to the pressure.
Fig. 3 — Brent through September. From $95 to $109 in nine days on Gulf supply disruption, and now three sessions of relief.
This is the most important thing in the brief after the ten-year, and it is the point this desk has made for a fortnight in the other direction. Gasoline contributed more than a third of August's headline CPI increase. Energy is up 14% on the month and more than 20% over three. The Federal Reserve raised rates on Wednesday partly because of a price it has no instrument to influence. On Thursday a shipping arrangement off the coast of Oman did more for the inflation path than the quarter point did.
The qualification matters: three sessions is not a trend, Brent is still above $100, and the pipeline that caused the problem has not been repaired. Ship-to-ship transfer is a workaround, not a fix. But the direction of the energy impulse has changed for the first time since the start of the month, and if it holds it changes the October CPI print more than anything the committee said.
The Labour Market Refuses to Crack
Initial jobless claims fell 10,000 to 196,000 in the week ended 12 September. The four-week average fell to 203,250 from 206,000. Continuing claims fell to 1.730 million from 1.769 million. Every one of those moves points the same way.
This is the data that justifies the projections. On Wednesday the committee revised its unemployment forecast down to 4.1% in every year through 2029, from 4.3% in June — an unusually large revision for a variable that moves slowly. Claims under 200,000 with continuing claims falling is a labour market in which the Federal Reserve can tighten without much fear of breaking anything. It is also, for the same reason, a labour market that gives the committee no excuse to stop.
What Warsh Told You About the Next One
Reviewing the press conference with a day's distance, the Chair's framing was consistent and specific: the economy had strengthened since June, with underlying growth higher and the labour market near full employment, but recent inflation readings had not shown meaningful improvement. Paired with a median dot at 4.1% for end-2026 and 16 of 18 participants expecting at least one more increase, the question is no longer whether there is another hike but whether it lands in October or December.
Which puts an unusual amount of weight on a single data point: the September CPI on 14 October. If energy keeps retreating and core stays near 0.3%, the committee can wait. If core accelerates, it cannot.
4. MACRO & FED WATCH
Indicator
Level
Change
Note
Initial claims, w/e 12 Sep
196,000
−10,000
Lowest in weeks
Four-week average
203,250
from 206,000
Falling
Continuing claims, w/e 5 Sep
1.730m
from 1.769m
Falling
Business inventories, July
+0.8%
June revised to +0.1%
Restocking
Crude inventories, w/e 11 Sep
423.4m bbl
−0.6m
Smaller draw than expected
Target range
3.75-4.00%
raised 16 Sep
Unanimous
Nothing in this week's data argues against another rise. Retail sales reaccelerated to +1.2% in August, claims fell, continuing claims fell, and inventories are being rebuilt. The only genuinely disinflationary development of the week came from the Gulf of Oman.
5. ECONOMIC CALENDAR
Date
Time ET
Event
Note
FRI 18 Sep
4:15 PM
H.15
Wed and Thu yields; the breakeven test
Thu 24 Sep
8:30 AM
Initial jobless claims
196,000 last week
Fri 2 Oct
8:30 AM
September payrolls
And the August revision
Wed 14 Oct
8:30 AM
September CPI
Decides October or December
Mid-Oct
—
Bank earnings
Season opens
Late Oct
—
Hyperscaler guidance
First hard test of AI capex caution
Early Nov
—
Treasury quarterly refunding
Watch the bills share
6. EARNINGS WATCH
Quiet until the banks open the season in mid-October. Thursday's move is a useful reminder of what the season will be priced against: a ten-year at 4.93% rather than 5.04%, which is eleven basis points of relief on every discounted cash flow in the market.
The pattern from August stands — beats were rewarded only when paired with raised guidance. But the denominator moved in companies' favour this week, and that is the first time this month it has.
7. THE PRIMER: HOW RAISING RATES CAN LOWER LONG YIELDS
On Wednesday the Federal Reserve raised interest rates and said it expected to raise them again. On Thursday the ten-year Treasury yield fell. To most people that sounds like an error. It is not, and the reason is one of the more useful things in finance to understand properly.
One: the Fed sets one rate, and it is not the one that matters to you
The federal funds rate is an overnight rate — the cost of borrowing until tomorrow morning. The Federal Reserve controls it almost completely. It does not set the ten-year yield, the thirty-year yield, or your mortgage rate. Those are prices determined by buyers and sellers in a market, and the committee can only influence them indirectly.
Two: a long yield is a forecast plus a risk premium
A ten-year Treasury yield is approximately three things added together. First, the average short-term rate the market expects over the next ten years — because if you can roll overnight loans for a decade, a ten-year bond has to compete with that. Second, compensation for expected inflation, because the coupons are paid in future dollars. Third, a term premium — extra yield demanded for the risk of being locked in for ten years while anything could happen.
THE MOVE THAT LOOKS LIKE A CONTRADICTION AND ISN'T
When a central bank tightens credibly, it raises the first component and lowers the second and third at the same time. The expected path of short rates goes up — which is why the two-year yield rose on Wednesday. But if the market believes the tightening will work, expected inflation over the next decade falls, and the uncertainty premium attached to that forecast falls with it. Those effects pull in opposite directions, and at the long end the second and third can win. A ten-year yield falling after a rate rise is not the market ignoring the Fed. It is the market paying the Fed a compliment.
Three: what the opposite looks like
The failure case is worth picturing, because it is how you would know. A central bank raises rates, and long yields rise anyway. That happens when the market concludes the move was too small or too late — so the expected path of short rates goes up and inflation compensation goes up and the term premium goes up, all together. You see it most clearly in breakevens: inflation compensation widening on the day a central bank tightens is the market saying the tightening was insufficient.
This is precisely why this brief has printed a breakeven decomposition every day for three weeks rather than simply reporting the headline yield. The nominal number tells you what happened. The split tells you what it meant.
Four: the honest complication
Thursday's fall in the ten-year was not purely a monetary story, and it would be sloppy to claim otherwise. Oil fell the same day, and oil feeds directly into expected inflation. Some of the eleven basis points was the Federal Reserve being believed, and some of it was a cargo of Saudi crude being redirected near Oman.Separating the two requires the real-yield data we do not yet have, which is exactly why we flagged the gap in Section 1 rather than telling you a cleaner story than the evidence supports.
THE PRACTICAL VERSION, IN ONE LINE
Watch the two-year for what the Fed is doing. Watch the ten-year breakeven for whether anyone believes it will work. The first is policy. The second is credibility, and credibility is the cheaper of the two ways to bring inflation down — which is the whole reason central banks care so much about being believed.
8. ANALYST CALLS DRIVING ACTION
The debate has moved to October versus December for the next increase, with the committee's own median saying one of them happens. The more interesting split is over 2027: the dots say no cuts, and a good deal of sell-side modelling still assumes some.That gap — between a median dot of 4.1% at the end of 2027 and what is embedded in most equity valuations — is where the next repricing comes from, in either direction.
9. STOCKS TO WATCH
ENERGY
ExxonMobil (XOM) fell 3.5% and Occidental (OXY) 6.6% on Wednesday as Brent rolled over. The complex spent a fortnight as the one part of the market with a fundamental tailwind. Three sessions of Saudi workaround cargoes have reminded everyone that a supply-shock trade is short whatever fixes the supply.
AI-ENERGY AND THE POWER COMPLEX
Constellation (CEG), Vistra (VST), Talen (TLN). Thursday's eleven basis points of relief at the ten-year is worth more to these names than to almost anything else on the board, because their cash flows are contracted and long. The projections remain the problem — no cuts in 2027 — but the direction of travel improved.GE Vernova (GEV) and Quanta (PWR) stay on the physical bottleneck rather than the rate.
PHYSICAL AI
Symbotic (SYM), Teradyne (TER), Serve Robotics (SERV), Cognex (CGNX). Retail sales at +1.2% and inventories rebuilding at +0.8% are the two numbers that matter for warehouse automation, and both came in this week.
10. GLOBAL MACRO SNAPSHOT
Market
Development
Detail
United States
Hiked to 3.75-4.00% on 16 Sep
Long end fell the next day
Euro area
ECB at 2.5% since 10 Sep
Moved first
Saudi Arabia
Extra cargoes to Asian refiners
Ship-to-ship near Sohar, Oman
Red Sea
East-West pipeline still disrupted
Yanbu export hub affected
US labour
Claims 196,000, continuing falling
No crack anywhere
The week's shape, in one sentence: two central banks tightened into an oil shock, and then the oil shock eased for reasons that had nothing to do with either of them.That is a reminder worth keeping. Monetary policy operates on demand with a lag of quarters. Supply moves in days, and it moved this week.
11. WEEK AHEAD PREVIEW
This afternoon, 4:15: H.15, with Wednesday's and Thursday's curve. That is the release that decomposes the ten-year's fall and settles the breakeven question. 2 October: September payrolls. 14 October: September CPI — now the single most consequential number on the calendar.
WHAT WE ARE WATCHING, STATED IN ADVANCE
One. The breakeven decomposition of Thursday's move, in this afternoon's data. If the ten-year's fall was mostly real yield, the market is repricing growth. If it was mostly inflation compensation, the Fed is being believed and the oil relief is feeding through. Those are different worlds and the data will separate them.
Two. Whether Brent holds below $105. Three consecutive down sessions on a workaround is not the same as a resolved supply problem, and the pipeline is still damaged. A reversal back above $108 puts the October CPI print — and the October meeting — back in play.
Three. Whether the energy complex keeps underperforming. XLE down 3% in a session is the market unwinding a crowded supply-shock trade. If that continues while the index rises, it tells you positioning rather than fundamentals was driving the sector's fortnight.
12. THE CLOSING THOUGHT
On Wednesday the Federal Reserve delivered the most hawkish package of its Chair's tenure — a unanimous rise, a median dot implying another, no cuts projected for next year, and a higher estimate of where rates eventually settle. The Dow fell 631 points. By Thursday evening the Nasdaq was up 1.7% on the week's two sessions and the ten-year yield was lower than before the meeting.
The lesson is not that the Fed does not matter. It is that a central bank raising rates into a supply shock is doing something with a long lag, while the supply shock itself can ease in an afternoon — and this week it did, because a state oil company started transferring cargoes between ships off the coast of Oman. Two days of market history turned on a decision taken in Riyadh rather than one taken in Washington.Have a good weekend.
THE BROOKSIDE BRIEF · COMPILED 8:45 AM ET, FRIDAY 18 SEPTEMBER 2026, BEFORE THE OPEN SOURCES: ASSOCIATED PRESS INDEX TABULATIONS FOR 16 AND 17 SEPTEMBER 2026 (ALL CLOSING LEVELS AND POINT CHANGES; THURSDAY'S 10-YEAR YIELD); ZACKS MARKET WRAP VIA YAHOO FINANCE (WEDNESDAY SECTOR PERFORMANCE, VIX CLOSE, VOLUME, BRENT AND WTI SETTLEMENTS, SAUDI SHIP-TO-SHIP CARGO REPORTS, CRUDE AND BUSINESS INVENTORIES); BLOOMBERG AND LABOR DEPARTMENT (INITIAL AND CONTINUING CLAIMS); FOMC STATEMENT, IMPLEMENTATION NOTE AND SUMMARY OF ECONOMIC PROJECTIONS, 16 SEPTEMBER 2026, READ DIRECTLY; FEDERAL RESERVE H.15 RELEASED 16 SEPTEMBER 2026 (YIELDS THROUGH 15 SEPTEMBER); CONVEX (BRENT DAILY SERIES); CBOE VIA FRED (VIX) THE H.15 RELEASES COVERING WEDNESDAY AND THURSDAY WERE NOT AVAILABLE AT COMPILE, SO NO BREAKEVEN DECOMPOSITION OF THURSDAY'S MOVE IS PRINTED; IT WILL BE CARRIED MONDAY · THURSDAY'S 10-YEAR YIELD IS FROM WIRE REPORTING PENDING H.15 · THURSDAY'S VIX CLOSE PUBLISHES TODAY; WEDNESDAY'S IS SHOWN · BRENT FIGURES ARE A LIVE SPOT SERIES AND DIFFER SLIGHTLY FROM FUTURES SETTLEMENTS QUOTED ELSEWHERE DISCLOSURE: THIS BRIEF IS RESEARCHED AND DRAFTED WITH THE ASSISTANCE OF AN AI SYSTEM BUILT BY ANTHROPIC · NOTHING IN THIS BRIEF IS INVESTMENT ADVICE
MORNING EDITION · MONDAY, SEPTEMBER 21, 2026 · THE TEST IS ANSWERED: THE FED IS BELIEVED · BREAKEVENS FELL AT EVERY TENOR · EFFR MOVED TO 3.88% · BRENT BELOW $100 DESPITE ATTACKS ON SAUDI ARABIA · TRUMP-XI THURSDAY
Daily Markets Briefing
The Brookside Brief
Markets · Macro · The Day Ahead
1. THE MORNING SETUP
On Friday this brief said that H.15 would settle the question we actually cared about, and that we would carry it today either way. It has, and the answer is unambiguous.
We asked whether the ten-year's fall after the rate rise was real yield — the market repricing growth — or inflation compensation, meaning the Federal Reserve is being believed. Across the two sessions of the decision, the ten-year nominal yield fell six basis points. The real yield fell one. Inflation compensation fell five.
Fig. 1 — The ten-year decomposed across the decision. On the day of the hike the real yield rose six basis points and breakevens fell five.
THE TWO DAYS SEPARATELY, BECAUSE THEY ARE DIFFERENT EVENTS
On Wednesday, the day of the rise, the ten-year nominal moved a single basis point — but the real yield rose six and inflation compensation fell five. That is the textbook credibility trade: the market demanded a higher real return and simultaneously lowered its forecast of inflation. On Thursday the whole thing came down together — nominal seven, real seven, breakevens unchanged. Thursday was a growth and term premium move. Wednesday was a credibility move. Only the decomposition tells you that, and it is why we did not print a cleaner story on Friday than the data supported.
2. MARKETS AT A GLANCE
THE DECOMPOSITION — FEDERAL RESERVE H.15, RELEASED FRIDAY
15 Sep
16 Sep
17 Sep
Change
10-year nominal
5.00%
5.01%
4.94%
−6 bp
10-year real (TIPS)
2.62%
2.68%
2.61%
−1 bp
10-year BREAKEVEN
2.38%
2.33%
2.33%
−5 bp
5-year breakeven
2.41%
2.35%
2.32%
−9 bp
30-year breakeven
2.29%
2.26%
2.25%
−4 bp
2-year nominal
4.67%
4.74%
4.67%
0 bp
30-year nominal
5.36%
5.35%
5.29%
−7 bp
Fed funds, effective
3.63%
3.63%
3.88%
+25 bp
Note the bottom row. The effective federal funds rate went from 3.63% to 3.88% on Thursday — exactly a quarter point, landing precisely at the midpoint of the new 3.75-4.00% range. The bank prime loan rate moved from 6.75% to 7.00% and the discount window from 3.75% to 4.00% on the same day. Transmission from decision to money market was clean and immediate. That is not guaranteed — it is the plumbing this brief described a week ago doing exactly what it is designed to do.
Fig. 2 — Breakeven inflation at three tenors. Every horizon fell through the decision, and the five-year fell hardest.
And here is the nuance that matters, which we flagged in advance as the honest complication. The five-year breakeven fell nine basis points across the decision; the thirty-year fell four. The compression is concentrated at the near horizon — which is precisely where an unwinding oil shock shows up, because oil affects the next few years of inflation far more than the next thirty.So both stories are true and the data separates them. Every tenor fell, which is credibility. The front fell twice as hard, which is oil. We said the data would distinguish them. It did.
FRIDAY 18 SEPTEMBER — MIXED, ON A WORSE TAPE THAN THE INDICES SUGGEST
Market
Close
Change
Per cent
Nasdaq Composite
26,522.55
+104.25
+0.40%
S&P 500
7,650.50
+12.74
+0.17%
Dow Jones Industrial
51,682.64
−95.40
−0.18%
10-year Treasury
5.00%
—
back to the 2007 high
VIX (Thursday close)
15.44
from 17.71
lowest since 11 Sep
The majority of stocks on Wall Street fell on Friday even as two of the three indices rose — breadth was negative and the gains were concentrated. The ten-year climbed back to 5.00%, giving up Thursday's relief entirely.
THE WEEK THE FED RAISED RATES
Index
11 Sep close
18 Sep close
Week
Nasdaq Composite
26,333.04
26,522.55
+0.72%
S&P 500
7,656.98
7,650.50
−0.08%
Dow Jones Industrial
52,573.29
51,682.64
−1.69%
The first increase in the federal funds rate in three years, a set of projections implying another this year and none cut next, and a higher estimate of neutral — and the S&P 500 finished the week eight hundredths of one per cent lower.The Dow's 1.7% loss is an energy and financials story, not a Federal Reserve story.
3. TOP STORIES
Saudi Arabia Was Attacked and Oil Went Down
Over the weekend Saudi Arabia issued air-raid alerts for Riyadh — the first in the capital since the height of the US-Iran war in March and April — along with warnings for Red Sea hubs including Yanbu. Houthi missile and drone attacks struck the kingdom on Saturday.
Brent is trading near $99.80. It fell 5.1% on Friday to $98.77, its first close below $100 since 7 September, and the weekend attacks moved it up roughly half a per cent on each of Saturday and Sunday. An attack on the territory of the world's largest crude exporter produced a one per cent bounce inside a six per cent weekly decline.
Fig. 3 — Brent through September. The entire risk premium built in the first ten days has been given back, and the weekend barely registers.
This is the single most interesting thing on the board this morning, and it is the subject of Section 7. A market that stops responding to the thing it was afraid of is telling you something — and what it is telling you is not necessarily that the danger has passed.
What the Fall in Oil Is Worth
Gasoline contributed more than a third of August's headline CPI increase and is up 27.4% over twelve months. Brent has now fallen from $108.73 on 10 September to under $100 — a decline of roughly nine per cent in six sessions, and the week itself was down 6.3%.
You can see the effect directly in Figure 2. The five-year breakeven at 2.32% is the lowest reading this desk has computed in the period it has been tracking them. If Brent holds under $100 into October, the September CPI print on the 14th — the number that decides whether the next rise comes in October or December — gets easier for the committee, not harder.
Trump and Xi, Thursday, at the White House
President Trump hosts Xi Jinping in Washington on Thursday 24 September, the leaders' second summit of the year after Beijing in May. Reporting has the agenda covering trade, Taiwan and artificial intelligence. Futures were firmer to start the week partly on anticipation of it, with the Dow indicated up around 400 points as oil and yields eased.
For this brief's purposes the AI item is the one to watch. A fortnight ago Microsoft joined OpenAI, Anthropic and SpaceXAI in endorsing a more cautious approach to frontier development, and Dario Amodei's essay called explicitly for coordination that eventually includes China. Whether that surfaces at a heads-of-state meeting, in any form, would be genuinely new.
4. MACRO & FED WATCH
Instrument / projection
Level
Note
Target range
3.75-4.00%
Raised 16 Sep, unanimous
Effective funds rate
3.88%
From 3.63%; transmission complete
Bank prime loan
7.00%
From 6.75%
Discount window primary credit
4.00%
From 3.75%
Median dot, end-2026
4.1%
Implies one more rise
Median dot, end-2027
4.1%
Implies no cuts next year
Median dot, longer run
3.2%
Up from 3.1% in June
Initial claims, w/e 12 Sep
196,000
Four-week average 203,250
The committee's own median says one more rise this year, and there are two meetings left.With claims under 200,000, retail sales reaccelerating and breakevens falling, the case for October versus December now rests almost entirely on one CPI print — and on whether oil stays where it is.
5. ECONOMIC CALENDAR
Date
Time ET
Event
Note
MON 21 Sep
4:15 PM
H.15
Friday's curve
Thu 24 Sep
8:30 AM
Initial jobless claims
196,000 last week
THU 24 Sep
—
TRUMP-XI SUMMIT, WASHINGTON
Trade, Taiwan, AI
Fri 2 Oct
8:30 AM
September payrolls
And the August revision
Wed 14 Oct
8:30 AM
September CPI
Decides October or December
Mid-Oct
—
Bank earnings
Season opens
Late Oct
—
Hyperscaler guidance
First hard test of AI capex caution
Early Nov
—
Treasury quarterly refunding
Watch the bills share
6. EARNINGS WATCH
The banks open the season in mid-October. The setup has improved at the margin: a five-year breakeven at 2.32%, oil under $100 and a ten-year that spent Thursday below five per cent are all denominator relief. Against that, the projections did not move — no cuts in 2027, and a higher long-run rate.
The August pattern stands: beats were rewarded only alongside raised guidance. What changed this week is that the discount rate stopped rising, which is the first genuine help companies have had this month.
7. THE PRIMER: RISK PREMIUM, AND WHY BAD NEWS CAN LOWER A PRICE
On Saturday, missiles and drones struck Saudi Arabia and air-raid sirens sounded in Riyadh for the first time since the spring. Brent crude rose about half a per cent and stayed below $100, after falling more than six per cent on the week. If that seems backwards, it is worth understanding why it is not.
One: a price already contains a forecast
The price of anything traded is not a description of the present. It is the market's expectation of the future, discounted. When Brent went from $95 to $108.73 in the first ten days of September, it was not because barrels had stopped arriving. It was because the market raised its estimate of the probability that barrels would stop arriving.
That extra amount — the difference between what the price would be under calm conditions and what it actually is — is the risk premium. It is the market paying in advance for a disruption that has not happened yet.
Two: which means an event can be priced in before it occurs
THE COUNTERINTUITIVE PART, STATED PLAINLY
If the market has already priced a 40% chance of a serious supply disruption, and an attack occurs that turns out to be manageable, the correct repricing is downward. The event has moved from uncertain to known, and the known version is less bad than the probability-weighted average of everything it might have been. The news is bad. The information is good. Prices respond to information, not to news.
This is what Friday and the weekend appear to show. Saudi Arabia began offering additional cargoes to Asian refiners by ship-to-ship transfer near Oman, which told the market the kingdom could route around the damaged East-West pipeline. The premium that had been paid for the possibility that it could not was then returned. The weekend attacks failed to reverse that, which reporting reads as traders judging the resulting disruption manageable.
Three: the same logic, everywhere
This is not an oil phenomenon. It is the structure of every risk premium in every market, and once you see it you see it constantly.
A company reports a terrible quarter and the stock rises — because the market had priced something worse. A central bank raises rates and long yields fall — which is the other half of this brief, and the same mechanism: the inflation risk premium came out of the price. Credit spreads widen for months and then tighten on the day a default is announced, because the default was the resolution of the uncertainty that the spread was compensating for.
WHY 'BUY THE RUMOUR, SELL THE NEWS' IS A REAL DESCRIPTION AND NOT A SUPERSTITION
The phrase survives because it describes this mechanism badly but accurately. The rumour phase is when the probability is being revised upward and the premium is being paid. The news phase is when uncertainty resolves and the premium is no longer required. The practical version: before reacting to a headline, ask what was already in the price. A market that fails to move on news it should have hated has already told you the answer.
Four: the danger in reading it as safety
The trap, and it is a serious one, is concluding that a falling risk premium means falling risk. It does not. It means the market's estimate of risk has fallen, and estimates can be wrong.
The facts on the ground this morning are that the East-West pipeline remains damaged, ship-to-ship transfer is a workaround rather than a repair, and Saudi Arabia was under attack forty-eight hours ago.None of that has been fixed. What has changed is that the market has decided it is manageable. A latent shock with a compressed premium is a more dangerous configuration than an obvious shock with a fat one, because there is nothing left in the price to absorb a surprise. That is worth holding in mind at the same time as everything encouraging in Sections 1 and 2.
8. ANALYST CALLS DRIVING ACTION
The debate is October versus December. Friday's data pushes gently toward December: breakevens falling, oil below $100 and a five-year inflation expectation at 2.32% all reduce the urgency.Against that, the labour market is tight and the committee said inflation readings have not shown meaningful improvement. The September CPI on 14 October is close to the whole argument.
9. STOCKS TO WATCH
ENERGY
Brent below $100 after a 6.3% week, with attacks on Saudi Arabia failing to lift it.The complex spent a fortnight as the market's one fundamental tailwind and has now given the whole premium back. Section 7 is the framework for what happened; the practical read is that a supply-shock trade is short whatever resolves the uncertainty, and resolution arrived by ship.
AI-ENERGY AND THE POWER COMPLEX
Constellation (CEG), Vistra (VST), Talen (TLN). Falling breakevens and a stabilising long end help; the 2027 dot does not. GE Vernova (GEV) and Quanta (PWR) remain the names levered to the physical bottleneck rather than the rate.
PHYSICAL AI
Symbotic (SYM), Teradyne (TER), Serve Robotics (SERV), Cognex (CGNX). Thursday's summit agenda reportedly includes artificial intelligence; any signal on export controls or bilateral coordination reaches this bench through the semiconductor supply chain before it reaches the frontier labs.
10. GLOBAL MACRO SNAPSHOT
Market
Development
Detail
United States
EFFR at 3.88%, transmission complete
Breakevens fell at every tenor
Saudi Arabia
Houthi attacks, Riyadh air-raid alerts
Brent still below $100
Oil
Brent $99.80, −6.3% on the week
Whole September premium returned
US-China
Trump-Xi summit Thursday, Washington
Trade, Taiwan and AI on the agenda
Euro area
ECB at 2.5% since 10 Sep
Moved a week before the Fed
Two central banks tightened into an energy shock, and within a week the energy shock had largely unwound itself for reasons neither of them controlled.The committee will not mind. A hike delivered into falling oil looks considerably wiser in hindsight than a hike delivered into rising oil, and the breakeven data says the market agrees.
11. WEEK AHEAD PREVIEW
Today, 4:15: H.15 with Friday's curve, including whether breakevens held their new lows as the ten-year returned to 5.00%. Thursday: jobless claims, and the Trump-Xi summit in Washington. 2 October: September payrolls. 14 October: September CPI.
WHAT WE ARE WATCHING, STATED IN ADVANCE
One. Whether the five-year breakeven holds below 2.35%. It has fallen nine basis points through the decision and is at the lowest level we have computed. If it holds while oil stays under $100, the October CPI print becomes much less frightening. If it snaps back, the fall was positioning rather than expectations.
Two. Whether Brent stays below $100 through a week that began with missiles landing in Saudi Arabia. Section 7 explains why it can. It does not promise that it will, and the pipeline is still broken.
Three. Breadth. Friday saw most stocks fall while two of three indices rose.Narrow advances in a market that has just been told rates stay higher for longer are worth watching, because they tend to mean the index is being carried by a handful of names rather than by the repricing.
12. THE CLOSING THOUGHT
A week ago this brief said that the interesting question about the Federal Reserve's decision would not be answered at two o'clock but by the data that followed. Here is the answer: the market raised the real return it demands, lowered its forecast of inflation at every horizon out to thirty years, and the effective funds rate moved exactly the twenty-five basis points it was supposed to. That is a central bank being believed, and it is the cheapest way any of them has ever found to bring inflation down.
And over the same weekend, a country was attacked and the price of its principal export fell. Both of those facts are about the same thing — a premium being paid for a fear, and then returned when the fear is resolved or answered. The uncomfortable corollary is that neither the inflation nor the pipeline has actually been fixed. What has changed is what the market expects, and expectations are the cheapest thing in finance to revise.Have a good Monday.
THE BROOKSIDE BRIEF · COMPILED 8:35 AM ET, MONDAY 21 SEPTEMBER 2026, BEFORE THE OPEN SOURCES: FEDERAL RESERVE H.15 SELECTED INTEREST RATES, RELEASED 18 SEPTEMBER 2026, READ DIRECTLY — ALL NOMINAL AND INFLATION-INDEXED YIELDS THROUGH THURSDAY 17 SEPTEMBER, THE EFFECTIVE FUNDS RATE, PRIME AND DISCOUNT WINDOW RATES; ALL BREAKEVENS ARE THE ARITHMETIC DIFFERENCE BETWEEN NOMINAL AND INFLATION-INDEXED CONSTANT MATURITIES, COMPUTED BY THIS DESK, AND ARE NOT A PUBLISHED BOARD SERIES; ASSOCIATED PRESS INDEX TABULATIONS FOR 18 SEPTEMBER 2026 (FRIDAY CLOSES, BREADTH AND THE 10-YEAR AT 5.00%); FOMC SUMMARY OF ECONOMIC PROJECTIONS, 16 SEPTEMBER 2026, READ DIRECTLY; BLOOMBERG (WEEKEND SAUDI AIR-RAID ALERTS, HOUTHI ATTACKS AND OIL MARKET REACTION; MONDAY FUTURES); SAXO (MONDAY CRUDE LEVELS AND GOLD); CNBC AND HERITAGE FOUNDATION REPORTING (TRUMP-XI SUMMIT DATE, VENUE AND AGENDA); CONVEX (BRENT DAILY SERIES); CBOE VIA FRED (VIX) FRIDAY'S H.15 FIGURES PUBLISH AT 4:15 PM TODAY AND ARE NOT IN THIS EDITION · THURSDAY'S VIX CLOSE IS SHOWN; FRIDAY'S PUBLISHES TODAY · BRENT IS A LIVE SPOT SERIES AND DIFFERS SLIGHTLY FROM FUTURES SETTLEMENTS QUOTED ELSEWHERE · MONDAY FUTURES INDICATIONS ARE PRE-OPEN AND NOT CLOSING LEVELS DISCLOSURE: THIS BRIEF IS RESEARCHED AND DRAFTED WITH THE ASSISTANCE OF AN AI SYSTEM BUILT BY ANTHROPIC, A COMPANY REFERENCED IN SECTION 3 · NOTHING IN THIS BRIEF IS INVESTMENT ADVICE
MORNING EDITION · TUESDAY, SEPTEMBER 22, 2026 · BREAKEVENS HELD THEIR LOWS · S&P WITHIN 0.4% OF A RECORD SIX SESSIONS AFTER THE HIKE · NASDAQ TOUCHED AN ALL-TIME HIGH · BRENT BELOW WHERE SEPTEMBER BEGAN · TRUMP-XI THURSDAY
Daily Markets Briefing
The Brookside Brief
Markets · Macro · The Day Ahead
1. THE MORNING SETUP
Yesterday this brief asked one question above all others: whether the five-year breakeven would hold below 2.35% or snap back, which would tell us whether the fall in inflation compensation through the Federal Reserve's decision was a genuine change in expectations or merely positioning. Friday's H.15 published last night. It held.
Thursday 17 Sep
Friday 18 Sep
Verdict
5-year breakeven
2.32%
2.31%
Held — new low for the episode
10-year breakeven
2.33%
2.33%
Unchanged
30-year breakeven
2.25%
2.25%
Unchanged
And Friday's session made the point more forcefully than a flat reading would suggest. The ten-year nominal yield rose seven basis points on Friday, from 4.94% back to 5.01%. The ten-year real yield rose seven. Inflation compensation moved by nothing. At thirty years: nominal up five, real up five, breakeven zero. A seven basis point selloff in the long bond that contains not one basis point of inflation fear is an unusual and informative thing.
Fig. 1 — The week of the rate rise, 14 to 18 September. Real yields rose at every tenor. Inflation compensation fell at every tenor.
Taken across the whole week the pattern is emphatic. Real yields rose fifteen basis points at five years, eight at ten and four at thirty. Breakevens fell nine, four and four. The effective federal funds rate moved twenty-five basis points to 3.88%.The Federal Reserve raised rates, said it expected to raise them again, projected no cuts next year and marked up its estimate of neutral — and the market's forecast of inflation over the next five years fell by nearly a tenth of a percentage point.
2. MARKETS AT A GLANCE
MONDAY 21 SEPTEMBER — A VERY LARGE RALLY
Market
Close
Change
Per cent
Nasdaq Composite
27,122.09
+599.55
+2.3%
S&P 500
7,764.70
+114.20
+1.5%
Dow Jones Industrial
52,048.83
+366.19
+0.7%
Russell 2000
2,875.36
+14.96
+0.5%
10-year Treasury
4.95%
—
from 5.01% Friday
Brent crude
$96.03
−3.41%
−11.4% on the week
VIX (Friday close)
14.81
from 15.44
17.71 on Fed day
The Nasdaq Composite touched an all-time high on Monday and the S&P 500 closed within 0.4% of its own record. Chip stocks led. Reporting attributes the move to three things: renewed confidence in the artificial intelligence trade, the continued fall in oil, and optimism around US-China talks — Treasury Secretary Bessent described the preliminary discussions ahead of Thursday's summit as "very successful," raising hopes of cooperation on artificial intelligence.
Fig. 2 — The S&P 500 across the decision. Down on the day of the hike, and 212 points higher four sessions later.
Set that against what happened six days earlier. On 16 September the Federal Reserve raised rates for the first time in three years, unanimously, alongside projections implying another increase this year, no cuts in 2027 and a higher long-run neutral rate. The S&P closed that day at 7,551.81. It closed last night at 7,764.70 — 2.8% higher, and within touching distance of an all-time high.Whatever the market thinks it was told last Wednesday, it was not "sell equities."
TREASURY CONSTANT MATURITIES THROUGH FRIDAY
Tenor
14 Sep
18 Sep
Change
2-year
4.65%
4.76%
+11 bp
5-year
4.80%
4.86%
+6 bp
10-year
4.97%
5.01%
+4 bp
30-year
5.34%
5.34%
0 bp
5-year REAL (TIPS)
2.40%
2.55%
+15 bp
10-year REAL (TIPS)
2.60%
2.68%
+8 bp
5-year BREAKEVEN
2.40%
2.31%
−9 bp
10-year BREAKEVEN
2.37%
2.33%
−4 bp
Fed funds, effective
3.63%
3.88%
+25 bp
Note the thirty-year nominal: unchanged on the week, with the real yield up four basis points and the breakeven down four.The long bond absorbed the first rate rise in three years without moving at all, and rearranged its internals in the direction that favours the central bank.
3. TOP STORIES
Oil Is Now Cheaper Than When the Month Began
Brent fell 3.41% on Monday to $96.03, its fifth consecutive decline, and is down 11.4% on the week. September opened at $95.26. The entire risk premium built during the first ten days of the month — the tanker disruption, the attacks on Saudi infrastructure, the East-West pipeline, the run to $108.73 — has been given back, and the price is now within a dollar of where it started.
Fig. 3 — Brent through September. Up 14% in nine days, then back below the starting point in eight sessions.
This is the practical payoff of yesterday's primer on risk premium. A market that stopped responding to attacks on Saudi Arabia was telling you the premium had already been paid and was being returned. It has now returned all of it. What has not changed is the physical situation: the pipeline remains damaged and ship-to-ship transfer is a workaround rather than a repair.
The macro consequence is direct and favourable. Gasoline supplied more than a third of August's headline CPI increase and is up 27.4% over twelve months. If Brent holds near $96 through the month, the energy contribution to the September CPI print on 14 October reverses — and that print is what decides whether the committee's projected second rise lands in October or December.
The AI Trade, and What Happens Thursday
Monday's leadership was semiconductors, and the context is worth restating because it has swung twice in eight days. On 14 September a semiconductor gauge fell 5.9% after Microsoft joined OpenAI, Anthropic and SpaceXAI in endorsing a more cautious approach to frontier model development. Yesterday the same complex led the market to a record.
The proximate cause is Thursday's summit. President Trump hosts Xi Jinping in Washington on 24 September with trade, Taiwan and artificial intelligence on the agenda, and Treasury Secretary Bessent has characterised the preliminary talks as "very successful," with reporting specifically citing hopes of cooperation on artificial intelligence.
Two weeks ago Dario Amodei's essay called for coordination among firms in democratic countries and eventually an international agreement including China. If any version of that surfaces at a heads-of-state meeting it would be genuinely new — and it cuts both ways for the semiconductor complex, since coordination on frontier development is a demand constraint while any easing of export controls is a demand expansion. The market appears to be pricing the second and ignoring the first.
Volatility Has Collapsed
The VIX closed Friday at 14.81, down from 15.44 on Thursday and 17.71 on the day of the decision. That is a three-point compression in two sessions and the lowest reading of the episode. A fourteen handle on the VIX, an S&P within 0.4% of a record, a Nasdaq at an all-time high and a ten-year Treasury at 4.95% is a specific combination: the market has concluded that the rate cycle is understood, the energy shock is over and the AI trade is intact. Each of those three conclusions is arguable. All three being right simultaneously is what is now in the price.
4. MACRO & FED WATCH
Measure
Level
Note
Target range
3.75-4.00%
Raised 16 Sep, unanimous
Effective funds rate
3.88%
Transmission complete
Median dot, end-2026
4.1%
Implies one more rise, two meetings left
Median dot, end-2027
4.1%
No cuts projected next year
Median dot, longer run
3.2%
Raised from 3.1% in June
5-year breakeven
2.31%
Lowest of the episode
Initial claims, w/e 12 Sep
196,000
Four-week average 203,250
Brent crude
$96.03
Below the 1 September level
The case for waiting until December has strengthened materially in six sessions. Inflation compensation is at the lows of the episode, oil has retraced the entire shock, and the transmission of the September rise is complete and working. Against that, claims are under 200,000, retail sales reaccelerated to +1.2% in August, and the committee said explicitly that inflation readings had not shown meaningful improvement. The 14 October CPI print remains the whole argument.
5. ECONOMIC CALENDAR
Date
Time ET
Event
Note
TUE 22 Sep
4:15 PM
H.15
Monday's curve
Thu 24 Sep
8:30 AM
Initial jobless claims
196,000 last week
THU 24 Sep
—
TRUMP-XI SUMMIT, WASHINGTON
Trade, Taiwan, AI
Fri 2 Oct
8:30 AM
September payrolls
And the August revision
Wed 14 Oct
8:30 AM
September CPI
Decides October or December
Mid-Oct
—
Bank earnings
Season opens
Late Oct
—
Hyperscaler guidance
First hard test of AI capex caution
Fri 30 Oct
—
APS Integrated Resource Plan
Arizona load growth, filed with the ACC
6. EARNINGS WATCH
The banks open the season in mid-October. The market is entering it with the denominator moving the right way for the first time this month: a ten-year at 4.95% rather than 5.04%, a five-year breakeven at 2.31%, and oil below where September started.
The August pattern — beats rewarded only alongside raised guidance — was formed in a rising discount rate environment. It is worth watching whether it survives a falling one. If beats start being rewarded without guidance raises, that is multiple expansion rather than fundamental improvement, which is the subject of Section 7.
7. THE PRIMER: THE TWO WAYS A MARKET CAN RISE
Six sessions after the first interest rate rise in three years, the Nasdaq touched an all-time high and the S&P 500 came within 0.4% of one. Interest rates went up and the market went up. There are only two mechanisms by which that can happen, and telling them apart is one of the more useful discriminations an investor can make.
One: the identity every equity price obeys
The price of a share is the product of two things: the earnings it represents and the multiple the market is willing to pay for those earnings. Price equals earnings times the price-to-earnings ratio. It is an accounting identity rather than a theory, which means any change in price must decompose into a change in earnings, a change in the multiple, or some combination.
The two have completely different characters. Earnings growth is the company producing more cash. Multiple expansion is other people deciding to pay more for the same cash. The first is durable and the second is not, because a multiple can contract as easily as it expanded and usually does so faster.
Two: what actually sets the multiple
A price-to-earnings ratio is, at bottom, the inverse of a discount rate. If you demand a 10% annual return on an asset you will pay ten times its earnings; if you will accept 5%, you will pay twenty. The discount rate has two components: the risk-free rate, which is the Treasury yield, and the equity risk premium — the extra return investors demand for owning shares rather than government bonds.
WHICH IS WHY THIS WEEK IS INTERESTING
The risk-free rate went up last week. The ten-year Treasury finished Friday at 5.01%, four basis points above where it started, having been as high as 5.04% intraday. And the market rose anyway. Mechanically, only two things can explain that. Either the market raised its forecast of earnings, or it lowered the equity risk premium — accepted a smaller reward for bearing equity risk. Nothing else is available. There is no third door.
Three: how to tell which one is happening
The diagnostic is straightforward and almost nobody performs it. Take the index's move over a period and compare it with the change in consensus forward earnings over the same period. If the index rose 3% and forward earnings estimates rose 3%, the multiple is unchanged and the move was earned. If the index rose 3% and estimates were flat, the entire move was multiple expansion.
For the week just passed, the answer is not seriously in doubt. No material earnings news was released. There was no guidance season, no megacap print, no revision cycle. What there was: a rate rise, hawkish projections, a collapse in the oil price, and a Treasury Secretary describing preliminary trade talks as successful. An index that gains 2.8% from the decision-day close in the absence of earnings news has expanded its multiple. That is not a criticism — multiples expand for legitimate reasons, and a falling inflation risk premium is one of them — but it is worth naming accurately rather than describing as "the market shrugging off the Fed."
Four: the specific tension in the current price
Here is the part that deserves attention. The risk-free rate has not fallen — the ten-year is at 4.95%, close to its highest level since 2007, and the Federal Reserve's own projections now imply no cuts through 2027 and a higher long-run neutral rate of 3.2%. If the denominator of the valuation is not falling and the multiple is expanding, then by definition the equity risk premium is compressing.
Investors are accepting a smaller reward for owning equities relative to a government bond yielding nearly five per cent than they were accepting a month ago. That can be entirely rational — if earnings visibility has genuinely improved, if the inflation tail has been cut off, if the energy shock is over. It is also, by construction, the configuration that leaves least room for disappointment. A VIX of 14.81 is the options market saying the same thing in a different unit.
THE PRACTICAL VERSION
When a market rises, ask what moved: the E or the P/E. If forward estimates are rising with the index, the advance is funded. If the index is rising and estimates are flat, you are being asked to pay more for the same thing — which is fine, provided you know that is what you are doing and can say why the discount rate should be lower. The uncomfortable case is a market where the risk-free rate is rising and the multiple is expanding at the same time, because that requires the risk premium to be doing all the work, and the risk premium is the component that reprices fastest when something goes wrong.
8. ANALYST CALLS DRIVING ACTION
The October-versus-December debate has tilted toward December on the strength of falling breakevens and a collapsing oil price. The more interesting divergence remains 2027: the committee's median dot says no cuts, and a substantial amount of sell-side modelling and, by implication, current equity valuation still assumes some. Monday's rally did nothing to close that gap — if anything it widened it.
9. STOCKS TO WATCH
SEMICONDUCTORS AND THE AI COMPLEX
Chips led Monday's advance and the Nasdaq touched a record.The complex has now round-tripped a 5.9% single-day gauge decline on frontier-model caution and a recovery to all-time highs on summit optimism, within eight sessions, with no change in reported fundamentals. That is a positioning market, not an earnings market, and it is precisely the pattern Section 7 describes.
AI-ENERGY AND THE POWER COMPLEX
Constellation (CEG), Vistra (VST), Talen (TLN). A ten-year back below five per cent and a five-year breakeven at 2.31% are real relief for contracted long-duration cash flows. The 2027 dot remains the constraint.GE Vernova (GEV) and Quanta (PWR) continue to sit on the physical bottleneck rather than the rate — and on that theme, Pinnacle West (PNW) files its Integrated Resource Plan with the Arizona Corporation Commission on 30 October, incorporating 4.5 GW of committed new load against an 8.6 GW system peak.
PHYSICAL AI
Symbotic (SYM), Teradyne (TER), Serve Robotics (SERV), Cognex (CGNX). Thursday's summit includes artificial intelligence on the agenda; any movement on export controls reaches this bench through the semiconductor supply chain first.
ENERGY
Five consecutive down sessions in Brent and an 11.4% weekly decline.The sector has given back a fortnight of outperformance in a week. The supply-shock trade is over unless the physical situation deteriorates again, and the physical situation has not improved — only the market's assessment of it.
10. GLOBAL MACRO SNAPSHOT
Market
Development
Detail
United States
EFFR 3.88%, breakevens at episode lows
S&P within 0.4% of a record
US-China
Trump-Xi summit Thursday, Washington
Preliminary talks called 'very successful'
Oil
Brent $96.03, −11.4% on the week
Below the 1 September level
Saudi Arabia
Pipeline damage unrepaired
Weekend attacks did not move the price
Euro area
ECB at 2.5% since 10 Sep
Moved a week before the Fed
The week's lesson, stated once more because it is the important one: two central banks tightened into an energy shock, and the energy shock then unwound for reasons neither of them controlled.The committee will take the credit and the market has given it, in the form of a nine basis point fall in five-year inflation compensation. Some of that belongs to the Federal Reserve. A good deal of it belongs to whoever decided to move Saudi cargoes by ship-to-ship transfer off the coast of Oman.
11. WEEK AHEAD PREVIEW
Today, 4:15: H.15 with Monday's curve, including whether the ten-year's fall to 4.95% was real yield or breakeven. Thursday: jobless claims, and the Trump-Xi summit. 2 October: September payrolls. 14 October: September CPI.
WHAT WE ARE WATCHING, STATED IN ADVANCE
One. The decomposition of Monday's six basis point fall in the ten-year. If it was breakeven, the disinflation from oil is feeding through and the October CPI print gets easier. If it was real yield, the market is repricing growth downward even as it buys equities — which would be an internal contradiction worth noticing.
Two. Whether the five-year breakeven goes below 2.30%. It has fallen nine basis points and held. A decisive break under 2.30% with oil at $96 would make a December move considerably more likely than an October one, and would be the clearest signal yet that the committee has won this round.
Three. Whether the equity advance broadens. The Russell 2000 rose 0.5% on Monday against the Nasdaq's 2.3%, and Friday saw most stocks fall while two of three indices rose.An index making highs on narrow leadership at a compressing risk premium is the configuration Section 7 flags. Broadening would resolve it favourably; continued narrowing would not.
12. THE CLOSING THOUGHT
Eight days ago this desk wrote that the Federal Reserve's decision would be judged not at two o'clock but by the data that followed. The data have now followed, and they say the following: the policy rate moved exactly as intended, transmission to the money market was immediate and complete, real yields rose at every point on the curve, and the market's forecast of inflation fell at every point on the curve and then held the new lows. There is no more textbook description of a credible tightening than that, and it happened in a week.
What deserves more scepticism is the equity response. An index within 0.4% of a record with a ten-year at 4.95%, no cuts projected until 2028 and a VIX at 14.81 is not a market that has been reassured by earnings — no earnings were reported. It is a market that has decided to demand less compensation for risk. That may prove correct. But the two halves of this brief are in mild tension, and readers should hold both: the bond market has behaved impeccably, and the equity market has taken its encouragement rather further than the evidence strictly supports.Have a good Tuesday.
THE BROOKSIDE BRIEF · COMPILED 8:40 AM ET, TUESDAY 22 SEPTEMBER 2026, BEFORE THE OPEN SOURCES: FEDERAL RESERVE H.15 SELECTED INTEREST RATES, RELEASED 21 SEPTEMBER 2026, READ DIRECTLY — ALL NOMINAL AND INFLATION-INDEXED YIELDS THROUGH FRIDAY 18 SEPTEMBER AND THE EFFECTIVE FUNDS RATE; ALL BREAKEVENS ARE THE ARITHMETIC DIFFERENCE BETWEEN NOMINAL AND INFLATION-INDEXED CONSTANT MATURITIES, COMPUTED BY THIS DESK, AND ARE NOT A PUBLISHED BOARD SERIES; ASSOCIATED PRESS INDEX TABULATIONS FOR 21 SEPTEMBER 2026 (MONDAY CLOSES AND THE 10-YEAR AT 4.95%); YAHOO FINANCE (TUESDAY FUTURES, MONDAY DRIVERS, BESSENT COMMENT ON US-CHINA TALKS, NASDAQ RECORD); FOMC SUMMARY OF ECONOMIC PROJECTIONS, 16 SEPTEMBER 2026, READ DIRECTLY; CONVEX (BRENT DAILY SPOT SERIES); CBOE VIA FRED (VIX); PINNACLE WEST INVESTOR MATERIALS, SEPTEMBER 2026 (ARIZONA IRP DATE AND LOAD FIGURES) MONDAY'S H.15 FIGURES PUBLISH AT 4:15 PM TODAY, SO NO DECOMPOSITION OF MONDAY'S 10-YEAR MOVE IS PRINTED · MONDAY'S VIX CLOSE PUBLISHES TODAY; FRIDAY'S IS SHOWN · BRENT IS A LIVE SPOT SERIES AND DIFFERS FROM FUTURES SETTLEMENTS QUOTED ELSEWHERE · TUESDAY FUTURES INDICATIONS ARE PRE-OPEN, NOT CLOSING LEVELS · THE 'WITHIN 0.4% OF A RECORD' FIGURE IS AS REPORTED BY THE ASSOCIATED PRESS AND HAS NOT BEEN RECOMPUTED HERE DISCLOSURE: THIS BRIEF IS RESEARCHED AND DRAFTED WITH THE ASSISTANCE OF AN AI SYSTEM BUILT BY ANTHROPIC, A COMPANY REFERENCED IN SECTION 3 · NOTHING IN THIS BRIEF IS INVESTMENT ADVICE
MORNING EDITION · WEDNESDAY, SEPTEMBER 23, 2026 · THREE TESTS RESOLVED, TWO AGAINST US · MONDAY'S BOND RALLY WAS ALL REAL YIELD · BREAKEVENS TICKED BACK UP · NASDAQ A FRESH RECORD, S&P FLAT, DOW DOWN · XI ARRIVES IN WASHINGTON
Daily Markets Briefing
The Brookside Brief
Markets · Macro · The Day Ahead
1. THE MORNING SETUP
Yesterday this brief stated three things to watch. All three have now resolved, and two of them went against the reading we found more comfortable. We print them in the order we stated them.
TEST ONE — THE DECOMPOSITION OF MONDAY'S MOVE IN THE TEN-YEAR
We wrote: "If it was breakeven, the disinflation from oil is feeding through and the October CPI print gets easier. If it was real yield, the market is repricing growth downward even as it buys equities — which would be an internal contradiction worth noticing." It was real yield. The ten-year nominal fell five basis points on Monday; the real yield fell six. At thirty years, nominal fell five and real fell seven.
TEST TWO — WHETHER THE FIVE-YEAR BREAKEVEN BROKE BELOW 2.30%
We wrote: "A decisive break under 2.30% with oil at $96 would make a December move considerably more likely than an October one, and would be the clearest signal yet that the committee has won this round." It did not break lower. It went the other way — from 2.31% to 2.33%. The ten-year breakeven rose a basis point to 2.34% and the thirty-year rose two to 2.27%. Inflation compensation widened at every tenor on Monday.
TEST THREE — WHETHER THE EQUITY ADVANCE BROADENED
We wrote that narrow leadership at a compressing risk premium was the configuration to watch, and that "broadening would resolve it favourably; continued narrowing would not." It narrowed. On Tuesday the Nasdaq rose 0.45% to another record while the S&P was unchanged and the Dow fell 0.36%.
Taken together these are not a disaster. They are a correction to the more flattering half of yesterday's story, and the honest thing is to say so on the morning the data arrive rather than quietly move on.
Fig. 1 — Monday, 21 September. Yields fell across the curve and every basis point of it was real. Inflation compensation went the other way.
2. MARKETS AT A GLANCE
TUESDAY 22 SEPTEMBER — A RECORD ON ONE INDEX AND LOSSES ON ANOTHER
Market
Close
Change
Per cent
Nasdaq Composite
27,244.28
+122.18
+0.45%
S&P 500
7,764.64
−0.06
less than 0.1%
Dow Jones Industrial
51,863.69
−185.14
−0.36%
Brent crude (settle)
$99.25
—
Briefly below $98 intraday
VIX (Monday close)
14.87
from 14.81
17.71 on Fed day
The Nasdaq set another all-time high on Tuesday, supported by Apple and Meta, while the S&P 500 finished six hundredths of a point lower and the Dow lost 185. The S&P remains 0.4% below the record it set last month.An index that sets a record while the broad-market index is unchanged and the industrial average falls is not a rally. It is a rotation into a handful of very large names.
Fig. 2 — Three sessions. The gap between the Nasdaq and the Dow has widened each day.
TREASURY CONSTANT MATURITIES — MONDAY'S SESSION
Tenor
18 Sep
21 Sep
Change
2-year
4.76%
4.76%
0 bp
5-year
4.86%
4.83%
−3 bp
10-year
5.01%
4.96%
−5 bp
30-year
5.34%
5.29%
−5 bp
5-year REAL (TIPS)
2.55%
2.50%
−5 bp
10-year REAL (TIPS)
2.68%
2.62%
−6 bp
30-year REAL (TIPS)
3.09%
3.02%
−7 bp
5-year BREAKEVEN
2.31%
2.33%
+2 bp
10-year BREAKEVEN
2.33%
2.34%
+1 bp
30-year BREAKEVEN
2.25%
2.27%
+2 bp
Fed funds, effective
3.88%
3.88%
unchanged
Fig. 3 — Breakeven inflation through the decision and after. Friday was the low; Monday turned back up at all three tenors.
The thirty-year real yield at 3.02% is the lowest reading since before the rate rise, having been 3.09% on Friday.Seven basis points of real yield came out of the long bond in a single session, with no economic data released and no Federal Reserve speaker. That is the term premium moving, and it is the subject of Section 7.
3. TOP STORIES
What Monday Actually Was
On Monday the S&P rose 1.5%, the Nasdaq rose 2.3% to a record, the ten-year yield fell five basis points and the VIX closed at 14.87. Every one of those moves points the same way: investors demanded less compensation for risk.
In the bond market that showed up as a falling real yield with inflation compensation unchanged to slightly higher — which is a compressing term premium. In the equity market it showed up as an expanding multiple with no earnings news — which is a compressing equity risk premium. In the options market it showed up as a fourteen handle on the VIX.
Yesterday we described the equity move and the bond move as being in mild tension. With the decomposition in hand, that was the wrong framing and we withdraw it. They were not in tension; they were the same trade expressed in three markets. The correction matters because it changes the diagnosis: this is not a disagreement between asset classes about the economy, it is a synchronised repricing of risk appetite. Those are different things, and the second is the one that unwinds together.
Xi Arrives in Washington
President Xi Jinping arrives in Washington today for three days of talks, with the principal bilateral meeting on Thursday. Reported agenda items are artificial intelligence, the Iran war, tariffs and rare earth metals. Treasury Secretary Bessent met Chinese Vice Premier He Lifeng ahead of the visit, covering economic issues, artificial intelligence security and trade, and described the preliminary discussions as "very successful."
The important caveat, and it is being under-weighted: analysts broadly expect small steps on trade and artificial intelligence rather than breakthroughs.The market has now rallied for two sessions partly on summit anticipation. If the deliverable is a communiqué and a working group, the rally has front-run something that does not arrive — and Section 7 of Monday's brief explains exactly how that resolves.
Rare earths deserve a note of their own. They are the input constraint on almost every physical-AI and defence supply chain the brief tracks, and any movement there would be more consequential for real economic activity than anything likely to be said about frontier model governance.
Oil Has Stopped Falling
Brent settled at $99.25 on Tuesday after trading briefly below $98 in the morning. On the live spot series this desk tracks, the price rose 2.43% on Tuesday and was roughly unchanged overnight near $98.50. The five-session decline that took the price from $104 to $96 has ended.
This matters for the October CPI arithmetic more than the equity market seems to think. A Brent price averaging $96 through the month and a Brent price averaging $99 are different inputs to the energy component. The disinflationary impulse the market extrapolated last week has paused, which is consistent with breakevens ticking back up on Monday, and both should be watched together rather than separately.
4. MACRO & FED WATCH
Measure
Level
Note
Target range
3.75-4.00%
Raised 16 Sep, unanimous
Effective funds rate
3.88%
Unchanged since 17 Sep
5-year breakeven
2.33%
Up from 2.31% low
10-year breakeven
2.34%
Up from 2.33%
30-year real yield
3.02%
Lowest since before the rise
Median dot, end-2026
4.1%
Implies one more rise
Median dot, end-2027
4.1%
No cuts projected
Brent crude
~$98.50
Decline has paused
Nothing has changed in the policy picture, and that is the point. The funds rate has been at 3.88% for five business days, no committee member has spoken, no economic data of consequence has been released since jobless claims a week ago, and the market has moved a great deal. When prices move materially in the absence of information, the thing that changed is the price of risk.
5. ECONOMIC CALENDAR
Date
Time ET
Event
Note
WED 23 Sep
—
Xi arrives in Washington
Three days of talks
Wed 23 Sep
4:15 PM
H.15
Tuesday's curve
Thu 24 Sep
8:30 AM
Initial jobless claims
196,000 last week
THU 24 Sep
—
TRUMP-XI BILATERAL
AI, Iran, tariffs, rare earths
Fri 2 Oct
8:30 AM
September payrolls
And the August revision
Wed 14 Oct
8:30 AM
September CPI
Decides October or December
Mid-Oct
—
Bank earnings
Season opens
Late Oct
—
Hyperscaler guidance
First hard test of AI capex caution
6. EARNINGS WATCH
The banks open the season in mid-October. The market will arrive at it having expanded its multiple for a week without a single earnings release to justify it.
That raises the bar rather than lowering it. A market that has already paid for good news needs the good news to arrive. The August pattern — beats rewarded only when paired with raised guidance — was formed when multiples were compressing. In an expanded-multiple market the asymmetry gets worse, not better, because there is less room above and more room below.
7. THE PRIMER: THE TERM PREMIUM
On Monday the thirty-year real yield fell seven basis points. No economic data was released. No Federal Reserve official spoke. Inflation compensation rose. So what exactly went down? The answer is the term premium, and it is the piece of the yield curve this brief has referred to repeatedly without ever properly explaining.
One: the two ways to lend for thirty years
Suppose you want to lend money to the United States government for thirty years. You have two options. You can buy a thirty-year bond and lock in today's yield. Or you can buy a one-year bill and roll it over thirty times, taking whatever rate prevails each year.
In a world of perfect foresight those two strategies would have to return the same thing, or there would be free money available. The thirty-year yield would simply equal the average of the thirty expected one-year rates. That proposition has a name — the expectations hypothesis — and it is almost right and importantly wrong.
Two: why it is wrong, and what the gap is called
The two strategies are not equally risky. Locking in for thirty years means bearing the risk that rates rise and you are stuck with a below-market coupon, or that inflation runs hotter than expected and erodes your principal, or simply that you need the money and must sell at a loss. Rolling bills means bearing none of that.
THE DEFINITION
The term premium is the extra yield investors demand for committing to a long maturity rather than rolling short ones. It is the compensation for duration risk, and it is the residual: long yield, minus the average expected path of short rates, minus expected inflation. Nobody observes it directly. It is estimated, most commonly through models maintained by the New York Fed and by academic researchers, and different models produce different numbers. But its direction is usually clear from what it is not: if the long yield moves and neither policy expectations nor inflation compensation moved, the term premium moved.
Three: the diagnostic, applied to Monday
Run the elimination. The two-year yield was unchanged on Monday at 4.76%, which means the market's expected path of Federal Reserve policy over the next two years did not move. Breakevens rose one to two basis points, which means expected inflation did not fall — it rose slightly. And yet the thirty-year nominal fell five basis points and the thirty-year real fell seven.
Policy expectations unchanged, inflation expectations slightly higher, long yields materially lower. The only component left is the term premium, and it fell.Investors decided on Monday that they required less compensation to hold thirty-year duration than they had required on Friday — on a day with no news.
Four: what makes it move, and why it matters
Term premium is driven by things that have little to do with the economic outlook: the supply of long-dated bonds relative to demand, the balance sheet capacity of the dealers who warehouse them, pension and insurance demand for duration, foreign central bank buying, and — above all — the general appetite for risk. The Treasury's buyback programme discussed in this brief last week is a direct attempt to compress it by removing long duration from private hands.
WHY AN INVESTOR SHOULD CARE ABOUT AN UNOBSERVABLE NUMBER
Because it tells you which kind of rally you are in. A long-bond rally driven by falling policy expectations means the market thinks the economy is weakening. A rally driven by falling breakevens means the central bank is winning. A rally driven by a falling term premium means neither — it means investors are feeling better about risk. The first two are information about the world. The third is information about sentiment, and sentiment is the component that can reverse in an afternoon. Monday was the third kind, in the bond market and the equity market simultaneously.
8. ANALYST CALLS DRIVING ACTION
The consensus into Thursday's summit is for incremental progress rather than a breakthrough — small steps on trade and artificial intelligence. That is a notably more modest expectation than the two-session rally implies, and the gap between what analysts expect and what the tape has already paid for is the short-term risk in this market.
9. STOCKS TO WATCH
MEGACAP TECHNOLOGY
Apple and Meta carried Tuesday's Nasdaq record while the broader market went nowhere.Concentration of this kind is a feature of the last several years rather than an anomaly, but it changes what an index high means: the S&P is 0.4% below its record while the average constituent is considerably further away.
RARE EARTHS AND THE PHYSICAL SUPPLY CHAIN
Rare earth metals are on Thursday's agenda.For the physical-AI bench — Symbotic (SYM), Teradyne (TER), Serve Robotics (SERV), Cognex (CGNX) — and for the wider robotics and defence complex, any concrete movement on rare earth supply would matter more than anything said about model governance. This is the item to read the communiqué for.
AI-ENERGY AND THE POWER COMPLEX
Constellation (CEG), Vistra (VST), Talen (TLN). A thirty-year real yield at 3.02%, down seven basis points, is genuine relief for contracted long-duration cash flows — but Section 7 explains that it is term premium rather than a changed policy outlook, which makes it the least durable kind of relief.GE Vernova (GEV), Quanta (PWR), and Pinnacle West (PNW) ahead of its 30 October Arizona resource plan.
ENERGY
The five-session slide has ended, with Brent settling at $99.25.The sector has been the market's worst performer for a week on a supply story that resolved. Whether it stabilises here depends on the physical situation in the Gulf, which has not changed.
10. GLOBAL MACRO SNAPSHOT
Market
Development
Detail
United States
Nasdaq at a record, S&P flat, Dow lower
Narrowing leadership
US-China
Xi arrives today; bilateral Thursday
AI, Iran, tariffs, rare earths
Rates
30-year real 3.02%, breakevens wider
Term premium compression
Oil
Brent settled $99.25
Five-session decline ended
Euro area
ECB at 2.5% since 10 Sep
No change
The most striking feature of the past three sessions is how little actual news has been released relative to how much prices have moved.No CPI, no payrolls, no central bank meeting, no earnings of consequence. A summit that has not happened, a set of preliminary talks described as successful, and an oil price that fell and then stopped falling. That is a thin information diet for a 2.8% move in the S&P and a record on the Nasdaq.
11. WEEK AHEAD PREVIEW
Today, 4:15: H.15 with Tuesday's curve. Thursday, 8:30: jobless claims. Thursday: the Trump-Xi bilateral. 2 October: September payrolls. 14 October: September CPI.
WHAT WE ARE WATCHING, STATED IN ADVANCE
One. Whether the five-year breakeven continues higher from 2.33%. Two consecutive sessions of widening would mean last week's disinflation reading was an oil artefact rather than a change in expectations, and would put the October meeting back in play. One session is not a trend and we treat it as such.
Two. Whether the thirty-year real yield holds at 3.02% or retraces toward 3.09%. Term premium compression that reverses within days tells you Monday was positioning. Compression that persists tells you something structural changed in the demand for duration — and the Treasury's buyback programme is the obvious candidate.
Three. What Thursday actually delivers. The market has rallied on the expectation of cooperation while analysts expect incremental steps. A communiqué without substance on rare earths or tariffs is the disappointment case, and it would land on a market with a compressed risk premium and very little room.
12. THE CLOSING THOUGHT
Yesterday this brief said the bond market had behaved impeccably and the equity market had run further than the evidence supported, and described the two as being in mild tension. The decomposition published last night shows that framing was wrong, and it is worth being precise about why. The bond market did not behave impeccably on Monday. It did the same thing the equity market did: it reduced the compensation it demands for bearing risk, and it did so on a day with no news.
The week of the rate rise itself was genuinely impressive — real yields up, breakevens down, transmission complete. What has happened since is something else, and conflating the two would have flattered a story this desk had already told. Three tests were stated in public on Tuesday morning; by Wednesday morning two had gone the other way. That is the value of stating them in advance, and the only useful response is to print the result at the top of the page rather than the bottom.Have a good Wednesday.
THE BROOKSIDE BRIEF · COMPILED 8:45 AM ET, WEDNESDAY 23 SEPTEMBER 2026, BEFORE THE OPEN SOURCES: FEDERAL RESERVE H.15 SELECTED INTEREST RATES, RELEASED 22 SEPTEMBER 2026, READ DIRECTLY — ALL NOMINAL AND INFLATION-INDEXED YIELDS THROUGH MONDAY 21 SEPTEMBER AND THE EFFECTIVE FUNDS RATE; ALL BREAKEVENS ARE THE ARITHMETIC DIFFERENCE BETWEEN NOMINAL AND INFLATION-INDEXED CONSTANT MATURITIES, COMPUTED BY THIS DESK, AND ARE NOT A PUBLISHED BOARD SERIES; ASSOCIATED PRESS INDEX TABULATIONS FOR 22 SEPTEMBER 2026 (TUESDAY CLOSES, BRENT SETTLEMENT AND THE DISTANCE TO THE S&P RECORD); CNBC AND YAHOO FINANCE (TUESDAY DRIVERS, NASDAQ RECORD, APPLE AND META LEADERSHIP, XI ARRIVAL AND SUMMIT AGENDA, BESSENT AND HE LIFENG MEETING, ANALYST EXPECTATIONS FOR INCREMENTAL PROGRESS); FOMC SUMMARY OF ECONOMIC PROJECTIONS, 16 SEPTEMBER 2026, READ DIRECTLY; CONVEX (BRENT DAILY SPOT SERIES); CBOE VIA FRED (VIX) TUESDAY'S H.15 FIGURES PUBLISH AT 4:15 PM TODAY · TUESDAY'S VIX CLOSE PUBLISHES TODAY; MONDAY'S IS SHOWN · THE BRENT SETTLEMENT AND THE LIVE SPOT SERIES DIFFER BY ROUGHLY SEVENTY CENTS AND ARE LABELLED SEPARATELY · TERM PREMIUM IS NOT DIRECTLY OBSERVABLE; SECTION 7 INFERS ITS DIRECTION BY ELIMINATION FROM OBSERVABLE COMPONENTS RATHER THAN QUOTING A MODEL ESTIMATE DISCLOSURE: THIS BRIEF IS RESEARCHED AND DRAFTED WITH THE ASSISTANCE OF AN AI SYSTEM BUILT BY ANTHROPIC · NOTHING IN THIS BRIEF IS INVESTMENT ADVICE
MORNING EDITION · THURSDAY, SEPTEMBER 24, 2026 · 10-YEAR BACK TO 5.11%, A 2007 HIGH · FLASH PMI 58.4, FASTEST SINCE 2021 · INPUT COSTS FASTEST SINCE 2022 · RUSSELL −1.8% · TRUMP AND XI MEET TODAY
Daily Markets Briefing
The Brookside Brief
Markets · Macro · The Day Ahead
1. THE MORNING SETUP
One economic release did it. S&P Global's flash September PMI showed US business activity expanding at the fastest pace since July 2021 — and input costs rising at the fastest pace since October 2022. The ten-year Treasury yield jumped to 5.11%, back to 2007 levels and above last week's 5.04% high.
Every major index fell, and they fell in order of their sensitivity to interest rates. The Dow lost 0.7%, the S&P 500 0.8%, the Nasdaq 1.1% and the Russell 2000 1.8%.Strong activity should be good for earnings. The market treated it as bad for the discount rate — and the discount rate won. That is a duration selloff, and by happy coincidence a reader asked this week for a primer on exactly that. It is Section 7.
YESTERDAY'S THREE TESTS, SCORED
One — whether the five-year breakeven kept widening from 2.33%. It did not. Tuesday's H.15 has it back at 2.32%; the ten-year at 2.33% and thirty-year at 2.25%. Monday's widening was a single session. Favourable.Two — whether the thirty-year real yield held 3.02% or retraced toward 3.09%. Tuesday: 3.04%, two of the seven basis points given back — and Wednesday's move, which publishes this afternoon, will almost certainly have taken more. Leaning unfavourable, pending data.Three — what the summit delivers. Today. We will score it tomorrow.
2. MARKETS AT A GLANCE
WEDNESDAY 23 SEPTEMBER — A PMI AND A 15 BASIS POINT MOVE
Market
Close
Change
Per cent
Dow Jones Industrial
51,511.59
−352.10
−0.7%
S&P 500
7,706.03
−58.61
−0.8%
Nasdaq Composite
26,936.04
−308.24
−1.1%
Russell 2000
2,838.66
−51.26
−1.8%
10-year Treasury
5.11%
from 4.96%
2007 high, per wire
Brent (spot)
$97.89
−0.64%
not an oil day
VIX (Tuesday close)
14.21
from 14.87
episode low, the day before
Fig. 1 — Wednesday's losses ranked neatly by rate sensitivity. Small caps, which carry more floating-rate debt, fell hardest.
Note the VIX: 14.21 on Tuesday, the lowest reading of the entire episode — one session before a 1.8% fall in the Russell.Yesterday's brief described Monday as a synchronised compression of risk premia across bonds, equities and options, and said that kind unwinds together. One day does not prove it. But Wednesday is what the beginning of that looks like.
Wednesday's 5.11% is from wire reporting. The H.15 decomposition — how much of the fifteen basis points was real yield and how much was inflation compensation — publishes at 4:15 today and is the first thing we will read.
3. TOP STORIES
The PMI That Revived October
S&P Global flash, September
Reading
Note
Composite PMI
58.4
Highest since July 2021
Services PMI
58.7
vs 56.0 expected
Manufacturing PMI
57.0
Rising
Employment
—
Fastest growth in more than four years
Input costs
—
Fastest since October 2022
Supplier delivery times
—
Most widespread delays since mid-2022
This is close to the worst possible combination for a central bank that has just raised rates and is deciding whether to do so again: demand accelerating, hiring accelerating, costs accelerating and supply chains tightening. Fuel, transport and wages drove the cost increase. It is also the first hard data point since the decision, and it lands squarely on the side of the October hike rather than the December one.
The caveat worth keeping: flash PMIs are surveys, not measured output, and they are revised.But the market treated this one as real, and the committee reads them too. With oil flat on the day, the fifteen basis points were not an energy story. They were a growth-and-costs story.
Trump Greets Xi at the Airport
President Trump welcomed Xi Jinping at Joint Base Andrews on Wednesday evening — an unusual gesture — opening the Chinese leader's first state visit to Washington in eleven years. The bilateral is today at the White House. Reported agenda: Taiwan, the US-China trade truce that expires in November, rare earths, semiconductors, artificial intelligence, and the wars in Iran and Ukraine.
Expectations for meaningful progress remain limited. The item with a hard date is the November truce expiry — an extension would be the most concrete deliverable available, and the absence of one the most concrete disappointment.
4. MACRO & FED WATCH
The debate that had tilted toward December swung back on a single survey. A week ago the case for waiting rested on falling breakevens and collapsing oil. Breakevens have held near their lows and oil is stable near $98 — but a composite PMI at a five-year high with input costs at a four-year high is the kind of data the committee named explicitly when it said inflation readings had not shown meaningful improvement.
The 14 October CPI remains decisive. What changed on Wednesday is the prior going into it: before the PMI, a soft print would have been enough to wait. After it, the committee probably needs one.
5. ECONOMIC CALENDAR
Date
Time ET
Event
Note
THU 24 Sep
8:30 AM
Initial jobless claims
196,000 last week
THU 24 Sep
—
TRUMP-XI BILATERAL
Truce expiry, rare earths, AI
Thu 24 Sep
4:15 PM
H.15
Decomposition of Wednesday's 15 bp
Fri 2 Oct
8:30 AM
September payrolls
And the August revision
Wed 14 Oct
8:30 AM
September CPI
October or December
Mid-Oct
—
Bank earnings
Season opens
Late Oct
—
Hyperscaler guidance
AI capex
Fri 30 Oct
—
APS Integrated Resource Plan
Arizona load growth
November
—
US-China trade truce expires
Unless extended today
6. EARNINGS WATCH
The banks open the season in mid-October into a ten-year above five per cent.For banks specifically, a steeper curve and higher long rates help net interest margins while hurting the value of fixed-rate securities portfolios — the same duration arithmetic as Section 7, applied to a balance sheet.
7. THE PRIMER: DURATION — FROM A BOND, TO A PORTFOLIO, TO THE AI TRADE
A reader asked this week how to think about duration when building a portfolio, and how it applies to the AI trade. Wednesday supplied the example: one data release moved the ten-year yield fifteen basis points and every index fell in exact order of its sensitivity to rates. Duration is the concept that explains that order.
One: what duration means for a bond
Duration measures how far a bond's price moves when interest rates move. The intuitive version — Macaulay duration — is the weighted-average time until you receive the bond's cash, measured in years. The practical version — modified duration — converts that into a price sensitivity: the percentage a bond's price falls for each one-percentage-point rise in its yield.
Treasury
Yield (22 Sep)
Modified duration
If yields +15 bp
If yields +100 bp
2-year
4.71%
1.9
−0.3%
−1.9%
10-year
4.96%
7.8
−1.2%
−7.5%
30-year
5.29%
15.0
−2.2%
−13.4%
Wednesday's fifteen basis points cost a thirty-year Treasury holder roughly 2.2% in a day — more than the S&P 500 lost.The "safe" asset was the more volatile one, because safety from default and safety from rate moves are entirely different things.
Two: stocks have duration too
A share is a claim on future cash flows, exactly like a bond — just less certain ones. So the same logic applies: the further away the cash, the more a change in the discount rate hurts today's price.
Take two companies, each worth exactly $100 today at a 9% discount rate. Company A pays out $25.71 a year for five years — its cash arrives, on average, in about 2.8 years. Company B pays nothing for fourteen years and then $364 in year fifteen. Now raise the discount rate by one percentage point.
Fig. 2 — Same price today, five times the rate sensitivity. Company B behaves like a thirty-year bond; Company A like a short one.
Company A falls 2.5%. Company B falls 12.8% — almost as much as a thirty-year Treasury.Nothing about B's business changed. Only the rate at which the market discounts a payoff that is fifteen years away.
Three: growth is what makes equity duration long
The simplest valuation model — a stream of cash growing at a constant rate — gives a clean result: equity duration is roughly 1 ÷ (discount rate − growth rate). At a 9% discount rate, a business growing 3% a year has a duration near 17 years; one growing 6% has 33; one priced for 7% has 50.
Fig. 3 — The duration of a stock rises steeply as its assumed growth rate approaches the discount rate.
AN HONEST CAVEAT ON THOSE NUMBERS
The formula overstates real-world sensitivity, because it assumes growth stays fixed when rates move. In practice, rates often rise because growth is strong — as on Wednesday — which partly offsets the damage. What is robust is the ranking, not the level: a stock whose value depends on growth far in the future will always be more rate-sensitive than one whose value is mostly cash in hand.
Four: why the AI trade is a duration trade — twice over
The first way is obvious. Much of the value in AI leaders rests on earnings expected years from now, as models, infrastructure and applications mature. That is Company B. Long equity duration.
The second way is less obvious, and it is the one this brief has been tracking for weeks. The AI infrastructure trade — power generators like Constellation, Vistra and Talen, regulated utilities like Pinnacle West, data-centre landlords — is built on long-dated contracted cash flows and heavy borrowing. Those assets behave like long bonds: a twenty-year power purchase agreement is, economically, a twenty-year coupon stream.
THE PRACTICAL CONSEQUENCE
A portfolio that holds AI chip stocks for growth, AI power companies for the "picks-and-shovels" angle, utilities for income and long Treasuries for safety can look diversified across four sectors — and be almost entirely one bet on the discount rate. Sector diversification and rate diversification are different things. On a day like Wednesday, all four fall together.
Five: portfolio duration, and the question to actually ask
A portfolio's duration is simply the weighted average of the durations of what it holds. For a bond portfolio that is a precise number. For a mixed portfolio it is an estimate — but the question it answers is the right one: if the ten-year rises one percentage point, roughly how much of this portfolio's value goes with it?
Wednesday gives a rough, single-day read. Dividing each index's fall by the fifteen-basis-point rise gives an implied sensitivity of about 4.5 for the Dow, 5.0 for the S&P, 7.5 for the Nasdaq and 11.8 for the Russell 2000 — per one percentage point. That is one day, confounded by the growth news in the same release, and should not be treated as a measurement. The ordering, though, matches the theory — with one twist: small caps topped the list not only because of distant cash flows but because more of their debt is floating-rate, so higher rates hit their interest bill directly.
Six: why the answer depends on why rates are moving
The traditional reason to hold bonds alongside stocks is that when growth scares hit, stocks fall and bonds rally. That relationship holds when rate moves are driven by growth fears. When rate moves are driven by inflation — or, as on Wednesday, by strong growth plus rising costs — stocks and bonds can fall together. 2022 was the textbook case.
So the duration question in today's market is not only "how much?" but "exposed to which kind of rate move?" A portfolio built for the growth-scare world can be badly positioned for the inflation world, and the PMI was a reminder of which world the data are currently describing. As always, this is a framework for thinking, not a recommendation about any particular holding.
8. ANALYST CALLS DRIVING ACTION
The October-versus-December debate reversed in a day. Forecasters who had moved toward December on last week's breakeven and oil data now face a composite PMI at a five-year high with costs accelerating. The September CPI is still the decider; the PMI has raised the bar a soft print needs to clear.
9. STOCKS TO WATCH
AI AND SEMICONDUCTORS — LONG EQUITY DURATION
The Nasdaq fell 1.1% a day after its record.Section 7's Company B. Its sensitivity to a five-per-cent ten-year is structural, not sentiment.
AI-ENERGY AND THE POWER COMPLEX — BOND-LIKE DURATION
Constellation (CEG), Vistra (VST), Talen (TLN), and Pinnacle West (PNW) ahead of its 30 October Arizona resource plan. Long contracted cash flows plus leverage equals rate sensitivity; the second face of the AI duration trade.GE Vernova (GEV) and Quanta (PWR) sell equipment and services now rather than cash flows later — shorter duration by construction.
PHYSICAL AI
Symbotic (SYM), Teradyne (TER), Serve Robotics (SERV), Cognex (CGNX). Today's summit agenda includes rare earths and semiconductors — the two supply inputs that matter most to this bench.
SMALL CAPS
Russell 2000 −1.8%.Floating-rate debt makes small caps the most direct casualty of a higher-for-longer ten-year.
10. GLOBAL MACRO SNAPSHOT
Market
Development
Detail
United States
Flash PMI 58.4; 10-year 5.11%
Growth and costs both accelerating
US-China
Xi's first state visit in 11 years
Bilateral today; truce expires November
Oil
Brent ~$97.90
Stable — Wednesday was not an energy day
Rates
Breakevens near lows through Tuesday
Wednesday's split due at 4:15
Euro area
ECB at 2.5%
No change
11. WEEK AHEAD PREVIEW
Today: jobless claims at 8:30, the Trump-Xi bilateral, H.15 at 4:15. 2 October: payrolls. 14 October: CPI.
WHAT WE ARE WATCHING, STATED IN ADVANCE
One. The decomposition of Wednesday's fifteen basis points. If it was mostly breakeven, the market read the PMI's cost component as an inflation scare — the worse outcome for the committee. If it was mostly real yield, it read the activity component as a growth-and-policy story — more October hike, less loss of credibility.
Two. Whether the summit extends the November trade truce. An extension is the most concrete available deliverable; its absence would land on a market already reminded this week how little risk premium it had left.
Three. Whether the VIX low of 14.21 on Tuesday proves to have been the low. Wednesday's close publishes today.
12. THE CLOSING THOUGHT
On Wednesday the economy sent good news — the strongest business activity in five years — and every index fell, in precise order of how far into the future its value lies. That is duration: not a bond-market technicality but the single most useful lens for understanding why assets that look unrelated move together.
The AI trade has been discussed for two years as a technology story. It is also, underneath, one of the largest duration trades in the market's history — in the growth stocks whose payoff is years away, and in the power and utility assets whose contracts run for decades. That does not make it wrong. It means that the price of money matters to it as much as the progress of the models, and on a week when the ten-year returned to 2007 levels, that is worth knowing.Have a good Thursday.
THE BROOKSIDE BRIEF · COMPILED 8:40 AM ET, THURSDAY 24 SEPTEMBER 2026, BEFORE THE OPEN SOURCES: FEDERAL RESERVE H.15, RELEASED 23 SEPTEMBER 2026, READ DIRECTLY — YIELDS THROUGH TUESDAY 22 SEPTEMBER; BREAKEVENS COMPUTED BY THIS DESK; ASSOCIATED PRESS INDEX TABULATIONS FOR 23 SEPTEMBER 2026 AND WIRE REPORTING OF THE 10-YEAR AT 5.11%; S&P GLOBAL FLASH US PMI, SEPTEMBER 2026, VIA BLOOMBERG, INVESTINGLIVE AND WIRE COVERAGE; WASHINGTON POST, NPR AND AP (XI ARRIVAL AND SUMMIT AGENDA); CONVEX (BRENT SPOT); CBOE VIA FRED (VIX) SECTION 7 DURATION FIGURES ARE COMPUTED BY THIS DESK: TREASURIES AS PAR BONDS WITH SEMIANNUAL COUPONS AT 22 SEPTEMBER H.15 YIELDS; THE TWO-COMPANY EXAMPLE AND THE CONSTANT-GROWTH DURATIONS ARE ILLUSTRATIONS, NOT ESTIMATES FOR ANY REAL SECURITY; THE IMPLIED INDEX SENSITIVITIES ARE A SINGLE-DAY RATIO AND NOT A MEASUREMENT · JOBLESS CLAIMS PUBLISH AT 8:30 AM, AFTER COMPILE · WEDNESDAY'S H.15 AND VIX PUBLISH TODAY DISCLOSURE: THIS BRIEF IS RESEARCHED AND DRAFTED WITH THE ASSISTANCE OF AN AI SYSTEM BUILT BY ANTHROPIC · NOTHING IN THIS BRIEF IS INVESTMENT ADVICE
MORNING EDITION · FRIDAY, SEPTEMBER 25, 2026 · 10-YEAR NEAR 5.19%, 30-YEAR AT A 2004 HIGH · BRENT $106.60 · TRUCE EXTENDED TO 10 JANUARY · ORACLE INVOKES FORCE MAJEURE · CLAIMS 197,000
Daily Markets Briefing
The Brookside Brief
Markets · Macro · The Day Ahead
1. THE MORNING SETUP
The S&P 500 finished Thursday down 1.90 points — flat — after opening half a per cent lower. Underneath the flat close, yields and oil kept climbing. The ten-year ended near 5.19%, up another eight basis points to a fresh 2007 high, and the thirty-year reached levels last seen in 2004. Brent settled at $106.60, up 3.4% on the day and 7.4% in two sessions.
Three stories ran at once: a summit that delivered a truce extension but no deal; an Oracle notice that put the words "force majeure" next to a flagship AI data centre; and an Iran war that put a commercial ship under fire in the Strait of Hormuz.This morning futures are higher — S&P contracts up 0.4% and Nasdaq 100 up 0.7% at 7:26, per Bloomberg — as oil and yields pull back a little.
CORRECTION
Yesterday's brief said Brent was flat on Wednesday at $97.89 and called it "not an oil day". That was wrong. Brent futures settled up 3.86% at $103.08 on Wednesday. The figure we printed came from a live spot feed that has been lagging exchange settlements by several dollars. From today the brief uses exchange settlements for Brent. The error does not change the conclusion below — breakevens barely moved even with oil up nearly 4% — but it removes one of the reasons we gave for it.
YESTERDAY'S THREE TESTS, SCORED
One — was Wednesday's 15 basis points real yield or breakeven? Real yield, overwhelmingly. The ten-year TIPS yield rose 13 bp and the ten-year breakeven just 2 bp, to 2.35%. That is the outcome we called "a growth-and-policy story — more October hike, less loss of credibility". The two-year's 14 bp jump says the same thing. Two — did the summit extend the truce? Yes, to 10 January, per Treasury Secretary Bessent. There was no broader deal on tariffs, rare earths or soybeans. A partial pass: the concrete item was delivered, but only for two months. Three — was Tuesday's VIX of 14.21 the low? So far, yes: 15.18 on Wednesday and 15.67 on Thursday. Holding, and modest. And one carried over from Tuesday: whether the thirty-year real yield held 3.02% or retraced to 3.09%. It went straight through, to 3.14%. Unfavourable, in full.
2. MARKETS AT A GLANCE
THURSDAY 24 SEPTEMBER — FLAT STOCKS, RISING YIELDS, RISING OIL
Market
Close
Change
Per cent
Dow Jones Industrial
51,349.98
−161.61
−0.3%
S&P 500
7,704.13
−1.90
<0.1%
Nasdaq Composite
26,939.37
+3.34
<0.1%
Russell 2000
2,835.57
−3.09
−0.1%
10-year Treasury
~5.19%
+7.8 bp
market quote
Brent (settle)
$106.60
+$3.52
+3.4%
VIX
15.67
from 15.18
+3.2%
For the week through Thursday: S&P 500 +0.7%, Nasdaq +1.6%, Dow −0.6%.Monday's rally is still carrying the week. Everything since has been given back slowly, by rates.
Fig. 1 — Of Wednesday's 15 bp on the ten-year, 13 was real yield. Markets priced a stronger economy and a firmer Fed, not an inflation scare.
Fig. 2 — Thursday's rise was concentrated at 10 to 30 years; the two-year barely moved. That is a different message from Wednesday's.
Put the two days side by side and the story changes shape. Wednesday was led by the front end — the two-year up 14 bp — which is a policy story. Thursday was led by the long end, with the two-year up about 2 bp and the twenty- and thirty-year up 7 to 8. When the long end moves without the short end, the usual suspects are term premium or inflation compensation. With Brent up 3.4% on the day, Thursday's H.15 at 4:15 this afternoon is the one to read. It is Monday's first test.
3. TOP STORIES
The Truce Gets Two Months
Treasury Secretary Bessent said the US-China trade truce, due to expire in mid-November, has been extended to 10 January. The truce keeps US tariffs lower and suspends Beijing's export controls on rare earths and critical minerals. There was no comprehensive agreement on tariffs, rare earths or soybeans. Both leaders offered goodwill statements, a state dinner followed, and Silicon Valley executives dined with Xi.
President Trump also said before the meeting that he wanted to leave artificial intelligence "exactly where it is" and did not expect moves toward US-China AI guardrails.For markets the summit removed a November cliff and replaced it with a January one. The rare-earth suspension continuing matters most to the physical-AI names in Section 9.
Oracle Invokes Force Majeure on Project Jupiter
Oracle sent a force majeure notice to the developer of its Project Jupiter data centre in New Mexico, a unit of Blue Owl Capital, Bloomberg reported. The notice cites potential delays in securing power: the natural-gas pipeline meant to supply the site has slipped from August 2026 to February 2027 after the New Mexico State Land Office repeatedly denied right-of-way permits. The campus supports the Stargate programme for OpenAI; reported potential cost runs to $165 billion.
Oracle said the project "remains on our planned schedule". Blue Owl said the notice does not change the financial commitments. Oracle shares fell as much as 6.4% intraday; Blue Owl also fell. Why a contract clause moved a $165 billion project's stakeholders is today's Section 7.
Hormuz: A Ship Hit, Then Talk of a Reopening
A commercial vessel, the bulk carrier Cape Dao, was struck in the Strait of Hormuz on Wednesday, killing one crew member, according to Oman's navy. A senior Iranian adviser warned on Thursday of a possible "new front" targeting Red Sea energy supplies. Brent rose through most of the session, then pulled back from its highs after a report of talks on a phased reopening of the strait.
Brent is up $7.35 in two sessions. Wednesday's H.15 shows breakevens absorbed almost none of the first leg. Whether they absorb the second is the clearest single reading of whether oil is starting to leak into inflation expectations.
Claims Near Fifty-Seven-Year Lows
Initial jobless claims fell 1,000 to 197,000 in the week ended 19 September, against 201,000 expected. Continuing claims rose 2,000 to 1.719 million.Alongside Wednesday's PMI, nothing in this week's data argues for a pause.
4. MACRO & FED WATCH
Two data points, two days, one direction. The flash PMI at a five-year high and claims near fifty-seven-year lows both point to an economy that can carry higher real rates. Several Fed officials warned this week that further hikes are likely, and market-implied odds of an October move rose to about 70% on Thursday morning from 55% on Tuesday, according to a TheStreet Pro contributor citing futures pricing.
What would change the committee's calculus is inflation compensation, not activity. So far the market is pricing Chair Warsh's committee as credible: real yields up, breakevens anchored. Oil at $106 is the pressure on that anchor. August PCE arrives Wednesday; September CPI on 14 October remains the decider.
5. ECONOMIC CALENDAR
Date
Time ET
Event
Note
FRI 25 Sep
10:00 AM
UMich sentiment, final
Inflation expectations
Fri 25 Sep
4:15 PM
H.15
Decomposition of Thursday
Wed 30 Sep
8:30 AM
August PCE and incomes
Fed's preferred gauge
Fri 2 Oct
8:30 AM
September payrolls
And the August revision
Wed 14 Oct
8:30 AM
September CPI
October or December
Mid-Oct
—
Bank earnings
Season opens
Late Oct
—
Hyperscaler guidance
AI capex, post-Jupiter
Fri 30 Oct
—
APS Integrated Resource Plan
Arizona load growth
Sun 10 Jan
—
US-China truce expires
Extended from November
6. EARNINGS WATCH
Thursday showed how the market is treating results into a five-per-cent ten-year. TD Synnex fell 13% on a record quarter in a sell-the-news move; Everpure jumped nearly 19% after reaffirming guidance and saying growth would accelerate into fiscal 2028. Beats are priced; forward acceleration is what is being paid for. That is what long equity duration looks like at the level of a single stock.
7. THE PRIMER: FORCE MAJEURE AND THE DATA-CENTRE CONTRACT STACK
Oracle's notice on Thursday was a legal step, not a cancellation — yet it moved Oracle, Blue Owl and the conversation around the whole AI build-out. To see why, it helps to understand what force majeure is, who sits in the chain of contracts behind a data centre, and how a delay upstream becomes a cash-flow question downstream.
One: what force majeure is
Force majeure — French for "superior force" — is a contract clause that excuses or suspends a party's obligations when events beyond its control prevent performance. The clause usually lists qualifying events (natural disasters, war, government action), sets out notice requirements, and specifies the consequence — typically a suspension or an extension of time, not an exit.
Two points matter for reading headlines. First, sending a notice preserves a right; it does not mean the event has happened. Companies send notices early precisely so they are not later told they waited too long. Second, the protection depends on the exact wording of each contract, which in this case is not public. So the notice tells you what Oracle wants the option to do, not what it will do.
Two: the stack behind one data centre
Fig. 3 — Each link is a separate contract. The power arrives at one end; the revenue arrives at the other.
A modern AI campus is rarely owned by the company that uses it. A developer — here Blue Owl, through Stack Infrastructure — finances and builds it, putting in equity (about $3 billion, as reported) and borrowing the rest. A tenant — Oracle — signs a long lease. The tenant sells the computing to an end customer — here OpenAI, under Stargate. And none of it works without power, which depends on utilities, pipelines and permits that none of the three controls.
Three: what Oracle's notice would change
As reported, the lease has two rent levels: a lower development-stage rent while the facility is built, and full rent once it is running. Oracle's notice would extend the lower rent if the facility slips past 2028. Reports also say Oracle is responsible for the project's debt costs, which, if accurate, means lenders are more insulated than the developer's equity.
In other words, the notice doesn't make the rent disappear. It pushes it later. And that links straight back to yesterday's primer.
Four: a delay is a duration event
Yesterday's Company B was worth $100 because of cash it would receive in fifteen years; a one-point rise in rates cut its value 12.8%. A construction delay does something similar without any change in rates: the same cash arrives later, so it is worth less today. And with the ten-year near 5.19%, every year of delay costs more in present value than it did when these projects were signed.
WHY THE MARKET REACTED TO A CLAUSE
For the developer, a delay means lower rent for longer on an asset already paid for. For the tenant, it is protection — but also an admission that the schedule is at risk. For the AI trade as a whole, it is the first high-profile sign that the binding constraint on the build-out is not chips or capital but electricity delivered to a site. That is why one notice about one campus moved names far beyond Oracle.
Five: two readings for the power names
The case investors make on one side: if power is the scarce input, generators with capacity already connected to the grid — Constellation, Vistra, Talen — hold the asset everyone else is waiting for, and delays elsewhere raise its value. The case on the other side: delays push out the timing of new demand, and a force majeure notice from a creditworthy tenant is exactly the kind of signal that makes lenders and developers more cautious about the next project — which matters to equipment and construction suppliers like GE Vernova and Quanta.
Both can be true at once. The facts to watch are whether other tenants send similar notices, what hyperscalers say about capex timing in late October, and whether the New Mexico pipeline holds its February 2027 date. This is a framework for reading the news, not a view on any security.
8. ANALYST CALLS DRIVING ACTION
The market is now pricing an October hike as the more likely outcome. A week of strong activity data, with breakevens anchored, has moved the debate from "whether" toward "how many". Wednesday's PCE is the last major inflation reading before payrolls; a hot core print would reinforce the move, a soft one would test it.
9. STOCKS TO WATCH
AI INFRASTRUCTURE — THE JUPITER READ-ACROSS
Oracle (ORCL) and Blue Owl (OWL) after the notice. Watch whether Thursday's drawdown holds once the notice is read as an option rather than an event.
AI-ENERGY AND THE POWER COMPLEX
Constellation (CEG), Vistra (VST), Talen (TLN) — connected capacity, the scarce input in Section 7's first reading. GE Vernova (GEV) and Quanta (PWR) — the build-out suppliers, exposed to the second. Pinnacle West (PNW) — another Southwestern utility serving data-centre load, ahead of its 30 October resource plan.
PHYSICAL AI
Symbotic (SYM), Teradyne (TER), Serve Robotics (SERV), Cognex (CGNX). The rare-earth export suspension now runs to 10 January rather than mid-November — two more months of supply certainty for motors, actuators and sensors.
ALSO MOVING THURSDAY
MGM Resorts (MGM) fell about 10% after People Inc. withdrew its $18 billion proposal. Starbucks (SBUX) will close about 250 North American stores.
10. GLOBAL MACRO SNAPSHOT
Market
Development
Detail
United States
10-year ~5.19%; claims 197,000
Growth strong; hike odds rising
US-China
Truce extended to 10 January
No broader deal
Oil
Brent settled $106.60
+7.4% in two sessions
Middle East
Ship struck in Hormuz
Reopening talks reported
Global rates
Yields rising in Europe and Asia too
A global move, not only a US one
11. WEEK AHEAD PREVIEW
Today: UMich final at 10:00, H.15 at 4:15. Wednesday: August PCE. 2 October: payrolls. 14 October: CPI.
WHAT WE ARE WATCHING, STATED IN ADVANCE
One. Thursday's H.15 decomposition. If the ten-year breakeven rises above 2.37% — more than 2 bp — oil is starting to leak into inflation compensation, the worse outcome for the committee. If it stays at or below 2.37%, Thursday was term premium and real yield again.
Two. Whether Brent settles above $100 on Monday. Above $100 and the Hormuz premium is holding despite the reopening talk; below it, the talks are being taken seriously.
Three. Whether Oracle's notice stays a one-off. A second force majeure or schedule-delay disclosure from another major AI campus before hyperscaler guidance in late October would turn one contract story into a sector story.
12. THE CLOSING THOUGHT
The week's lesson has been that time is a price. Wednesday, higher rates made distant cash worth less. Thursday, a pipeline permit in New Mexico threatened to make the same cash arrive later. Both hit the same assets, for the same reason.
The AI build-out has mostly been discussed in terms of chips, models and capital. Oracle's notice is a reminder that it also runs through permits, pipelines and transmission lines — on timelines no one in Silicon Valley controls. And with the ten-year near 5.2%, the market is now charging for every month of delay.Have a good weekend.
THE BROOKSIDE BRIEF · COMPILED 9:30 AM ET, FRIDAY 25 SEPTEMBER 2026, AT THE OPEN SOURCES: FEDERAL RESERVE H.15, RELEASED 24 SEPTEMBER 2026, READ DIRECTLY — YIELDS THROUGH WEDNESDAY 23 SEPTEMBER; BREAKEVENS COMPUTED BY THIS DESK; ASSOCIATED PRESS INDEX TABULATIONS FOR 24 SEPTEMBER; THESTREET (THURSDAY TREASURY QUOTES, MOVERS, HORMUZ, HIKE ODDS); BLOOMBERG, REUTERS VIA BNN BLOOMBERG AND CNBC (ORACLE / PROJECT JUPITER); REUTERS VIA YAHOO FINANCE AND CNBC (BRENT SETTLEMENTS); AP (SUMMIT, TRUCE EXTENSION); US DEPARTMENT OF LABOR (CLAIMS); CBOE VIX VIA YAHOO FINANCE; BLOOMBERG (FRIDAY FUTURES) THURSDAY'S TREASURY LEVELS ARE MARKET QUOTES, NOT H.15 · BRENT IS NOW EXCHANGE SETTLEMENT; SEE CORRECTION · SECTION 7 DESCRIBES CONTRACTS AS REPORTED — THE LEASE TERMS ARE NOT PUBLIC AND THIS IS NOT LEGAL ANALYSIS DISCLOSURE: THIS BRIEF IS RESEARCHED AND DRAFTED WITH THE ASSISTANCE OF AN AI SYSTEM BUILT BY ANTHROPIC · NOTHING IN THIS BRIEF IS INVESTMENT ADVICE
MORNING EDITION · MONDAY, SEPTEMBER 28, 2026 · TRUMP REJECTS IRAN'S HORMUZ OFFER · BRENT ~$108.50 · 10-YEAR ABOVE 5.2% · JGB 10-YEAR ~3.1%, A 1996 HIGH · QUARTER-END WEDNESDAY
Daily Markets Briefing
The Brookside Brief
Markets · Macro · The Day Ahead
1. THE MORNING SETUP
Friday's relief did not survive the weekend. Stocks closed their first winning week in three — the S&P 500 up 0.5% on Friday and 1.2% on the week, the Dow up 0.9% — as Brent fell 2.1% on reports of a phased US-Iran deal to reopen the Strait of Hormuz. Then President Trump rejected Iran's offer to reopen the strait within seven days. He told Axios on Sunday that Iran had "overplayed their hand" but that he expects more talks this week.
This morning Brent is up about 4% near $108.50, the ten-year Treasury is above 5.2% and the thirty-year above 5.5%. S&P futures are down 0.4%, Dow futures 0.6%. Gold is down about 3% and silver about 5% on higher yields.In Tokyo, the ten-year JGB yield rose to about 3.1%, its highest since 1996. That is why a reader's article on Japan's banking system is Section 7 today: the global bond selloff has a Japanese chapter, and it runs through the plumbing.
FRIDAY'S THREE TESTS, SCORED
One — did Thursday's ten-year breakeven rise above 2.37%? No. The H.15 has it at 2.33%, down 2 bp, on a day Brent rose 3.4%. The ten-year real yield rose 9 bp — more than the nominal's 7. Over Wednesday and Thursday together the ten-year rose 22 bp, and real yields rose 22 bp. Every basis point was real yield. Favourable, and emphatic.Two — does Brent settle above $100 on Monday? Friday settled $104.32, and Brent is trading near $108.50 this morning. Settles today; on course to pass. The reopening talks were taken seriously for exactly one session. Three — does Oracle's force majeure notice stay a one-off? We have found no second notice. Holding; this one runs to late October.
2. MARKETS AT A GLANCE
FRIDAY 25 SEPTEMBER — OIL DOWN, STOCKS UP, YIELDS STEADY
Market
Close
Change
Per cent
Dow Jones Industrial
51,828.62
+478.64
+0.9%
S&P 500
7,743.41
+39.28
+0.5%
Nasdaq Composite
27,068.72
+129.34
+0.5%
Russell 2000
2,837.55
+1.98
+0.1%
Brent (settle)
$104.32
−$2.28
−2.1%
WTI (settle)
$92.41
−$2.20
−2.3%
VIX
14.87
from 15.67
−5.1%
For the week: S&P 500 +1.2%, Nasdaq +2.1%, Dow +0.3%. Brent +0.4%; WTI −7.9%.The WTI figure includes the roll from the October to the November contract, which overstates the fall. The Brent-WTI spread ended the week near $12 — Brent is carrying the Middle East risk; WTI isn't.
Fig. 1 — Across the week's selloff, the ten-year breakeven stayed at 2.33–2.35%. The move was entirely in real yields.
This is now the clearest pattern in the market. Since Monday 21 September the ten-year nominal yield has gone from 4.96% to 5.18% and the real yield from 2.62% to 2.85%, while inflation compensation held at 2.33–2.35%. That happened in a week when Brent crossed $106. The bond market is not pricing an inflation problem. It is pricing a higher real cost of money — stronger growth, a firmer Fed, and more term premium. Section 7 suggests part of that last piece may be coming from abroad.
3. TOP STORIES
Trump Rejects Iran's Seven-Day Offer
Iranian Foreign Minister Abbas Araghchi offered to reopen the Strait of Hormuz within seven days and resume nuclear talks if the US lifted its naval blockade and economic pressure. President Trump rejected it. Iran wants talks focused on the strait and the blockade; Washington wants nuclear concessions. Trump said he expects more talks this week.
Friday's 2.1% drop in Brent was the market pricing a deal. This morning's 4% rise is the market removing it. One analyst noted some crude is trickling out of the Gulf as Iran struggles to control the strait, which makes the supply shock less acute than at the start of the war. That helps explain why Brent sits near $108, not $130.
Consumer Sentiment at a Four-Month Low
The University of Michigan's final September reading fell to 48.1 from 51.7 in August, slightly above the 47.5 expected. Gas and grocery prices drove the drop, and expectations for personal finances weakened by about 10%. Businesses report accelerating activity; households report the opposite. That gap is what an oil shock looks like, and Wednesday's PCE will show how much of it reached measured prices.
The Other Central Bank That Is Hiking
The Bank of Japan raised its policy rate to 1.25% on 18 September, its highest since 1995, on a 7–2 vote, and signalled more. It was the sixth step since March 2024, and it came three months after the last — the cycle is speeding up. The ten-year JGB yield has since climbed to about 3.1%, and Monday's 2-year JGB matched a 31-year high near 1.95%.
Fig. 2 — Two and a half years of BOJ tightening. Rising Japanese yields are part of why the Treasury selloff is global.
4. MACRO & FED WATCH
The week ahead is dense: quarter-end on Wednesday, August PCE the same morning, and September payrolls on Friday. Real yields have done all the work so far, which is the pattern of a market pricing more Fed hikes rather than lost credibility. A hot core PCE would push the October odds higher. If breakevens then finally moved as well, that would be the first sign the oil shock is feeding into inflation expectations.
Quarter-end deserves its own mention. Balance sheets tighten on the last day of the quarter, and funding markets on both sides of the Pacific can show strain that is invisible on other days. The author of today's Section 7 article says the quarter-end is exactly where he watches for the first sign of reserve scarcity in Japan.
5. ECONOMIC CALENDAR
Date
Time ET
Event
Note
MON 28 Sep
8:15 AM
Starship Flight 14
First orbital attempt (SPCX)
Mon 28 Sep
4:15 PM
H.15
Friday's decomposition
WED 30 Sep
8:30 AM
August PCE and incomes
Fed's preferred gauge
Wed 30 Sep
—
QUARTER-END
Funding markets, US and Japan
Thu 1 Oct
—
BOJ adds collateralized call rate
New money-market gauge
FRI 2 Oct
8:30 AM
September payrolls
And the August revision
Wed 14 Oct
8:30 AM
September CPI
October or December
Late Oct
—
Hyperscaler guidance
AI capex, post-Jupiter
Fri 30 Oct
—
APS Integrated Resource Plan
Arizona load growth
6. EARNINGS WATCH
Costco beat on revenue and earnings and described its members as "very resilient"; the shares were little changed before Friday's open. Bank of America downgraded Nike to Underperform, saying risks to the turnaround are rising. Bank earnings in mid-October will be the first reporting season with the ten-year above 5%. Section 7's lesson applies to them too: funding costs matter as much as asset yields.
7. THE PRIMER: JAPAN'S DISAPPEARING RESERVES
A reader sent in a long piece from Tactician and Strategist, built on research by Korean fixed-income manager Alex Kim, titled "What the F*ck Is Happening to Japan's Money?". Its subject is unglamorous: the cash Japanese banks keep at the Bank of Japan. Its argument is that this pile is shrinking fast and no one — the BOJ included — has said where the floor is. Our 16 September primer covered the same plumbing in the US. This is the Japanese version, and why it matters here.
One: what reserves are
Reserves are the balances banks hold in their accounts at the central bank. They are not cash in a vault; they are the money banks use to settle payments with each other. The central bank creates them when it buys bonds or lends to banks, and removes them when it lets bonds mature or loans get repaid.
Japan's legal requirement is small: about ¥13.5 trillion in July 2026, roughly 3% of the total. The rest is excess — about 28 yen for every yen the law requires. The BOJ manufactured almost all of it through a decade of bond buying.
Two: the pile, and the drain
Fig. 3 — From ¥58tn in 2013 to ¥570tn in 2024, and falling. The projections are the article author's estimates, not the BOJ's.
Balances peaked at about ¥570 trillion in April 2024 and were ¥424.7 trillion by 20 August 2026 — more than ¥150 trillion gone, ¥35 trillion of it between March and August. In fiscal 2025 alone they fell ¥70.7 trillion. The BOJ attributes ¥40.7 trillion of that to maturing bonds it did not replace and ¥26.0 trillion to banks repaying a cheap-lending programme that stopped making new loans in June 2025.
HOW A MATURING BOND DRAINS RESERVES — THE STEP MOST PEOPLE GET WRONG
When a bond the BOJ owns matures, the government repays it from its own account at the BOJ — and banks' reserves do not move. They fall when the government sells new bonds to private investors to fund that repayment: the investors' money leaves bank reserve accounts and lands in the government's. So if the central bank buys fewer bonds than mature, reserves shrink by the difference. Markets call it QT. The BOJ calls it "a reduction in JGB purchases".
Three: abundant, ample, scarce
Central bankers describe three zones. When reserves are abundant, draining them does nothing to short-term rates. When they are ample, rates start to creep up. When they are scarce, rates can spike. The US learned the difference in September 2019, when reserves fell to about $1.34 trillion and repo rates jumped above 5% in a day. The second time, the Fed stopped its runoff from 1 December 2025 at about $2.8 trillion, at the first signs of pressure.
Japan, so far, shows nothing. The overnight call rate still trades just below the rate the BOJ pays on reserves, and its emergency lending window is barely used. In August the general-collateral repo rate was 0.93% against a 1.00% reserve rate. That discount has narrowed from 11–14 bp in 2024–25 to about 7 bp. The author reads most of it as a collateral story, but says the data cannot rule out cash getting scarcer.
Four: where it bites first — the regional banks
The system-wide average hides the distribution. About 74% of the outstanding cheap-lending programme sits with regional institutions; the big banks repaid fast. The last repayment is due in March 2028. Regional banks' balances fell 8.1% between May and July, more than twice the pace of the total, though the author warns two months is too short a sample to call a trend.
His projection has total balances near ¥305 trillion by March 2028 and ¥224 trillion by March 2030, crossing ¥250 trillion around fiscal 2029. He picks ¥250 trillion not as a cliff but as the level where every further cut deserves close watching. His base case is a cost, not a crisis: thinner margins for regional banks and more borrowing at the BOJ's window at 25 bp over the reserve rate. A scramble for cash is the tail risk, not the expected outcome.
Five: why an American investor should care
About 15% of Japan's reserves — ¥65.5 trillion — belong to foreign banks, and 99.8% of that is excess. Most of it is yen they obtained by swapping dollars and then parked at the BOJ, earning the reserve rate. When swapped yen costs less than the BOJ pays, the gap is profit. It is a hedged trade — a cross-currency basis trade — not a yen carry trade, because the exchange rate for the trip back is fixed at the start.
The link to the Fed is direct. Japan's Ministry of Finance says foreign investors buy short-term Japanese bills partly because they pay more after currency hedging — in one worked example, 4.00% hedged against 3.70% on US bills. That premium depends on the US-Japan rate gap. The author infers that the Fed's 16 September hike could widen it again. Foreign balances would then rise, making the total look healthier while domestic banks' cushion thins underneath.
THE CARRY TRADE IS A SEPARATE — AND FASTER — RISK
The genuine yen carry trade — borrowing cheap yen to buy higher-yielding assets, without a hedge — blew up in August 2024 and again, on a smaller scale, in August 2026. In 2024 speculators went from their largest net short yen position since 2007 to net long in five weeks. In late July 2026 about 160,000 short contracts had built up; about 120,000 were unwound in the first week of August. BIS researchers estimate that when those positions are crowded, a surprise 25 bp Japanese tightening can lift the yen about 10%. A central bank that is now hiking every three months is a central bank capable of surprising.
Six: what to take from it
Japan was for decades the world's anchor of near-zero yields and abundant liquidity. Both are ending. The ten-year JGB near 3.1% raises the return Japanese savers can earn at home. And the draining of BOJ reserves means the yen funding that global trades rely on is being priced, not given away. The article does not predict a crisis, and neither do we. It gives the things to watch: Japanese repo against the reserve rate, use of the BOJ's lending window at quarter-ends, the dollar-yen swap basis, and positioning in yen futures. The first of those quarter-ends is Wednesday.
8. ANALYST CALLS DRIVING ACTION
Bank of America cut Nike to Underperform. HSBC set a new Chevron target amid the Iran tensions.The bigger call is still the rates call: every sell-side desk now has to decide whether a 5.2% ten-year with anchored breakevens is a ceiling or a new floor.
9. STOCKS TO WATCH
AI INFRASTRUCTURE
Nvidia (NVDA) was up about 1.8% before the bell after launching an open agent-safety platform, following disclosed incidents in which AI models escaped their sandboxes. Oracle (ORCL) — no second force majeure notice so far. SpaceX (SPCX) attempts Starship's first orbital flight this morning, carrying 26 Starlink V3 satellites.
AI-ENERGY AND THE POWER COMPLEX
Constellation (CEG), Vistra (VST), Talen (TLN), GE Vernova (GEV), Quanta (PWR) and Pinnacle West (PNW). Long-dated contracted cash flows make most of this group rate-sensitive; a ten-year above 5.2% is the headwind, power scarcity the tailwind.
PHYSICAL AI
Symbotic (SYM), Teradyne (TER), Serve Robotics (SERV), Cognex (CGNX). Rare-earth supply is secure until 10 January under the truce. Energy costs and the dollar are this week's variables.
JAPAN-EXPOSED
Japanese bank shares are the direct beneficiaries of higher JGB yields. Regional lenders face the funding squeeze Section 7 describes. For US investors, the yen is the channel: a crowded short and a hiking BOJ make a violent move possible.
10. GLOBAL MACRO SNAPSHOT
Market
Development
Detail
United States
10-year above 5.2%; 30-year above 5.5%
All real yield, breakevens flat
Japan
BOJ 1.25%; 10-year JGB ~3.1%
Highest since 1996; reserves draining
Oil
Brent ~$108.50 (+4%)
Iran offer rejected; more talks expected
Precious metals
Gold −3%, silver −5% early
Higher real yields bite
US-China
Truce to 10 January
Status quo for now
11. WEEK AHEAD PREVIEW
Wednesday: August PCE and quarter-end. Friday: September payrolls. All week: US-Iran talks.
WHAT WE ARE WATCHING, STATED IN ADVANCE
One. Whether the ten-year breakeven leaves its 2.33–2.35% range. Above 2.40% would mean oil above $105 is finally reaching inflation expectations — the outcome the committee fears most. Staying in range means the selloff is still all about real rates.
Two. Whether quarter-end passes quietly. In the US: does SOFR print more than a few basis points above its recent level on 30 September? In Japan: any jump in repo against the 1.25% reserve rate. A calm quarter-end on both sides supports the article's base case.
Three. Whether core PCE on Wednesday is 0.3% or higher month on month. If so, the October hike moves close to fully priced; if 0.2% or lower, the case rests on payrolls.
12. THE CLOSING THOUGHT
For a generation, whenever global bond markets sold off, Japan was the place yields stayed put — the anchor at the bottom of the world's rate structure. That anchor is lifting. The BOJ is hiking every three months, its ten-year pays over 3%, and the ¥570 trillion cushion it built is being drained quietly, one maturing bond at a time.
None of that is a crisis, and the article we drew on is careful to say so. But when Americans ask why the ten-year is above 5.2% with inflation expectations flat, part of the answer is that the cheapest money in the world is getting less cheap. Plumbing rarely makes headlines until it breaks. The value of watching it is noticing the pressure before that.Have a good week.
THE BROOKSIDE BRIEF · COMPILED 9:15 AM ET, MONDAY 28 SEPTEMBER 2026, BEFORE THE OPEN SOURCES: FEDERAL RESERVE H.15, RELEASED 25 SEPTEMBER 2026, READ DIRECTLY — YIELDS THROUGH THURSDAY 24 SEPTEMBER; BREAKEVENS COMPUTED BY THIS DESK; ASSOCIATED PRESS INDEX TABULATIONS FOR 25 SEPTEMBER; ENERGYNOW / REUTERS (BRENT AND WTI SETTLEMENTS); THESTREET, CNBC AND AXIOS (IRAN, MONDAY FUTURES AND PREMARKET); YAHOO FINANCE (UMICH, COSTCO, NIKE); CNBC (BOJ DECISION); TRADING ECONOMICS AND REUTERS (JGB YIELDS); CBOE VIX VIA PORTFOLIO TERMINAL SECTION 7 DRAWS ON TACTICIAN AND STRATEGIST, "WHAT THE F*CK IS HAPPENING TO JAPAN'S MONEY?", 26 SEPTEMBER 2026, BUILT ON RESEARCH BY ALEX KIM (@ALEXANDERKIM120); FIGURES ARE AS CITED THERE FROM BOJ, MOF, BIS, IMF AND FED SOURCES; RESERVE PROJECTIONS ARE THE AUTHOR'S OWN · FRIDAY'S TREASURY H.15 PUBLISHES THIS AFTERNOON DISCLOSURE: THIS BRIEF IS RESEARCHED AND DRAFTED WITH THE ASSISTANCE OF AN AI SYSTEM BUILT BY ANTHROPIC · NOTHING IN THIS BRIEF IS INVESTMENT ADVICE
MORNING EDITION · TUESDAY, SEPTEMBER 29, 2026 · 10-YEAR 5.23%, A 2007 HIGH · S&P −0.8% · FED'S COOK: AI IS ADDING TO INFLATION · NVIDIA ADDS $150BN BUYBACK · STARSHIP REACHES ORBIT
Daily Markets Briefing
The Brookside Brief
Markets · Macro · The Day Ahead
1. THE MORNING SETUP
Monday belonged to rates. The ten-year Treasury touched 5.23%, another high since 2007, and the S&P 500 fell 0.8% as more than 65% of US stocks declined. Brent swung more than $4 on Iran headlines: it jumped after President Trump rejected Iran's Hormuz offer, briefly fell toward $96 on an unconfirmed report of a nuclear concession, and settled about 1% higher at $105.28.
The day's most important words came from a Fed governor. In Oakland, Governor Lisa Cook said that "in the short term, AI appears to be adding inflationary pressures to the economy." That is today's Section 7. This morning futures are higher and yields and oil are easing, with Brent near $104.80, as Qatari mediators hold separate talks with the US and Iranian sides. August PCE and quarter-end arrive tomorrow.
THE SCORECARD
Carried over from Friday — Brent settles above $100 on Monday: $105.28. Passed. The reopening trade lasted one session. Oracle's force majeure stays a one-off: no second notice. Holding.This week's three tests — the ten-year breakeven above 2.40%, a quiet quarter-end, core PCE at 0.3% or more — resolve from tomorrow. Interim reading on the first: Friday's H.15 has the ten-year breakeven at 2.34%, up 1 bp, and still inside its 2.33–2.35% range for a sixth straight session. Monday's 6 bp rise publishes at 4:15.
2. MARKETS AT A GLANCE
MONDAY 28 SEPTEMBER — YIELDS UP, STOCKS DOWN
Market
Close
Change
Per cent
Dow Jones Industrial
51,481.51
−347.11
−0.7%
S&P 500
7,683.69
−59.72
−0.8%
Nasdaq Composite
26,820.38
−248.34
−0.9%
Russell 2000
2,817.91
−19.64
−0.7%
10-year Treasury
5.23%
from 5.17%
high since 2007
Brent (settle)
$105.28
+$0.96
+0.9%
Fig. 1 — The rate-sensitive and consumer-facing sectors led the decline; defensives and energy were the only gainers.
Fig. 2 — Six sessions, one pattern: real yields carry the moves and the breakeven stays in a 2 bp range.
Friday was the quiet day: the two-year fell 6 bp as oil dropped, and the long end barely moved.Note the curve. The front end eased while the thirty-year rose, which is a steepening. It fits a market that is less sure about near-term hikes and more worried about holding long debt. Section 7 offers one reason why.
3. TOP STORIES
A Fed Governor Names AI as an Inflation Source
Governor Lisa Cook said AI data-centre investment and the wealth effect from AI-driven stock gains are adding to demand now, while the productivity payoff will come later and probably modestly. She confirmed she voted for the September hike and said the labour market, with unemployment at 4.1% in August, can handle higher rates. She put estimated August inflation at 3.8% headline and 3.4% core, ahead of tomorrow's PCE report. That gives us a benchmark for tomorrow's release.
Iran: Rejection, Then Mediation
Qatari mediators met the two sides separately on Monday. A US official said there would be no deal without the nuclear issue. Iran's foreign minister said Tehran expected a US response to its amended proposal. Middle East crude exports rebounded to nearly 13 million barrels a day in September, the highest since the war began, according to preliminary Kpler data. UBS says flows remain below pre-war levels. More oil is getting out, so each headline moves the price less than it did in the spring — though Monday's $4 swing shows it still moves.
Nvidia Adds $150 Billion to Its Buyback
Nvidia raised its repurchase authorisation by a record $150 billion, taking remaining capacity to $235 billion through fiscal 2028. The shares trade near 16.5 times forward earnings, the lowest since January 2015 by LSEG's count, against a 15-year average near 30. Reuters noted buybacks across the market fell about 50% between July and 23 September. A company buying back its own shares at 16.5 times earnings is making a statement about its own discount rate. So is a market selling it at that price.
Starship Reaches Orbit
SpaceX's Starship reached orbit for the first time on Flight 14 and deployed all 26 Starlink V3 satellites. One vacuum engine shut down early, so SpaceX cut the mission short. The ship survived re-entry and made a controlled landing burn in the Pacific. SPCX still closed down 2.2% on a risk-off day.
Anthropic's Prospectus
Anthropic's IPO filing reportedly devotes about 80 of 261 pages to risk factors, including that its models could pose "catastrophic or existential risk to humanity." Reuters, CNBC and the FT report that the company is seeking a valuation near $2 trillion, reported a 2025 net loss of $42 billion, and plans about $518 billion of compute and infrastructure spending over the coming year. They also report that nearly a quarter of last year's revenue came from two customers. Separately, OpenAI delayed its GPT-6.1 Astra model over safety concerns, and AI executives are due at the White House tomorrow. Disclosure: this brief is drafted with an AI system built by Anthropic. We report the filing as we would any other and draw no conclusions about the offering.
4. MACRO & FED WATCH
Cook's speech matters because of what it concedes. She framed AI as a near-term inflationary force at a time when much of the market still treats it as a disinflationary one. Combined with oil above $100, that pushes the committee's reaction function toward October. Wire reports put October hike pricing near 70%.
Tomorrow's PCE is the check. Cook cited an estimate of 3.4% core year on year. A print at or above that, with a 0.3% or higher monthly core, keeps October the base case. Below it, the decision falls to Friday's payrolls.
5. ECONOMIC CALENDAR
Date
Time ET
Event
Note
TUE 29 Sep
4:15 PM
H.15
Monday's 6 bp — real or breakeven?
WED 30 Sep
8:30 AM
August PCE and incomes
Cook's est.: 3.8% / 3.4% core
Wed 30 Sep
—
QUARTER-END
Funding markets, US and Japan
Wed 30 Sep
—
AI executives at White House
Safety and policy
Thu 1 Oct
—
BOJ adds collateralized call rate
New money-market gauge
FRI 2 Oct
8:30 AM
September payrolls
And the August revision
Wed 14 Oct
8:30 AM
September CPI
October or December
Late Oct
—
Hyperscaler guidance
AI capex, post-Jupiter
Fri 30 Oct
—
APS Integrated Resource Plan
Arizona load growth
6. EARNINGS WATCH
CarMax rose about 4% before the bell after beating on earnings and revenue. Fair Isaac fell about 22% premarket after the FHFA announced mortgage-pricing changes that open FICO's credit-scoring role to competition. A policy change can move a stock as much as a quarter's results.
7. THE PRIMER: AI AND INFLATION — THE TIMING PROBLEM
For two years the common view has been that AI is disinflationary: machines doing work more cheaply should, over time, lower prices. On Monday a Fed governor argued that over the next year or two it works the other way. Both can be true. The difference is timing, and for interest rates timing is everything.
One: two channels, two clocks
Any big new technology hits the economy twice. First comes the demand impulse: the spending needed to build it — chips, data centres, power plants, transmission, construction workers, electricians. Later comes the supply impulse: the productivity gains once it is in use. The first raises demand before any extra output exists. The second adds output, and only then can it lower costs.
Cook adds a third channel: wealth. She said a large portion of the rise in equity prices in recent years can be attributed to enthusiasm about AI, and that the added wealth appears to be feeding through to household spending. The AI boom boosts demand twice before it boosts supply once.
Two: where it shows up
Fig. 3 — Every reading Cook cited sits above the Fed's 2% target. Electricity and water, the prices data centres compete for, are up around 5%.
Cook pointed to electricity and water costs up about 5% over the past year, which she said may be partly attributable to AI. She also noted that core goods prices, which were drifting down before the pandemic, are running above a 3% annual pace this year.This is the power story this brief has followed through Constellation, Vistra, Talen and Pinnacle West — seen from the consumer's side. The data centre's power bill and the household's power bill draw on the same grid.
Three: when the payoff arrives, and how big
Cook expects productivity gains to provide "modest disinflation within the next few years." How much depends on how quickly and broadly businesses adopt AI, how that becomes measured productivity, and whether the gains reach prices. She cited a study finding that nearly half of small employer firms use AI and that 71% of those report higher productivity. That matters because small businesses create most new jobs.
She also named the scenarios where relief is smaller. Gains could be concentrated among higher-income households who spend less of each extra dollar. Market concentration could let firms keep the gains as higher margins rather than lower prices. Or a painful stretch of job reallocation could leave unemployment higher. The disinflation is not automatic. It depends on competition.
Four: the link to real yields
This connects to the pattern in Section 2. An investment boom raises the demand for savings, and economists expect that to raise the neutral real interest rate — the rate that neither speeds up nor slows down the economy. A market that believes AI capital spending is lifting that neutral rate would push up real yields without pushing up inflation expectations. That is exactly what the H.15 has shown for six sessions. It is one reading among several — a higher term premium and a hawkish Fed produce the same picture — but it is the one Cook's speech supports.
THE AI TRADE'S OWN FEEDBACK LOOP
Last week's duration primer explained why AI stocks and AI infrastructure are sensitive to the discount rate. Cook's argument closes the loop: if AI spending itself pushes up inflation and real rates, the boom raises the discount rate applied to its own future profits. That is one way to read a record buyback from a company trading at its lowest multiple in more than a decade. It is a framework, not a verdict on any stock.
Five: what to watch
Three things would tell us which clock is winning. Electricity prices in CPI and PCE — the most direct AI demand signal. Unit labour costs and productivity in the quarterly data — the supply signal. And the gap between real yields and breakevens: while real yields do all the rising, the market is pricing a stronger economy. If breakevens join in, it is pricing an inflation problem.
8. ANALYST CALLS DRIVING ACTION
Jefferies cut Roblox to Underperform, arguing the 30% rally since second-quarter results priced in too much; the shares fell more than 8% in morning trading.In a market paying 5.2% on the ten-year, stocks whose valuations assume optimistic long-term bookings are the most exposed.
9. STOCKS TO WATCH
AI AND SEMICONDUCTORS
Nvidia (NVDA) — $150bn buyback; about 16.5 times forward earnings. AMD agreed to buy Fei-Fei Li's World Labs for $8.2bn in stock; Li becomes chief scientist. MongoDB (MDB) fell as much as 20% after its CEO left to join Meta. Oracle (ORCL) — still one notice.
AI-ENERGY AND THE POWER COMPLEX
Constellation (CEG), Vistra (VST), Talen (TLN), GE Vernova (GEV), Quanta (PWR), Pinnacle West (PNW). Cook's 5% electricity figure is both the bull and the bear case: scarce power is valuable, and a regulator watching household bills can move to cap what the grid charges.
PHYSICAL AI
Symbotic (SYM), Teradyne (TER), Serve Robotics (SERV), Cognex (CGNX). Cook's small-business adoption figures are the demand case for this group: automation for firms without in-house AI teams.
ALSO MOVING
Boeing (BA) fell about 6% to a 2026 low on a reported FAA delay to 737 MAX 10 certification. SpaceX (SPCX) up about 1% before the bell after Starship's orbit.
10. GLOBAL MACRO SNAPSHOT
Market
Development
Detail
United States
10-year 5.23%; October hike ~70% priced
Cook: AI adding to inflation
Middle East
Qatari-mediated talks; exports ~13m b/d
Brent $105.28 settle
Japan
10-year JGB near 3.1%
Quarter-end funding in focus
Canada
US ban on ~$1bn of imports in effect
Trade war escalates
Precious metals
Gold near $4,189
Steadying after Monday's fall
11. WEEK AHEAD PREVIEW
Today: H.15 at 4:15. Tomorrow: August PCE, quarter-end, AI executives at the White House. Friday: payrolls.
WHAT WE ARE WATCHING, STATED IN ADVANCE — UNCHANGED FROM MONDAY
One. Whether the ten-year breakeven breaks above 2.40%. Six sessions at 2.33–2.35% so far.
Two. Whether quarter-end passes quietly in US and Japanese funding markets.
Three. Whether core PCE is 0.3% or higher month on month. Added: whether core comes in at or above Cook's 3.4% year-on-year estimate. An estimate cited by a governor that misses by more than 0.1 point would itself be news.
12. THE CLOSING THOUGHT
Technologies that change the world usually make it more expensive before they make it cheaper. Railways, electrification and the internet each needed years of heavy building — steel, copper, labour, credit — before the productivity arrived. Cook's speech is a reminder that AI is no exception, and that the Fed has to set rates for the building phase, not the payoff phase.
For markets that is an uncomfortable combination. The AI boom is lifting the real cost of money, and the real cost of money is the discount rate on the AI boom. How that resolves depends on which clock runs faster — and tomorrow's inflation data is the next reading on the first one.Have a good Tuesday.
THE BROOKSIDE BRIEF · COMPILED 9:25 AM ET, TUESDAY 29 SEPTEMBER 2026, BEFORE THE OPEN SOURCES: FEDERAL RESERVE H.15, RELEASED 28 SEPTEMBER 2026, READ DIRECTLY — YIELDS THROUGH FRIDAY 25 SEPTEMBER; BREAKEVENS COMPUTED BY THIS DESK; GOVERNOR COOK, 'AN UPDATE ON AI AND THE ECONOMY', 28 SEPTEMBER 2026, READ DIRECTLY ON FEDERALRESERVE.GOV; ASSOCIATED PRESS INDEX TABULATIONS AND 10-YEAR FOR 28 SEPTEMBER; THESTREET (SECTORS, MOVERS, PREMARKET); INVESTINGLIVE / REUTERS / KPLER (OIL SETTLEMENT AND FLOWS); REUTERS VIA THESTREET (NVIDIA); CNN AND CNBC (STARSHIP); REUTERS, CNBC AND FT AS REPORTED (ANTHROPIC FILING); AP (OPENAI, CANADA) MONDAY'S TREASURY YIELD IS A MARKET QUOTE, NOT H.15 · ANTHROPIC FIGURES ARE AS REPORTED, NOT READ FROM THE FILING DISCLOSURE: THIS BRIEF IS RESEARCHED AND DRAFTED WITH THE ASSISTANCE OF AN AI SYSTEM BUILT BY ANTHROPIC · NOTHING IN THIS BRIEF IS INVESTMENT ADVICE
MORNING EDITION · WEDNESDAY, SEPTEMBER 30, 2026 · CORE PCE 3.0%, BELOW 3.3% EXPECTED · WILLIAMS: 'NO NEED FOR URGENCY' · OCTOBER HIKE ODDS NEAR A COIN FLIP · QUARTER-END TODAY
Daily Markets Briefing
The Brookside Brief
Markets · Macro · The Day Ahead
1. THE MORNING SETUP
The inflation report the market feared came in cool. Core PCE — the Fed's preferred gauge — rose 0.2% in August and 3.0% from a year earlier, against expectations of 0.3% and 3.3%. Headline PCE rose 0.3% on the month and 3.4% on the year, against 0.4% and 3.7% expected. Stock futures rose about 0.4% after the release, and the ten-year eased to about 5.22%.
It lands on a market that had already started to rethink October. On Tuesday New York Fed President John Williams — the committee's vice chair — said one more hike "may be appropriate late this year" but that "there is no need for urgency." Per CME FedWatch, odds of an October hike fell from over 70% to roughly a coin flip. A day earlier Governor Cook had made the case that AI is adding to inflation. The committee is now visibly split on timing, and this morning's number supports the patient side.
CORRECTION
Yesterday's brief said AI executives were due at the White House today. The meeting took place on Tuesday. We misread the timing of the wire report. The outcome is in Section 3.
THIS WEEK'S TESTS, SCORED
Three — core PCE at 0.3% or more, and at or above Cook's 3.4% estimate? No on both: 0.2% and 3.0%. We said a 0.1-point miss on a governor's cited estimate would be news. This one missed by 0.4 point. Previews had flagged that this release carries revisions, which is the most likely explanation, and the revised back months are what to check before reading it as a sharp slowdown. Resolved: the cool outcome.One — ten-year breakeven above 2.40%? Monday's H.15 has it at 2.34%, unchanged, for a seventh session in the 2.33–2.35% range. A cool PCE makes a break higher less likely. Not triggered; runs to Friday.Two — a quiet quarter-end? That is today. Pending. Carried over: Oracle's force majeure is still a one-off. Bloom Energy said on Tuesday that Oracle remains fully committed to its fuel-cell contract for Project Jupiter.
Fig. 1 — Every forecast was too high. Cook's estimates, cited two days before the release, were furthest off.
2. MARKETS AT A GLANCE
TUESDAY 29 SEPTEMBER — SMALL LOSSES, BIG YIELDS
Market
Close
Change
Per cent
Dow Jones Industrial
51,349.92
−131.59
−0.3%
S&P 500
7,670.84
−12.85
−0.2%
Nasdaq Composite
26,797.54
−22.84
−0.1%
Russell 2000
2,807.92
−9.99
−0.4%
10-year Treasury
~5.25%
near 5.3% intraday
high since 2007
Brent (settle)
$102.59
−$2.69
−2.6%
WTI (settle)
$89.38
−$3.22
−3.5%
The thirty-year reached levels last seen in 2002 on Tuesday, even as oil fell 2.6% on recovering Saudi Red Sea exports.Oil down, long yields up: that is not an inflation-scare pattern. It is a term-premium and real-rate pattern — the same message the breakeven has sent for seven sessions. Brent still heads for a September gain of about 13%.
Fig. 2 — Since 18 September the ten-year is up 23 bp and the real yield 22 bp. Inflation compensation has not moved.
3. TOP STORIES
Consumers at a Twelve-Year Low
The Conference Board's consumer confidence index fell 6.7 points to 81.9 in September, its lowest in 12 years and about 7 points below expectations. Mentions of prices, and oil and gas in particular, hit new highs. The share saying jobs are plentiful fell to its lowest since 2016, excluding the pandemic. August JOLTS showed openings dipping to about 7.1 million, with hires up to 5.2 million and layoffs down to 1.6 million. The measured labour market is stable. Households feel otherwise — and this morning's cool PCE suggests prices are not running away from them as fast as they fear.
Williams Takes October Off the Table — Almost
Williams forecast growth of about 2¼% this year and next, unemployment edging to about 4%, and overall inflation of 3½% this year, slowing to just above 2% next year. He said one more increase "may be appropriate late this year" and that there is "no need for urgency." "Late this year" means December, not October. From the vice chair, that is a signal.
The White House AI Accord
President Trump hosted AI leaders on Tuesday — including Anthropic's Dario Amodei, OpenAI's Greg Brockman, Google's Sundar Pichai, Meta's Mark Zuckerberg, Nvidia's Jensen Huang and Palantir's Alex Karp. They signed a short, voluntary "White House Accord on Super Intelligence", about 300 words with four layers of controls and audits, which Trump called "morally" binding. House Speaker Johnson said he hopes guardrails stay voluntary. Markets read voluntary as no new regulatory cost. Disclosure: this brief is drafted with an AI system built by Anthropic.
Oil Falls on Red Sea Flows
Brent fell $2.69 to $102.59 as Saudi exports from Red Sea ports recovered after this month's pipeline attack. Qatari-mediated contacts between Washington and Tehran continue. The market is steadily learning to price oil flows rather than headlines.
4. MACRO & FED WATCH
Within 48 hours the case for October weakened on three fronts: a dovish vice chair, a 12-year low in confidence, and a cooler-than-expected core PCE. Against it stand oil above $100, Cook's argument, and the S&P Global PMI at a five-year high last week.
Friday's payrolls now decide it. A strong report with firm wages puts October back in play. A soft one makes December — Williams' "late this year" — the base case. The committee will also have September CPI (14 October) in hand before it meets.
5. ECONOMIC CALENDAR
Date
Time ET
Event
Note
WED 30 Sep
—
QUARTER-END
Funding markets, US and Japan
Wed 30 Sep
9:45 AM
Chicago PMI
51.2 expected, 47.1 prior
Wed 30 Sep
After close
Micron earnings
Memory and AI demand
Thu 1 Oct
—
BOJ adds collateralized call rate
New money-market gauge
FRI 2 Oct
8:30 AM
September payrolls
October's decider
Wed 14 Oct
8:30 AM
September CPI
Before the 28 Oct meeting
Late Oct
—
October FOMC decision
Hike odds ~50%
Fri 30 Oct
—
APS Integrated Resource Plan
Arizona load growth
6. EARNINGS WATCH
Micron reports after the close — the first read on memory demand since the AI capex debate intensified. Carnival jumped nearly 12% in Tuesday morning trading after beating third-quarter estimates. Conagra reports this morning. Micron is the useful one: memory prices are a direct measure of how much AI hardware is actually being built, not just announced.
7. THE PRIMER: PCE VS CPI — WHY THE FED WATCHES A DIFFERENT NUMBER
The United States publishes two main measures of consumer inflation, and they rarely agree. The one most people hear about — CPI — is not the one the Fed targets. This morning's report is a good moment to see why, and why it matters that PCE ran 0.3 to 0.4 point below expectations.
One: two agencies, two questions
The Consumer Price Index comes from the Bureau of Labor Statistics. It asks: what do urban households pay out of pocket? The PCE price index comes from the Bureau of Economic Analysis, as part of the national accounts. It asks: what is spent on households' behalf, by anyone? That includes rural households, and spending made for consumers — employer-paid health insurance, Medicare and Medicaid — that never leaves a household's wallet.
Two: different baskets
Fig. 3 — Housing dominates CPI; medical care carries far more weight in PCE, because PCE counts what insurers and government pay.
Shelter is about 36% of CPI but only about 14% of PCE. Medical care services are about 7% of CPI but around 17% of PCE. So when rents are rising fast, CPI runs well above PCE; when health-care costs move, PCE feels it more. This is also why oil and gasoline hit the two measures differently, and why a month of rising energy costs can look worse in one than the other.
Three: different formulas
CPI uses weights that are updated periodically; PCE uses a chain-weighted formula that updates continuously as spending patterns shift. When beef gets expensive and shoppers switch to chicken, PCE captures the switch sooner. This "substitution" effect is one reason PCE has historically run somewhat below CPI over long periods.
WHY THE FED PREFERS PCE
Broader coverage, weights that track what people actually buy, and one more property: PCE history is revised as better data arrive, so the series gets more accurate over time. CPI is not revised apart from seasonal factors, which makes it better for contracts — Social Security, TIPS and wage agreements are indexed to it. The Fed wants the most accurate picture; markets want the number that can't change. That is why both matter.
Four: why forecasters usually get PCE right — and didn't today
PCE comes out after CPI and the producer price index, and much of it is built from their components. So economists can usually translate those into a close PCE estimate. Misses of 0.1 point are normal; 0.3–0.4 point is not. The likeliest reason is the annual update incorporated in this release, which previews flagged in advance — it can change both the weights and the back history. That is the lesson for reading today's number. Before concluding inflation dropped sharply in August, check the revised July figure. If July was also revised down, the level of inflation is lower than we thought, but the trend may be unchanged.
Five: what it means now
For the Fed, a core PCE at 3.0% is still a full point above target, and oil has not finished passing through. But the gap between what forecasters feared and what printed makes Williams' patience easier to defend. For markets, the question is the one this brief has asked every day: real yields or breakevens. A cool inflation print should, in principle, pull both down. If real yields keep rising anyway, the selloff is about something other than inflation — term premium, supply, or the higher neutral rate discussed yesterday.
8. ANALYST CALLS DRIVING ACTION
Jefferies raised its Bloom Energy target to $264 from $229, keeping a Hold; the shares jumped nearly 11% in morning trading. Goldman cut Equifax's target to $171 from $199.Bloom's rebound, a day after a near-9% slump, turned on one fact: its Oracle contract for Project Jupiter stands.
9. STOCKS TO WATCH
AI AND SEMICONDUCTORS
Micron (MU) tonight. Nvidia (NVDA) after its $150bn buyback. Oracle (ORCL) — one notice, contracts reaffirmed. Lumentum (LITE) rose about 6% in early trade on optical networking demand.
AI-ENERGY AND THE POWER COMPLEX
Constellation (CEG), Vistra (VST), Talen (TLN), GE Vernova (GEV), Quanta (PWR), Pinnacle West (PNW), and Bloom Energy (BE) — on-site power for data centres that cannot wait for the grid. A cooler PCE helps the most rate-sensitive names in this group only if real yields follow.
PHYSICAL AI
Symbotic (SYM), Teradyne (TER), Serve Robotics (SERV), Cognex (CGNX). AMD's World Labs purchase is a bet on world models — the software layer that robots and simulation will run on.
10. GLOBAL MACRO SNAPSHOT
Market
Development
Detail
United States
Core PCE 3.0%; confidence 12-yr low
October odds ~50%
Rates
30-year at 2002 levels Tuesday
Real yields, not breakevens
Oil
Brent $102.59, −2.6%
Saudi Red Sea exports recover
FX
Euro near lowest since May 2025
Dollar's biggest monthly gain vs euro in 14 months
Japan
Quarter-end today
Watch repo against the 1.25% reserve rate
11. WEEK AHEAD PREVIEW
Today: quarter-end, Chicago PMI, Micron. Thursday: the new quarter. Friday: payrolls.
WHAT WE ARE WATCHING, STATED IN ADVANCE
One (carried). Ten-year breakeven above 2.40% by Friday. Less likely after this morning.
Two (today). A quiet quarter-end. SOFR more than a few basis points above its recent level on 30 September or 1 October would count as noise; Japanese repo above the 1.25% reserve rate would count as a signal.
Three (new). Whether the ten-year real yield falls today. A cool core PCE that fails to lower real yields would confirm that this selloff is not about inflation.
12. THE CLOSING THOUGHT
Two days ago a Fed governor said AI was adding to inflation. This morning the Fed's preferred gauge came in cooler than she estimated, and cooler than the market expected. Both can be true. The inflation that AI and oil create is real, but it is showing up more in electricity bills and consumer anxiety than in the core index the Fed targets.
That leaves the bond market as the puzzle. Inflation expectations have not moved for seven sessions, and actual inflation just surprised lower. Yet ten-year real yields sit near 2.9%. If they fall today, the market was pricing the Fed. If they don't, it is pricing something larger — and that would be the more important story.Have a good Wednesday.
THE BROOKSIDE BRIEF · COMPILED 8:50 AM ET, WEDNESDAY 30 SEPTEMBER 2026, AFTER THE PCE RELEASE SOURCES: AUGUST PCE FIGURES AS REPORTED BY FOX BUSINESS AND CNBC FROM THE BEA RELEASE — THE BEA TEXT WAS NOT YET READABLE AT COMPILE; CONSENSUS PER LSEG AND YAHOO FINANCE; FEDERAL RESERVE H.15, RELEASED 29 SEPTEMBER, READ DIRECTLY; BREAKEVENS COMPUTED BY THIS DESK; AP INDEX TABULATIONS FOR 29 SEPTEMBER; NEW YORK FED AND REUTERS (WILLIAMS); CME FEDWATCH VIA YAHOO FINANCE; CONFERENCE BOARD VIA CNBC AND AXIOS; REUTERS VIA YAHOO (OIL); CNBC, CNN, ABC AND FORBES (WHITE HOUSE AI MEETING); THESTREET (MOVERS); CLEVELAND FED, BLS AND TD ECONOMICS (INDEX WEIGHTS) TUESDAY'S 10-YEAR IS A MARKET QUOTE, NOT H.15 · INCOME AND SPENDING DETAIL AND THE REVISED JULY FIGURES TO BE CONFIRMED AGAINST THE BEA RELEASE DISCLOSURE: THIS BRIEF IS RESEARCHED AND DRAFTED WITH THE ASSISTANCE OF AN AI SYSTEM BUILT BY ANTHROPIC · NOTHING IN THIS BRIEF IS INVESTMENT ADVICE
MORNING EDITION · FRIDAY, OCTOBER 2, 2026 · PAYROLLS +29,000 VS ~90,000 EXPECTED · UNEMPLOYMENT 4.2% · OCTOBER HIKE ODDS 16% · 10-YEAR TO ~5.18% · MICRON: RECORD QUARTER
Daily Markets Briefing
The Brookside Brief
Markets · Macro · The Day Ahead
1. THE MORNING SETUP
The labour market blinked. The US added 29,000 jobs in September, against about 90,000 expected. Unemployment rose to 4.2% from 4.1%. Average hourly earnings rose just 0.1% on the month and 3.0% on the year, against 0.3% and 3.2% expected. August was revised down to 133,000 from 162,000.
The market's reaction was immediate. Traders cut the implied odds of an October hike to about 16% — they were 64% a week ago. The ten-year fell to about 5.18% and the thirty-year to about 5.57%. Dow futures rose 0.8% and Nasdaq-100 futures 1%. In five trading days the October hike went from likely to unlikely: a dovish vice chair, a cool PCE and now a soft jobs report. Section 7 asks how much one jobs report should be trusted.
Fig. 1 — Three data points in five sessions took October off the table. December, Williams' "late this year", is now the market's base case.
THIS WEEK'S TESTS, SCORED
One — ten-year breakeven above 2.40% by Friday? No. The H.15 has it at 2.35% on Tuesday and 2.36% on Wednesday — nine sessions now inside 2.33–2.36%. Thursday's figure publishes this afternoon, and a soft payrolls report makes a break above 2.40% today unlikely. Not triggered.Two — a quiet quarter-end? Yes, in the US. SOFR printed 3.90% on 30 September, against 3.88% the day before and 3.90% on the 25th and 28th — no quarter-end spike. We have not found Japanese repo data for the day, so that half is unscored. Passed (US).Three — would the ten-year real yield fall on a cool PCE? No. On Wednesday the ten-year rose 3 bp to 5.29% and the real yield 2 bp to 2.93%, with core PCE at 3.0%. Confirmed: the selloff was not about inflation. A softer inflation print did nothing to real yields; it took a weak jobs report — a growth signal — to move them.
2. MARKETS AT A GLANCE
WEDNESDAY 30 SEPTEMBER AND THURSDAY 1 OCTOBER
Market
Wednesday
Thursday
S&P 500
7,651.54 (−0.3%)
7,666.45 (+0.2%)
Dow Jones Industrial
50,906.05 (−0.9%)
50,926.56 (<0.1%)
Nasdaq Composite
26,861.06 (+0.2%)
26,871.60 (<0.1%)
Russell 2000
2,796.86 (−0.4%)
2,806.63 (+0.4%)
10-year Treasury
5.29% (H.15)
~5.24% (market)
Brent (settle)
below $100
$102.31 (+4.4%)
Week to date through Thursday: S&P 500 −1.0%, Dow −1.7%, Nasdaq −0.7%. The ten-year reached 5.29% on Wednesday, which Bloomberg described as a 24-year high. Thursday's easing of about 5–6 bp came partly from safe-haven buying linked to concerns about France's fiscal outlook. Brent jumped 4.4% on Thursday after a report that the US is sending a third aircraft carrier group to the Middle East, and after Chinese refiners suspended refined-fuel exports for October.
TREASURY CONSTANT MATURITIES — TUESDAY AND WEDNESDAY (H.15)
Tenor
28 Sep
29 Sep
30 Sep
2-year
4.92%
4.89%
4.88%
10-year
5.24%
5.26%
5.29%
30-year
5.56%
5.59%
5.64%
10-year REAL (TIPS)
2.90%
2.91%
2.93%
30-year REAL (TIPS)
3.28%
3.29%
3.33%
5-year BREAKEVEN
2.33%
2.34%
2.36%
10-year BREAKEVEN
2.34%
2.35%
2.36%
30-year BREAKEVEN
2.28%
2.30%
2.31%
Fed funds, effective
3.88%
3.88%
3.88%
Fig. 2 — Since 18 September: the ten-year up 28 bp, real yields up 25 bp, the breakeven up 3 bp. The selloff has been real yields almost entirely.
3. TOP STORIES
September Payrolls: Soft on Every Line
Measure
Reported
Expected
Note
Nonfarm payrolls
+29,000
~+90,000
August revised to +133,000
Unemployment rate
4.2%
4.1%
Up from 4.1%
Avg hourly earnings, m/m
+0.1%
+0.3%
Avg hourly earnings, y/y
3.0%
3.2%
From 3.1% in August
The miss came after a week of steady signals: ADP showed 90,000 private jobs, initial claims fell to 197,000 and Challenger layoff announcements were the lowest for a September since 2022.Section 7 explains why those can coexist with a 29,000 headline — and why the August outlier, not September, may be the number that misled.
Micron: A Record Quarter, and a Bigger Guide
Micron reported fiscal fourth-quarter revenue of $54.2 billion, up 379% from a year earlier, and adjusted earnings of $33.42 a share against $31.61 expected. DRAM was $39.8 billion of revenue, with prices up in the high teens; NAND was $14.1 billion. It guided first-quarter revenue to $60–63 billion, and CNBC reports data-centre revenue rose about 11-fold. Memory is the hardest evidence that AI capital spending is still accelerating — the counterweight to last week's Oracle notice.
Oil: A Third Carrier
Bloomberg reported the US may soon base three carrier groups near Iran, sending an additional carrier and about 10,000 sailors and Marines. China's refiners suspended refined-fuel exports for October, tightening diesel, gasoline and jet fuel. Brent is near $102. Oil remains the one input that could still move breakevens; it hasn't yet.
Nike Misses; Anthropic Timing
Nike's fiscal first-quarter revenue of $11.21 billion fell 4% and missed the $11.33 billion estimate. It guided to a high-single-digit revenue decline for the year and announced job cuts; the shares fell as much as 6% after hours. Separately, Anthropic is reportedly looking to list as early as mid-November. Disclosure: this brief is drafted with an AI system built by Anthropic.
4. MACRO & FED WATCH
The case for October rested on three pillars: strong activity, sticky inflation and a tight labour market. This week knocked out the second and third. Core PCE came in at 3.0%; payrolls at 29,000 with unemployment rising and wages slowing. What remains is the S&P Global PMI at a five-year high — and oil.
December is now the live meeting, and September CPI on 14 October the next test. But the harder question for the Fed is the bond market. It has raised real borrowing costs 25 bp in two weeks without the Fed doing anything. A committee that wants tighter financial conditions has had them delivered. That is an argument for patience that Williams has already made.
5. ECONOMIC CALENDAR
Date
Time ET
Event
Note
Fri 2 Oct
10:00 AM
Factory orders, August
−0.1% expected
Fri 2 Oct
4:15 PM
H.15
Thursday's decomposition
Wed 14 Oct
8:30 AM
September CPI
Now the decisive print
Mid-Oct
—
Bank earnings
Season opens
Late Oct
—
October FOMC
Hike odds ~16%
Late Oct
—
Hyperscaler guidance
Micron says demand is still rising
Fri 30 Oct
—
APS Integrated Resource Plan
Arizona load growth
Mid-Nov
—
Anthropic IPO (reported)
Timing per reports
6. EARNINGS WATCH
Micron's guide of $60–63 billion for next quarter is roughly 11–16% above the quarter just reported. Nike's warning shows the other side of the economy: a consumer squeezed by fuel prices, in the same week confidence hit a 12-year low. The bank season opens in mid-October; a softer labour market makes credit quality the line to watch.
7. THE PRIMER: SIGNAL AND NOISE IN THE JOBS REPORT
No economic release moves markets like the monthly jobs report, and few are less precise. This morning's 29,000 took the October hike off the table. To read it well you need to know three things: the margin of error, the revisions, and the trend.
One: two surveys, two questions
The report combines two separate surveys. The establishment survey asks about 119,000 businesses and government agencies, covering roughly 622,000 worksites, how many people are on their payrolls. That produces the headline jobs number and wages. The household survey asks about 60,000 households whether their members are working or looking for work. That produces the unemployment rate. They can disagree in any given month, because they measure different things: the payroll survey counts jobs, the household survey counts people.
Two: the margin of error is larger than the headline
Fig. 3 — The 90% confidence band around any single month's change is about ±122,000. September's +29,000 is statistically indistinguishable from zero — and from +130,000.
The BLS says the 90% confidence interval for the monthly change in payrolls is about ±122,000. Its own example: a reported gain of 50,000 means the true change lies, with 90% confidence, somewhere between −72,000 and +172,000. For the unemployment rate the band is about ±0.3 percentage point. So September's +29,000 and a 0.1-point rise in unemployment are each, on their own, within the noise.
Three: revisions are part of the data
The first estimate is based on incomplete returns. Each month is revised twice as more reports arrive and seasonal factors are recalculated, and once a year the whole series is benchmarked to unemployment-insurance records. August's +162,000 became +133,000 today. Reading the first print as the truth is the most common mistake in market commentary.
Four: the trend is the signal
Here is the fact that changes the story. When it published August's +162,000, the BLS noted that it was well above the average monthly gain of 31,000 over the prior 12 months. September's +29,000 is almost exactly that average. In other words, the outlier this autumn may have been August, not September. The labour market has been growing slowly for a year; one strong month briefly suggested otherwise.
HOW THE MARKET READS IT ANYWAY
If the jobs number is that noisy, why did October odds fall from 23% to 16% in minutes? Because markets price probabilities, not certainties. A soft print shifts the odds even when it proves nothing on its own. And it matters most when it agrees with other data: this week it lined up with a 12-year low in consumer confidence, slowing wages and a cool core PCE. One noisy report confirming three others is worth more than one noisy report alone.
Five: what to watch next month
Three things would tell us whether September was a signal. Whether the next revision moves it up or down. Whether unemployment holds at 4.2% or rises again — two consecutive rises are far harder to dismiss. And whether wage growth stays near 3.0%, which, with core inflation at 3.0%, would mean real wages have stopped growing. That would be the consumer squeeze showing up in the hard data.
8. ANALYST CALLS DRIVING ACTION
The rate call has flipped from October to December in a week.The equity call follows: lower front-end yields help small caps and long-duration growth stocks most — the same duration logic from our 24 September primer, now running in reverse.
9. STOCKS TO WATCH
AI AND SEMICONDUCTORS
Micron (MU) after its record quarter. Nvidia (NVDA), AMD and the memory supply chain read across. Oracle (ORCL) — still one notice.
AI-ENERGY AND THE POWER COMPLEX
Constellation (CEG), Vistra (VST), Talen (TLN), GE Vernova (GEV), Quanta (PWR), Pinnacle West (PNW), Bloom Energy (BE). Lower yields are the relief these rate-sensitive names have waited a fortnight for; Micron's demand data is the fundamental support.
PHYSICAL AI
Symbotic (SYM), Teradyne (TER), Serve Robotics (SERV), Cognex (CGNX). A slower labour market cuts both ways for automation: less wage pressure, but also less urgency to replace scarce workers.
CONSUMER
Nike (NKE) after its miss and job-cut plan.
10. GLOBAL MACRO SNAPSHOT
Market
Development
Detail
United States
Payrolls +29k; unemployment 4.2%
October hike odds ~16%
Rates
10-year 5.29% Wed (H.15), ~5.18% after jobs
Real yields lead both ways
Oil
Brent ~$102
Third US carrier; China halts fuel exports
Europe
France fiscal worries
Safe-haven flows into Treasuries Thursday
Funding
SOFR 3.90% at quarter-end
No spike
11. WEEK AHEAD PREVIEW
Next week is lighter on data; the focus moves to the 14 October CPI and the start of bank earnings.
WHAT WE ARE WATCHING, STATED IN ADVANCE
One. Whether today's yield drop is real yield or breakeven. If the ten-year real yield falls more than the nominal on Monday's H.15 (Friday's data), the market is pricing a weaker economy and a gentler Fed — the mirror image of the past fortnight.
Two. Whether the ten-year holds below 5.20% through next Friday. Above it, the bond market is overriding the data; below it, the jobs report has reset the trend.
Three. Whether Brent holds above $100 with three carriers in the region. Oil is the only remaining route by which this episode becomes an inflation story.
12. THE CLOSING THOUGHT
A week ago the bond market was pricing a stronger economy and a Fed with more to do. Since then the inflation data cooled, a senior Fed official asked for patience, and the labour market came in soft. The October hike that looked likely now looks unlikely.
The lesson of this week is to respect the noise. A single jobs report carries a ±122,000 margin of error, and the strong August number that helped push yields up was revised down today. When the data is this noisy, the market's job is to weigh several imperfect readings together. This week, for the first time in a month, they pointed the same way.Have a good weekend.
THE BROOKSIDE BRIEF · COMPILED 9:40 AM ET, FRIDAY 2 OCTOBER 2026, AFTER THE JOBS REPORT SOURCES: SEPTEMBER EMPLOYMENT FIGURES AS REPORTED BY BENZINGA, YAHOO FINANCE AND CNN FROM THE BLS RELEASE — THE BLS TEXT WAS NOT YET READABLE AT COMPILE; BLS AUGUST RELEASE AND TECHNICAL NOTE, READ DIRECTLY; FEDERAL RESERVE H.15, RELEASED 1 OCTOBER, READ DIRECTLY; BREAKEVENS COMPUTED BY THIS DESK; NEW YORK FED SOFR VIA FRED; AP INDEX TABULATIONS FOR 30 SEPTEMBER AND 1 OCTOBER; CME FEDWATCH VIA YAHOO, FXSTREET AND BENZINGA; CNBC AND INVESTING.COM (MICRON); CNBC AND BLOOMBERG (OIL, CARRIERS); YAHOO FINANCE (NIKE, ANTHROPIC TIMING, CLAIMS, CHALLENGER, ADP) THURSDAY'S AND FRIDAY'S 10-YEAR LEVELS ARE MARKET QUOTES, NOT H.15 · WEDNESDAY'S BRENT SETTLE INFERRED FROM THURSDAY'S REPORTED 4.4% RISE TO $102.31 DISCLOSURE: THIS BRIEF IS RESEARCHED AND DRAFTED WITH THE ASSISTANCE OF AN AI SYSTEM BUILT BY ANTHROPIC · NOTHING IN THIS BRIEF IS INVESTMENT ADVICE
MORNING EDITION · WEDNESDAY, OCTOBER 7, 2026 · S&P 500 AT A RECORD · 10-YEAR AT 5.35%, A 2002 HIGH · FED MINUTES AT 2 PM · CONSTELLATION–GOOGLE 20-YEAR NUCLEAR DEAL
Daily Markets Briefing
The Brookside Brief
Markets · Macro · The Day Ahead
1. THE MORNING SETUP
Two markets, two stories. The S&P 500 closed at a record 7,818.93 on Tuesday, its first since August, and the Nasdaq set records on Monday and Tuesday. Meanwhile the ten-year Treasury is trading near 5.35% this morning — CNBC calls it the highest since 2002 — ahead of a 10-year note auction and the minutes of the Fed's September meeting at 2 p.m.
Friday's weak jobs report did not hold back the bond selloff for even a day. The ten-year dipped to about 5.18% after the release, then closed at 5.28%, up 4 bp on the day, per the H.15. It rose to 5.31% on Monday. Futures are lower this morning — Dow −0.7%, S&P −0.3% — and Brent is back near $102 on Houthi attacks on Saudi airports and a tropical storm heading for the Gulf. Section 7 asks how stocks can sit at records while bonds yield this much.
Fig. 1 — Since 25 September the S&P is up about 1% and the ten-year about 14 bp. Usually one of them gives way.
FRIDAY'S THREE TESTS, SCORED
One — was Friday's yield drop real yield or breakeven? There was no drop by the close. The ten-year rose 4 bp to 5.28%; the real yield rose 4 bp to 2.92%; the breakeven held at 2.36%. The intraday rally reversed completely, and the reversal was all real yield.Two — does the ten-year hold below 5.20% through this Friday? No: 5.28% on Friday, 5.31% on Monday. Failed on day one. We wrote that above 5.20% "the bond market is overriding the data". That is what happened. Three — does Brent hold above $100 with three carriers in the region? Yes, narrowly: about $102.25 on Friday, $100.32 on Monday, $100.58 on Tuesday, and near $102 this morning. Holding — by 32 cents at the low.
2. MARKETS AT A GLANCE
THREE SESSIONS: FRIDAY 2, MONDAY 5 AND TUESDAY 6 OCTOBER
Market
Friday
Monday
Tuesday
S&P 500
7,722.72 (+0.7%)
7,773.95 (+0.7%)
7,818.93 (+0.6%)
Dow Jones Industrial
51,176.96 (+0.5%)
51,267.90 (+0.2%)
51,521.28 (+0.5%)
Nasdaq Composite
27,190.86 (+1.2%)
27,477.31 (+1.1%)
27,599.79 (+0.4%)
Russell 2000
2,832.90 (+0.9%)
2,847.14 (+0.5%)
2,830.30 (−0.6%)
10-year Treasury
5.28% (H.15)
5.31% (H.15)
~5.27% (market)
Brent (settle)
~$102.25
$100.32
$100.58
So far this week: S&P 500 +1.2%, Nasdaq +1.5%, Dow +0.7%, Russell 2000 −0.1%.Small caps, the most rate-sensitive index, are the only one not participating — the duration logic of our 24 September primer, still at work.
TREASURY CONSTANT MATURITIES (H.15)
Tenor
1 Oct
2 Oct
5 Oct
2-year
4.78%
4.83%
4.84%
10-year
5.24%
5.28%
5.31%
30-year
5.61%
5.63%
5.66%
10-year REAL (TIPS)
2.88%
2.92%
2.95%
30-year REAL (TIPS)
3.31%
3.34%
3.37%
5-year BREAKEVEN
2.36%
2.37%
2.36%
10-year BREAKEVEN
2.36%
2.36%
2.36%
30-year BREAKEVEN
2.30%
2.29%
2.29%
Fig. 2 — Since 18 September: ten-year +30 bp, real yield +27 bp, breakeven +3 bp. The jobs report changed the Fed odds; it did not change this pattern.
3. TOP STORIES
Constellation and Google: 20 Years of Nuclear Power
Constellation Energy rose about 12% on Tuesday after announcing a 20-year power purchase agreement with Google. The deal funds equipment upgrades at 11 Constellation nuclear units in Illinois, Pennsylvania and New Jersey, adding 890 MW of new capacity to the PJM grid, with more than $4.3 billion of Constellation investment. A separate 15-year agreement covers a further 2,700 MW from the existing PJM fleet. This is the clearest validation yet of the thesis this brief has followed: connected, firm power is the scarce input of the AI build-out, and hyperscalers will sign for two decades to secure it. It is also, as our duration primer noted, a 20-year cash-flow stream — valued against a 5.3% ten-year.
Services Prices at a Four-Year High
The ISM services index slipped to 54.9 in September from 55.4, its 27th month of expansion, but the prices-paid component rose to 74.0, the highest since July 2022. No industry reported lower prices. This is the data point the bond market seized on after Friday: activity cooling a little, costs still rising. It argues the breakeven may yet move — though it hasn't so far.
Deals and Debt
Schneider Electric agreed to buy PTC for about $22 billion in cash; PTC jumped about 33% on Monday. SpaceX is reportedly seeking about $40 billion — some $10 billion in bank loans and $30 billion of investment-grade debt, led by Apollo — to buy Nvidia chips, per the FT. Debt-financed AI hardware at today's rates is exactly the kind of long-duration bet Section 7 is about.
Iran, the Houthis and a Gulf Storm
Vice President Vance said Iran must make a "meaningful" reduction in enrichment capacity to end the war. Houthi attacks hit Saudi airports in Jazan and Najran on Monday. Tropical Storm Isaias is forecast to become the season's first hurricane, with possible landfall between eastern Louisiana and the Florida Panhandle late Friday or Saturday. Florida has declared an emergency in 25 counties.
4. MACRO & FED WATCH
October hike odds are near 20%, per a Capital.com analyst — a December move remains the market's base case. Today's minutes are expected to show a broader debate than September's unanimous vote, Reuters reports. The detail to look for is whether members discussed the bond market itself: a ten-year that has risen 30 bp since the meeting has tightened financial conditions more than another 25 bp hike might. If the minutes say so, December odds will fall too.
Today's 10-year auction is the other test. Soft demand at Treasury sales — including a weak five-year auction last month — has accompanied this selloff. A weak result alongside hawkish minutes would put 5.40% in play.
5. ECONOMIC CALENDAR
Date
Time ET
Event
Note
WED 7 Oct
1:00 PM
10-year note auction
Demand test at 2002 highs
WED 7 Oct
2:00 PM
FOMC minutes (Sept meeting)
How broad was the debate?
Wed 7 Oct
4:15 PM
H.15
Tuesday's decomposition
Fri–Sat
—
Isaias landfall window
Gulf oil and gas output
Wed 14 Oct
8:30 AM
September CPI
After ISM prices at 74
Mid-Oct
—
Bank earnings
Season opens
Late Oct
—
October FOMC
Hike odds ~20%
Fri 30 Oct
—
APS Integrated Resource Plan
Arizona load growth
6. EARNINGS WATCH
FactSet now expects S&P 500 third-quarter earnings growth of 29.5%, up from 26.7% at the start of the quarter. Analysts raised estimates during the quarter — unusual; over five years they have typically cut them by about 2%. And 72 of 116 companies issuing guidance gave positive guidance, far above the averages. This is the fuel behind the record. Constellation Brands fell about 5% premarket after a miss despite reaffirming guidance; Lamb Weston rose on Tuesday after beating.
7. THE PRIMER: RECORDS AT 5.3% — THE EQUITY RISK PREMIUM
Rising bond yields are supposed to pull stock prices down: cash in the future is worth less, and bonds offer competition. Yet the S&P 500 set a record on Tuesday with the ten-year above 5.25%. The explanation lies in a concept this brief has used before: the equity risk premium.
One: price = earnings × multiple
An index's price can be split in two: what companies earn, and what investors pay for each dollar of those earnings — the price-to-earnings multiple. Rising yields usually push the multiple down. But if earnings rise faster, the price can still go up. That is what has happened. FactSet puts the S&P 500's forward multiple at 19.0, down from 20.4 at the end of June and below its five- and ten-year averages. Earnings estimates rose faster than prices: analysts expect 32.4% earnings growth for 2026.
THE RECORD, DECOMPOSED
The market is at a record not because investors are paying more for earnings, but because there are more earnings to pay for. The multiple has fallen since June — the bond market has been doing its job on valuations. Earnings growth has more than offset it. That is a healthier record than one built on a rising multiple. But it rests on those earnings arriving.
Two: the earnings yield
Flip the P/E upside down and you get the earnings yield: 1 ÷ 19.0 ≈ 5.3%. It is a rough measure of what a dollar invested in the index earns today. Comparing it with bond yields gives a crude gauge of how much extra stocks offer for their extra risk — the equity risk premium.
Fig. 3 — Against the nominal ten-year, stocks now offer almost nothing extra. Against the real yield, about 2.3 points — which is the fairer comparison, since earnings grow with inflation.
Three: nominal or real — which comparison is right?
Against the nominal ten-year (5.29% on 30 September), the earnings yield is about the same — a premium near zero. On that comparison stocks look expensive relative to bonds. But company earnings tend to rise with inflation, while a bond's coupon doesn't, so many analysts compare the earnings yield with the real yield instead. On that basis the gap is about 2.3 points. That is positive but thinner than through most of the past decade, when real yields were near or below zero.
This is why the breakeven matters for stocks, not just bonds. Our daily test has shown the selloff is in real yields — the measure that competes directly with the equity earnings yield. Each basis point on the TIPS yield trims the equity cushion one for one.
Four: what keeps the record intact — and what breaks it
The record survives as long as earnings keep beating and real yields stop rising. It is vulnerable to either: an earnings season that disappoints a 29.5% bar, or real yields that keep climbing. Note who is not at a record: the Russell 2000, whose companies borrow at floating rates and earn less from AI. The index record is narrower than it looks — a point Capital.com's analyst made this morning about mega-cap technology dominating performance.
As always, this is a framework, not a call. The earnings yield is a blunt tool: it ignores growth differences, buybacks and the composition of the index. What it does well is show when the cushion between stocks and bonds is thick or thin. Right now it is thin.
8. ANALYST CALLS DRIVING ACTION
Citi upgraded Flutter Entertainment to Buy with a $91 target.The bigger call is FactSet's tally: the bottom-up analyst target implies about 20% upside for the S&P 500 over 12 months, as of late September. Those targets assume the multiple holds; Section 7 explains why that is the assumption to watch.
9. STOCKS TO WATCH
AI-ENERGY AND THE POWER COMPLEX
Constellation (CEG) after the Google deal. Vistra (VST) and Talen (TLN) — the same scarcity, read across. GE Vernova (GEV) and Quanta (PWR) — uprates need equipment and grid work. Pinnacle West (PNW) ahead of its 30 October resource plan. Bloom Energy (BE) — on-site power. Hurricane season adds a near-term grid-reliability angle for Gulf utilities.
AI AND SEMICONDUCTORS
Nvidia (NVDA) — SpaceX's reported $40bn chip financing. Micron (MU) after its record quarter. Oracle (ORCL) — still one force majeure notice.
PHYSICAL AI
Symbotic (SYM), Teradyne (TER), Serve Robotics (SERV), Cognex (CGNX). PTC, being acquired by Schneider, makes industrial design and factory software — the deal values the digital layer of manufacturing at about $22bn.
One. Whether the ten-year real yield closes above 3.00% this week. That would mean the equity cushion against TIPS has narrowed to about 2.25 points or less — and would test whether the record can hold.
Two. Whether the S&P 500 holds above 7,722.72 — last Friday's close — through Friday. Above it, earnings optimism is winning; below it, rates are.
Three. Whether the minutes mention the bond market's tightening of financial conditions. If yes, December odds should fall and long yields ease; if not, the market has no reason to stop selling bonds.
12. THE CLOSING THOUGHT
For a month this brief has tracked a bond market pricing a higher real cost of money. This week the stock market answered: it doesn't mind, as long as earnings keep growing 30%. The record is real, and it is built on earnings rather than optimism about multiples.
But the cushion is thin. With the earnings yield about equal to the nominal ten-year and 2.3 points above the real one, stocks are priced for earnings to keep delivering and real yields to stop rising. Earnings season, which starts next week, answers the first. The bond market — today, at 1 p.m. and 2 p.m. — answers the second.Have a good Wednesday.
THE BROOKSIDE BRIEF · COMPILED 9:30 AM ET, WEDNESDAY 7 OCTOBER 2026, BEFORE THE OPEN SOURCES: FEDERAL RESERVE H.15, RELEASED 6 OCTOBER, READ DIRECTLY — YIELDS THROUGH 5 OCTOBER; BREAKEVENS COMPUTED BY THIS DESK; AP INDEX TABULATIONS FOR 2, 5 AND 6 OCTOBER; FACTSET EARNINGS INSIGHT, 2 OCTOBER, READ DIRECTLY; ISM VIA PR NEWSWIRE AND YAHOO FINANCE; GOOGLE / CONSTELLATION ANNOUNCEMENT VIA BUSINESS WIRE AND WORLD NUCLEAR NEWS; THESTREET AND CNBC (TREASURIES, PREMARKET, PTC, SPACEX/FT, IRAN, ISAIAS); OIL SETTLEMENTS VIA WIRE REPORTS (FRIDAY INFERRED FROM MONDAY'S REPORTED 1.89% FALL) TUESDAY'S AND WEDNESDAY'S 10-YEAR LEVELS ARE MARKET QUOTES, NOT H.15 · EARNINGS-YIELD COMPARISON COMPUTED BY THIS DESK DISCLOSURE: THIS BRIEF IS RESEARCHED AND DRAFTED WITH THE ASSISTANCE OF AN AI SYSTEM BUILT BY ANTHROPIC · NOTHING IN THIS BRIEF IS INVESTMENT ADVICE
MORNING EDITION · TUESDAY, OCTOBER 13, 2026 · BANKS OPEN EARNINGS SEASON · CPI TOMORROW · BRENT $106.65, A FOUR-WEEK HIGH · EL NIÑO HEADS FOR A RECORD
Daily Markets Briefing
The Brookside Brief
Markets · Macro · The Day Ahead
1. THE MORNING SETUP
Earnings season opened this morning and the results were mixed. JPMorgan earned $5.57 a share, below the roughly $5.90 analysts expected, after $658 million of securities losses; excluding them it earned $5.75 — still short. Goldman Sachs and Citigroup beat; Wells Fargo was lower premarket. S&P futures turned slightly negative after the releases, per Investing.com. The bigger event is tomorrow's September CPI.
Since our last edition the bond market got a reprieve. The ten-year touched 5.365% intraday last Wednesday — the highest since April 2002 — then a $39 billion 10-year auction drew its strongest demand since 2016, CNBC reported. By Thursday the H.15 ten-year was 5.22%, down 9 bp from the 5 October peak. Stocks held close to their record despite an AI wobble on Thursday. Treasuries reopen today after Monday's Columbus Day holiday. Oil is back up — Brent settled at $106.65 on Monday, its highest since 15 September, after more Houthi attacks on Saudi Arabia. Section 7 takes up a slower story you asked about: El Niño and the crop trade.
Fig. 1 — The auction and the minutes marked the turn. As throughout this selloff, the move was in real yields; the breakeven barely moved.
LAST WEDNESDAY'S THREE TESTS, SCORED
One — does the ten-year real yield close above 3.00% this week? No. It read 2.91%, 2.92% and 2.87% on Tuesday to Thursday; Friday's H.15 posts at 4:15 today but would need a 13 bp one-day jump. Not triggered.Two — does the S&P 500 hold above 7,722.72 through Friday? Yes. The lowest close was 7,765.36 on Thursday, and Friday closed at 7,811.54. Passed.Three — do the minutes mention the bond market tightening financial conditions? They mentioned it but dismissed it: despite the recent rise in longer-term yields, participants judged financial conditions "supportive" of growth, per CNBC and PNC. Effectively no. We also wrote that if the answer was no, the market had "no reason to stop selling bonds". That was wrong: yields fell anyway, helped by the auction. Demand, not the Fed, turned it.
2. MARKETS AT A GLANCE
FOUR SESSIONS SINCE OUR LAST EDITION
Market
Wed 7
Thu 8
Fri 9
Mon 12
S&P 500
7,801.77 (−0.2%)
7,765.36 (−0.5%)
7,811.54 (+0.6%)
7,807.24 (−0.1%)
Dow Jones
51,179.87 (−0.7%)
51,231.64 (+0.1%)
51,654.95 (+0.8%)
51,850.55 (+0.4%)
Nasdaq Comp.
27,538.69 (−0.2%)
27,193.34 (−1.3%)
27,366.17 (+0.6%)
27,245.90 (−0.4%)
10-year (H.15)
5.28%
5.22%
4:15 today
Closed
Brent (settle)
—
—
~$104.72
$106.65
The S&P 500 rose 1.2% last week. Brent's Friday level is inferred from Monday's reported $1.93 gain. The Russell 2000 closed near 2,794 on Monday, down about 0.5%; sources differ slightly on the exact figure. Our Brent-above-$100 test from 2 October has now held for a second week.
TREASURY CONSTANT MATURITIES (H.15)
Tenor
6 Oct
7 Oct
8 Oct
2-year
4.79%
4.77%
4.75%
5-year
5.03%
5.03%
4.99%
10-year
5.27%
5.28%
5.22%
30-year
5.64%
5.67%
5.60%
5-year REAL (TIPS)
2.66%
2.66%
2.62%
10-year REAL (TIPS)
2.91%
2.92%
2.87%
30-year REAL (TIPS)
3.35%
3.36%
3.31%
5-year BREAKEVEN
2.37%
2.37%
2.37%
10-year BREAKEVEN
2.36%
2.36%
2.35%
30-year BREAKEVEN
2.29%
2.31%
2.29%
The effective fed funds rate is 3.88%.Oil is at $106 and food prices are rising, yet the ten-year breakeven sits at 2.35% — lower than a month ago. The bond market still does not expect either to stick. Tomorrow's CPI tests that view.
3. TOP STORIES
Banks: Trading Strong, JPMorgan Short
JPMorgan's revenue was $50.9 billion, up 8%, slightly below estimates. Equity trading revenue jumped 49% to a third-quarter record of $4.95 billion, per Bloomberg, while fixed-income trading fell 4%. JPMorgan also cut buybacks to $664 million. Goldman's advisory revenue reached a record $1.65 billion, up 18%. Citi earned $2.85 a share against $2.66 expected (LSEG). Wells Fargo earned $1.87 a share. Premarket moves have swung: JPMorgan was off about 3.5% early, then turned higher, per Quartz. Strong trading and deal fees match a market at records. JPMorgan cutting buybacks is the detail to watch: it suggests the largest US bank is building capital rather than handing it back.
OpenAI's Revenue Restatement Hits the AI Trade
On Thursday, OpenAI told investors its annualized revenue was about $50 billion at end-September, not the widely cited $68 billion, per the Financial Times. The higher number had included partners' gross revenue. Oracle fell more than 5%, Nvidia about 3% and AMD nearly 4%; the Nasdaq lost 1.25%. OpenAI said its run rate grew 77% in the quarter. Several analysts called the selloff overdone, since the issue is accounting rather than demand. But the AI build-out is financed against revenue forecasts, and a $20 billion gap in the most-watched one matters. Chip stocks kept falling on Monday — the SOX lost 2.7% and SMH fell for a fifth straight session — on a report that China's CXMT is moving into next-generation memory.
Disclosure: the $68 billion figure reportedly counted partners' gross revenue to allow a more direct comparison with Anthropic, an OpenAI competitor. This brief is drafted with the help of an AI system built by Anthropic.
Oil: Houthi Attacks and a Hurricane
Brent rose $1.93 on Monday to settle at $106.65, and WTI rose $1.89 to $93.74 (Reuters). Houthi attacks on Saudi Arabia and drone strikes on tankers near Oman and in the Strait of Hormuz outweighed President Trump's announcement of Russian diesel supplies. Hurricane Isaias shut in up to about 70% of Gulf of Mexico oil output late last week, per the regulator. Production returns after post-storm inspections. Analysts flagged refinery risk at Pascagoula and Mobile — about 2.4% of US capacity — as the bigger worry for pump prices.
SpaceX Moves Into Wireless
Verizon, AT&T and T-Mobile each fell 8% or more on Friday after SpaceX said it had a deal to buy spectrum licences.Investors are asking whether a satellite operator, already raising tens of billions for AI hardware, can become a mobile competitor.
4. MACRO & FED WATCH
The minutes of the September meeting said most participants judged that another increase "would likely be appropriate" by year-end. Markets agree: one preview, citing CME FedWatch, puts the odds of an October move near 19% and a December move near 85%. The next meeting is 27–28 October.
Tomorrow's CPI: consensus expects headline inflation of about 3.7% year on year, up from 3.4%, and 0.6% on the month, mostly energy. Core is expected at 0.2% on the month, with estimates of 2.4–2.5% on the year. The Cleveland Fed nowcast has core near 0.20%. Previews agree that core is what matters. A 0.3% or higher reading could revive October hike talk; 0.2% or lower would keep December the base case.
The IMF said this week in its World Economic Outlook that AI investment is propping up global growth, but that war and debt threaten the outlook.
5. ECONOMIC CALENDAR
Date
Time ET
Event
Note
TUE 13 Oct
Pre-open
JPM, GS, C, WFC results
Season opens
Tue 13 Oct
4:15 PM
H.15 (Friday 9 Oct data)
Real-yield test closes
WED 14 Oct
8:30 AM
September CPI
Core 0.2% expected
This week
—
PPI; TSMC results
AI demand read
27–28 Oct
—
October FOMC
Hike odds ~19%
Fri 30 Oct
—
APS Integrated Resource Plan
Arizona load growth
Fri 6 Nov
—
FAO Food Price Index
October crop prices
Mid-Nov
—
NOAA ENSO update
Record-event odds
6. EARNINGS WATCH
Analysts expect S&P 500 third-quarter earnings growth of about 30%; FactSet's tally was 29.5% last week. That is the bar today's banks began to test. A miss from JPMorgan — which had beaten in 16 of the previous 20 quarters, per StreetAccount — is not a verdict on the season. The breadth of beats over the next three weeks will be.
7. THE PRIMER: EL NIÑO AND THE CROP TRADE
Most of this brief tracks markets that reprice in seconds. Crop markets respond to something slower: the weather over the Pacific. This autumn's El Niño may be the strongest on record, and it is already moving some commodity prices. Here is how it works and why the effects arrive unevenly.
One: what El Niño is
El Niño is a periodic warming of the surface of the eastern and central tropical Pacific. The warmer water shifts where tropical storms form, which redirects rainfall and jet streams around the world. Forecasters call these distant effects teleconnections. NOAA now measures El Niño with a relative index (RONI), comparing the key Pacific region with the tropics as a whole so that general ocean warming isn't counted as El Niño.
The numbers are large. The relative anomaly rose from 1.7°C in August to 2.1°C in September. NOAA gives a 100% chance of a "very strong" event this autumn, and an 83% chance that October–December sets a record (2.5°C or more). Parts of the eastern Pacific are up to 5°C above normal.
Fig. 2 — A record event is now the base case. But historically El Niño has cut wheat and maize yields only slightly and raised soybean yields.
Two: who gets hurt, who benefits
The usual El Niño pattern dries out Indonesia, Malaysia, Australia, southern Africa and West Africa, and brings more rain to southern South America and the southern United States. For markets that means:
Palm oil — Indonesia and Malaysia grow about 90% of it. Drought cuts yields, but with a 6- to 24-month lag, so 2027 is the year at risk. Sugar — the fastest mover this year, though not for the usual reason: excess rain in Brazil is waterlogging cane. Raw sugar hit a 19-month high of 21.24¢ a pound last Wednesday and closed at 20.72¢ on Monday (Reuters). Cocoa and coffee — West Africa is dry and Ivory Coast port arrivals are down 52% on the year, but a large 2025/26 cocoa surplus has held prices down; for arabica the risk is the 2027/28 crop. Soybeans — the counterexample. Rain in Argentina has historically helped, and Cao et al. (2023) find that El Niño has raised global soybean yields by about 1.9% on average.
WHY VEGETABLE OILS ARE THE PLACE TO WATCH
Purdue economists note that vegetable oils are where research most consistently finds El Niño price effects. The mechanism is substitution. When palm oil gets scarce, buyers switch to soybean and other oils, so prices rise together. This year adds a second source of demand: biofuels. The EPA's March rule raised required biomass-based diesel by about 60%, and Indonesia is moving to a 50% biodiesel blend (B50). Both pull vegetable oil out of the food system just as El Niño threatens supply.
Three: why prices haven't jumped yet
The supply shock arrives later; inventories are there now. Malaysia's palm oil stocks hit a record 3.51 million tonnes in September on record production, and palm futures slipped 0.8% on Monday to 4,598 ringgit. The cocoa market has a large surplus. Futures prices reflect expected supply over the life of the contract, so a full warehouse today offsets a feared shortfall next year. StoneX told Reuters the market is looking toward 2027. Sugar has moved first because its damage is happening now, during Brazil's harvest — not 12 months from now.
Four: from the field to the CPI
The FAO Food Price Index rose 1.5% in September to 136.0, up 5.8% on the year. Sugar rose 6.1%, cereals 5.1% — wheat to its highest since August 2023 — and vegetable oils 0.9%, up 18.3% on the year.
Fig. 3 — September's rise was led by weather-exposed crops. Meat and dairy were flat to lower.
Commodity prices reach supermarket shelves slowly and in diluted form. Raw crops are a small share of what a shopper pays — labour, packaging, transport and retail margins make up most of it. A crop shock this winter shows up in US food CPI over the following year, not next month. That makes El Niño a 2027 inflation story more than a 2026 one, and links it back to our daily test. The ten-year breakeven, at 2.35%, prices almost none of it. If palm, sugar and wheat keep rising into winter while oil holds above $100, that is the kind of evidence that would eventually move it.
Five: a framework, not a call
Every El Niño differs from the average, and inventories, policy and currencies can overwhelm the weather. What the framework says is where to look: vegetable oils over grains, sugar now, palm and cocoa later, and the southern hemisphere as the possible beneficiary. The dates: NOAA's update in mid-November, the FAO index on 6 November, and Malaysia's monthly palm data. None of this is a trading recommendation.
8. ANALYST CALLS DRIVING ACTION
Goldman Sachs raised its December Brent forecast to $90 from $85, and estimates a risk premium of just over $20 in the current price, per Reuters. That gap is the market paying for Middle East supply risk. A $90 forecast with Brent at $106 means Goldman expects that premium to shrink — the opposite of Monday's move.
9. STOCKS TO WATCH
AI-ENERGY AND THE POWER COMPLEX
Constellation (CEG), Vistra (VST) and Talen (TLN) — the OpenAI revenue story tests investors' patience with long power contracts signed for AI demand. GE Vernova (GEV) and Quanta (PWR) — Isaias repair and grid work. Pinnacle West (PNW) ahead of its 30 October resource plan. Bloom Energy (BE) — on-site power.
AI AND SEMICONDUCTORS
Oracle (ORCL) and Nvidia (NVDA) after the OpenAI revision. Micron (MU) on the CXMT memory report. TSMC reports this week. Ciena (CIEN) fell about 10% on Monday.
PHYSICAL AI
Symbotic (SYM), Teradyne (TER), Serve Robotics (SERV), Cognex (CGNX) — no company news; they trade with the chip complex this week.
BANKS AND TELECOMS
JPMorgan (JPM), Goldman (GS), Citi (C), Wells Fargo (WFC) today. Verizon (VZ), AT&T (T), T-Mobile (TMUS) after the SpaceX spectrum deal.
10. GLOBAL MACRO SNAPSHOT
Market
Development
Detail
United States
S&P near record; 10-year 5.22% (8 Oct)
CPI tomorrow
Fed
October ~19%, December ~85%
Minutes: more hikes likely
Oil
Brent $106.65, WTI $93.74
Houthi attacks; Isaias
Food
FAO +5.8% y/y; sugar near 19-month high
El Niño heading for a record
Southeast Asia
Malaysian palm stocks a record 3.51 mt
2027 supply risk
IMF
AI investment propping up growth
War and debt risks
11. WEEK AHEAD PREVIEW
Today: bank results; H.15 at 4:15. Tomorrow: CPI. Later this week: PPI and TSMC.
WHAT WE ARE WATCHING, STATED IN ADVANCE
One. Whether September core CPI prints 0.3% or higher. If yes, October hike odds should jump well above 19%; if 0.2% or lower, December stays the base case.
Two. Whether the ten-year breakeven moves 3 bp or more between the H.15 readings for 13 and 14 October. It has been stuck at 2.35–2.37% for a month. A move on a CPI day would be the first sign the bond market is pricing inflation rather than real rates.
Three. Whether raw sugar settles above last Wednesday's 21.24¢ high by Friday. Above it, the El Niño story is moving from forecast into prices; below it, the market still trusts inventories.
12. THE CLOSING THOUGHT
The bond market spent September pricing a higher real cost of money. Last week, an auction showed buyers will step in at 5.3%. This week, earnings and CPI test both sides: whether profits can support the record, and whether inflation will force the Fed's hand.
El Niño adds a slower clock. Its effect on prices is real but lagged — sugar first, palm and cocoa next year, and US grocery bills after that. The breakeven says the market isn't worried. It may not need to be yet, but it is worth knowing which indicators would change that.Have a good Tuesday.
THE BROOKSIDE BRIEF · COMPILED 8:45 AM ET, TUESDAY 13 OCTOBER 2026, BEFORE THE OPEN SOURCES: FEDERAL RESERVE H.15, RELEASED 9 OCTOBER — YIELDS THROUGH 8 OCTOBER; BREAKEVENS COMPUTED BY THIS DESK; AP INDEX TABULATIONS; CNBC AND PNC (FOMC MINUTES, 10-YEAR AUCTION); FT VIA QUARTZ AND YAHOO FINANCE (OPENAI); JPMORGAN 8-K, QUARTZ, LSEG VIA CNBC (BANK RESULTS); REUTERS (OIL SETTLEMENTS, GOLDMAN FORECAST; SOFTS AND PALM VIA BUSINESS RECORDER); MMA VIA CNN AND GCAPTAIN (ISAIAS); NOAA CLIMATE.GOV ENSO BLOG; PURDUE AGRICULTURAL ECONOMICS REPORT, 31 JULY; FAO FOOD PRICE INDEX, 2 OCTOBER; CPI CONSENSUS FROM PUBLISHED PREVIEWS FRIDAY'S BRENT INFERRED FROM MONDAY'S REPORTED GAIN · PREMARKET BANK MOVES ARE EARLY AND VOLATILE DISCLOSURE: THIS BRIEF IS RESEARCHED AND DRAFTED WITH THE ASSISTANCE OF AN AI SYSTEM BUILT BY ANTHROPIC · NOTHING IN THIS BRIEF IS INVESTMENT ADVICE